

LukaTDB
A guest post by Ovi
All of the Crude plus Condensate (C + C) production data for the US state charts comes from the EIAʼs November Petroleum Supply monthly PSM which provides updated information up to September 2022.
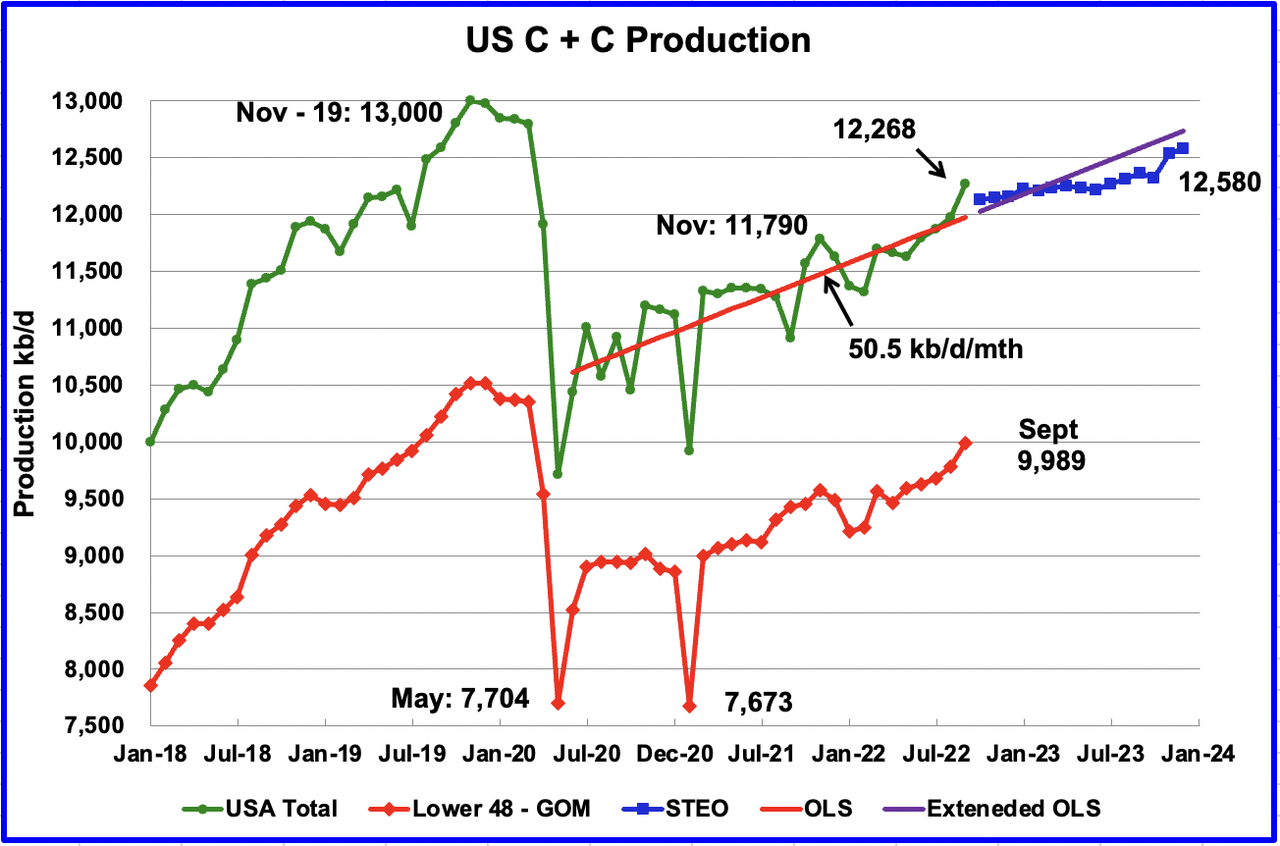
U.S. September production increased by 289 kb/d to 12,268 kb/d. It should be noted that August’s oil production was revised up by only 4 kb/d in the current September report. The large increase over the August update is real. For September, the states with the largest increase were Texas 90 kb/d, New Mexico 75 kb/d and North Dakota 43 kb/d. The Gulf of Mexico added 64 kb/d.
September’s production was at a new post-pandemic high and crossed 12,000 kb/d. It is now 732 kb/d below the pre-pandemic high of 13,000 kb/d.
While overall US oil production increased, a clearer indication of the health of US production can be gleaned by looking more closely at the Onshore L48 states. In the Onshore L48, September production increased by 208 kb/d to 9,989 kb/d. This means that 72% of the increase in US production came from the Onshore L48.
The blue graph, taken from the November 2022 STEO, is the production forecast for the U.S. from October 2022 to December 2023. Output for December 2023 is expected to be 12,580 kb/d.
The red OLS line from June 2020 to September 2022 indicates a monthly production increase of 50.5 kb/d/mth over that period. The first portion of red line stops at September because that is the range covered by the OLS analysis. The second portion is the same OLS line extended to see how well it fits the STEO forecast.
Oil Production Ranked by State
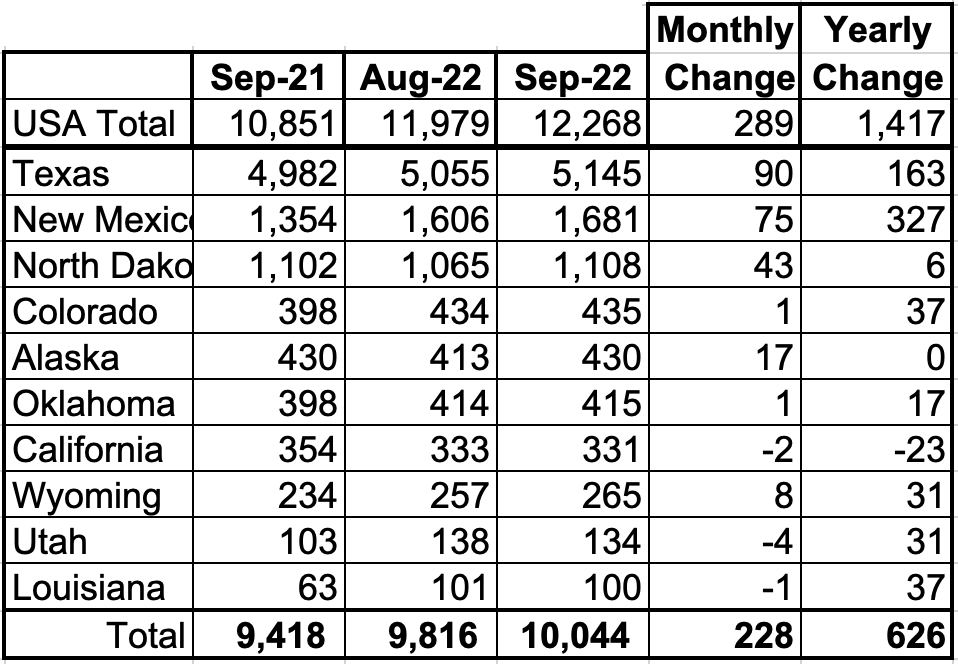
Listed above are the 10 states with the largest US production. These 10 accounted for 81.9% of all U.S. oil production out of a total production of 12,268 kb/d in September 2022.
On a YoY basis, US production increased by 1,417 kb/d with the majority having come from Texas and New Mexico. Note that only California is producing less crude this year than a year ago.
State Oil Production Charts
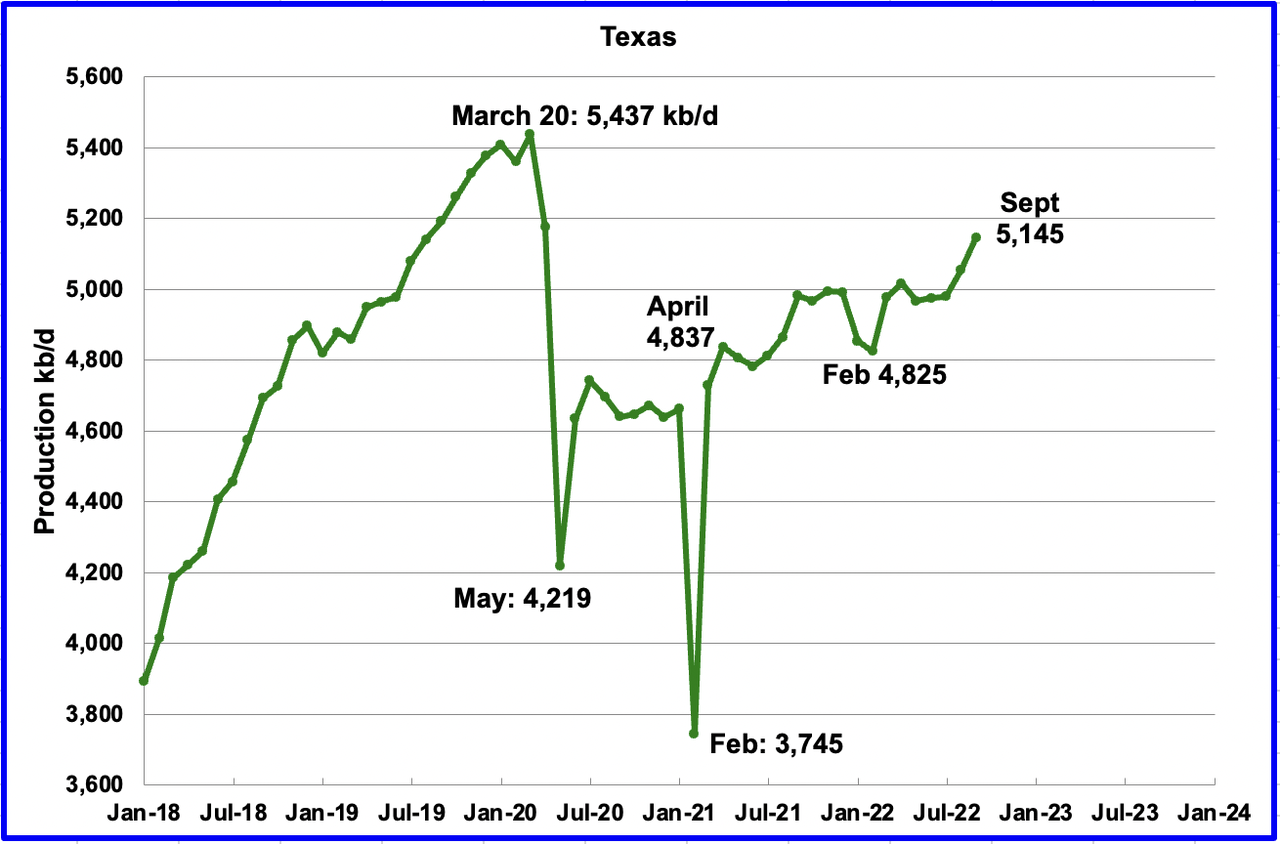
Texas production increased by 90 kb/d in September to 5,145 kb/d, a post-pandemic high. Part of the increase is due to a 41 kb/d downward revision to August output from 5,096 kb/d to 5,055 kb/d.
In September 2021 there were 205 Hz oil rigs operating in Texas. By September 2022, 305 Hz oil rigs were operational, an increase of 100 rigs.
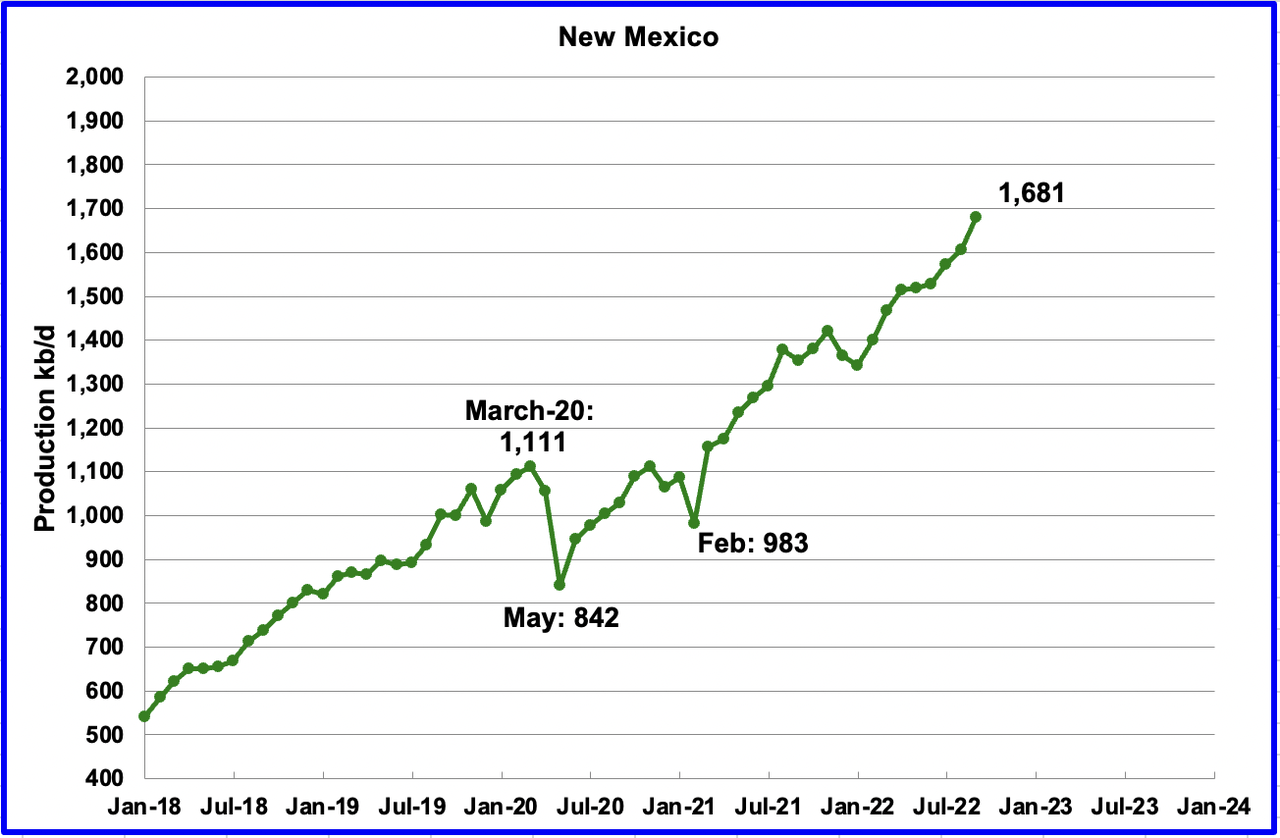
September’s New Mexico production increased by 75 kb/d to 1,681 kb/d to a new record high.
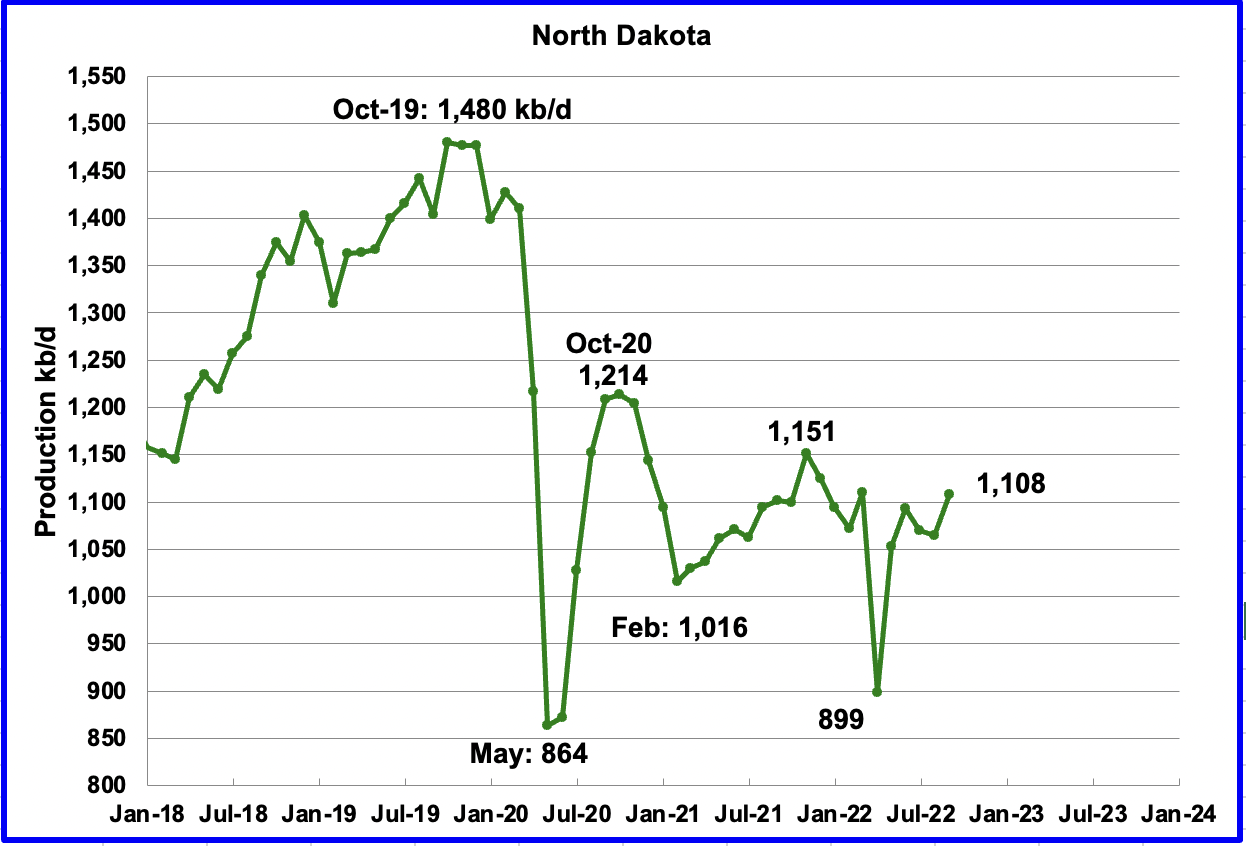
North Dakota’s September output increased to 1,108 kb/d, an increase of 43 kb/d from August and appears to have fully recovered from the severe April storms.
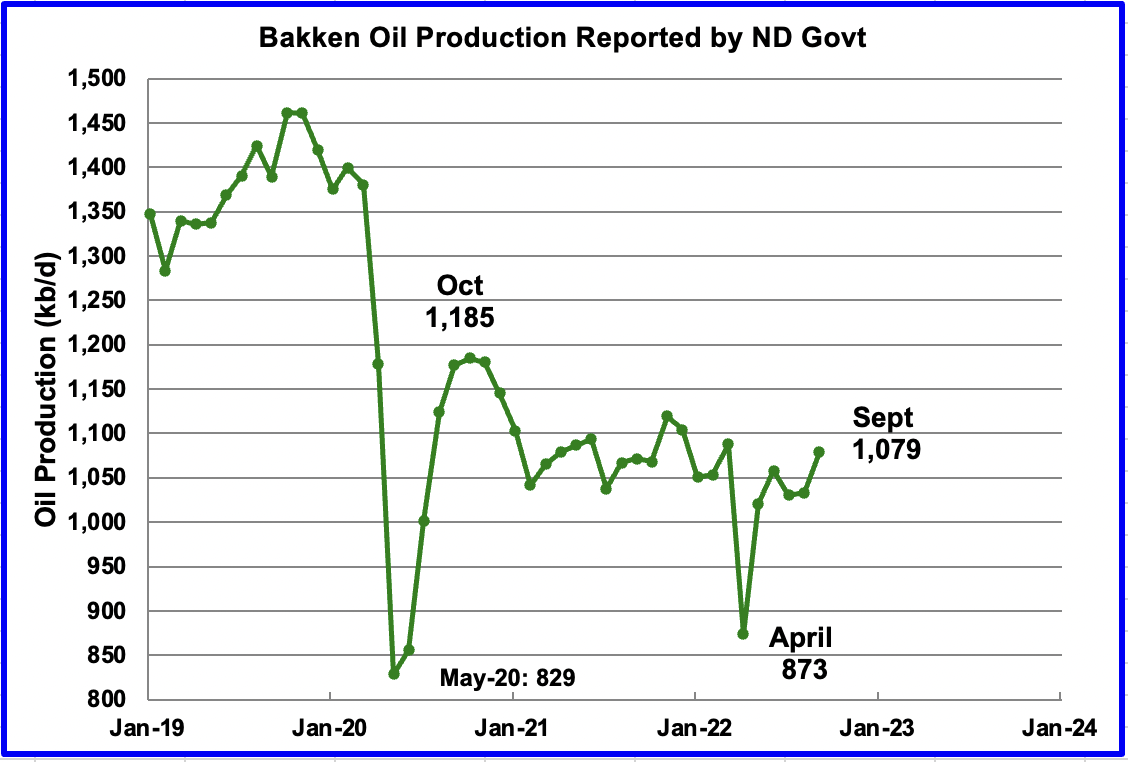
The North Dakota Oil and Gas Division reported September production of 1,079 kb/d, 29 kb/d lower than the EIA’s 1,108 kb/d?
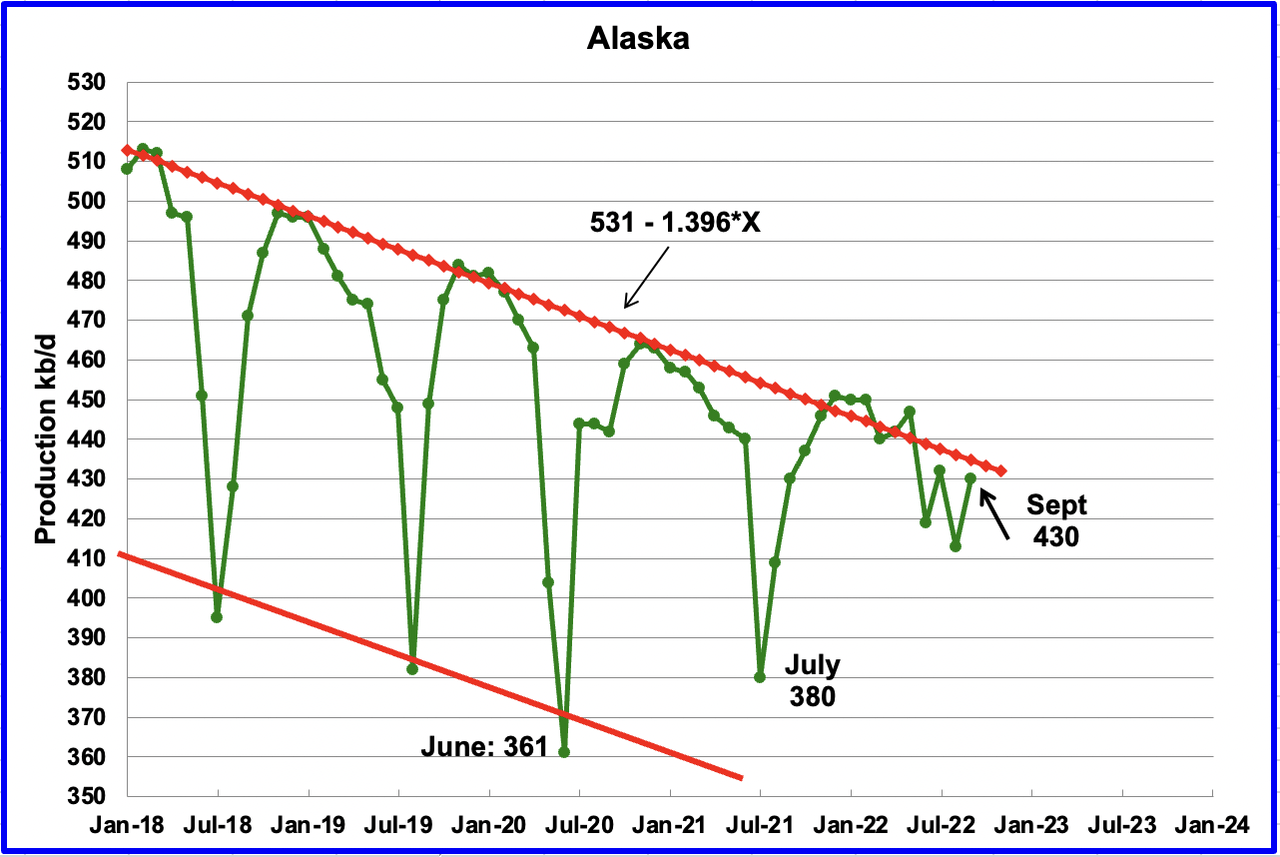
Alaskaʼs September output increased by 17 kb/d to 430 kb/d, the same output as last September.
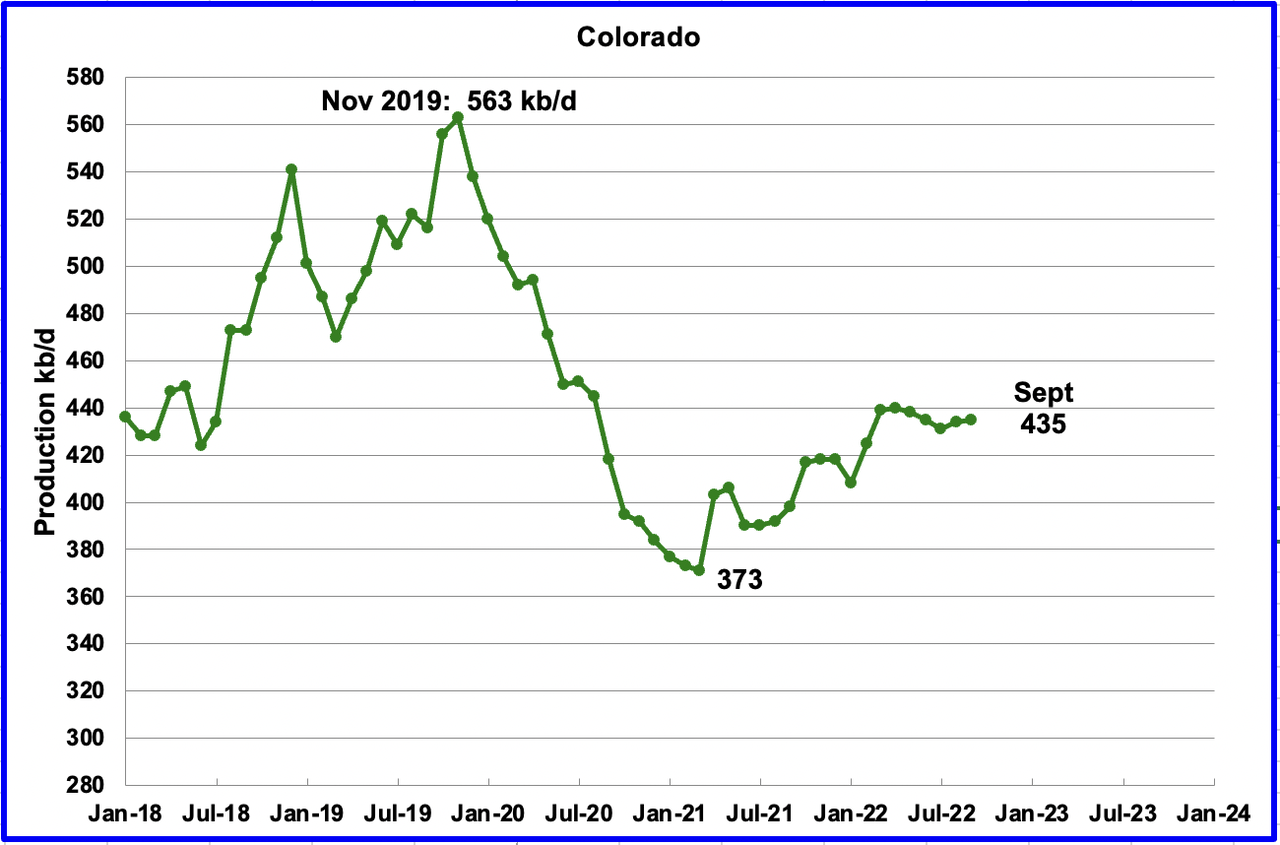
Coloradoʼs September production increased by 1 kb/d to 435 kb/d. A recent Colorado report forecasts little oil growth is likely in Colorado for 2022.
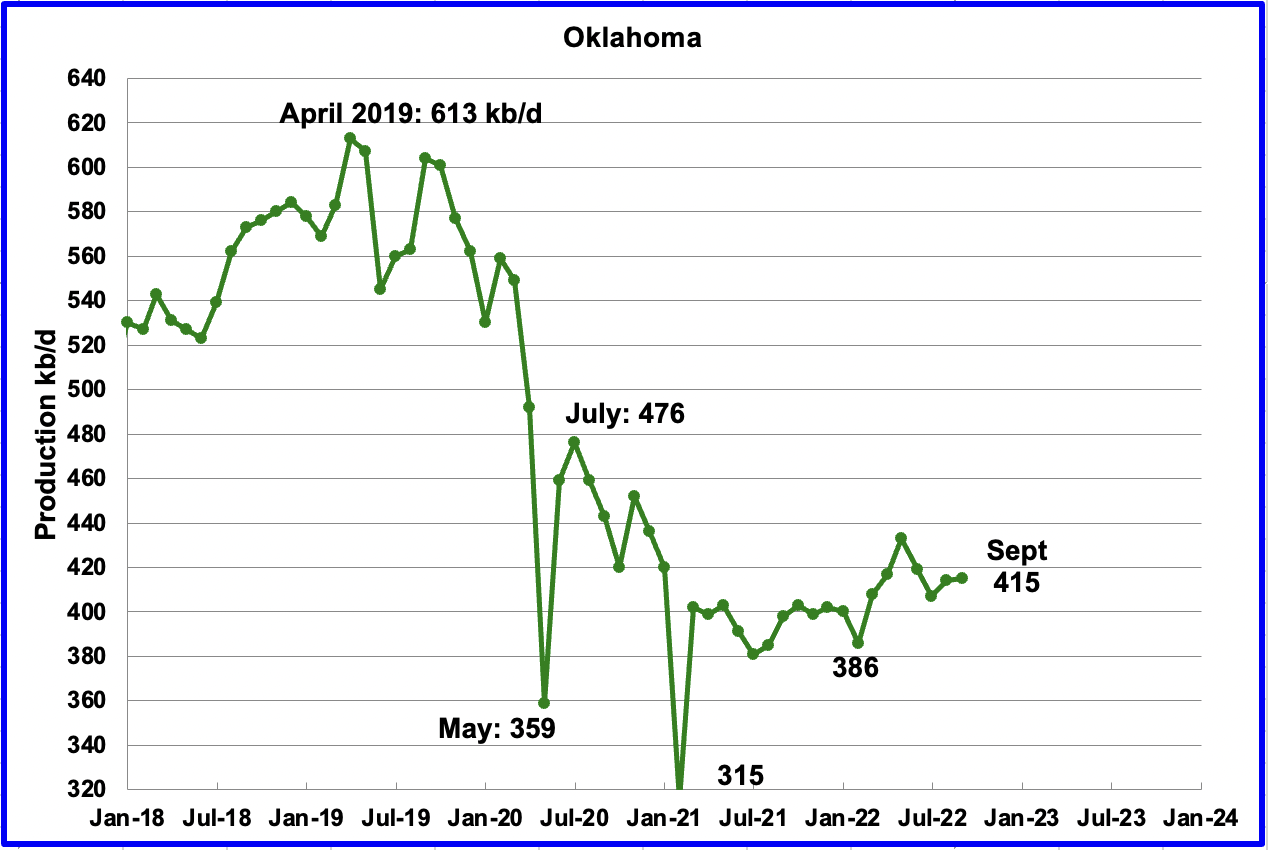
Oklahoma’s output in September increased by 1 kb/d to 415 kb/d. From January to April, close to fifty rigs were operating in Oklahoma. By late September the rig count had increased to 61. Production remains 61 kb/d below the post-pandemic high of 476 kb/d.
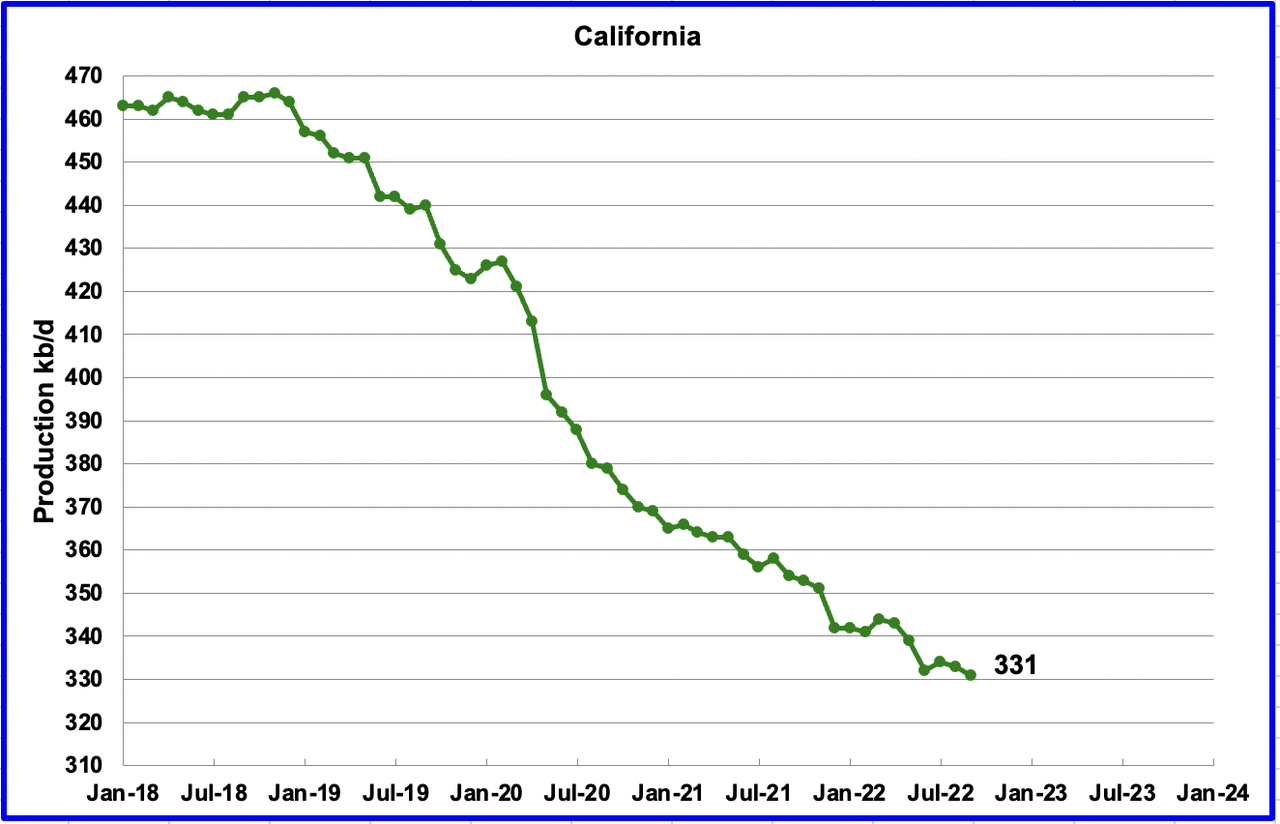
Californiaʼs slow output decline continued in September. Output decreased by 2 kb/d to 331 kb/d.
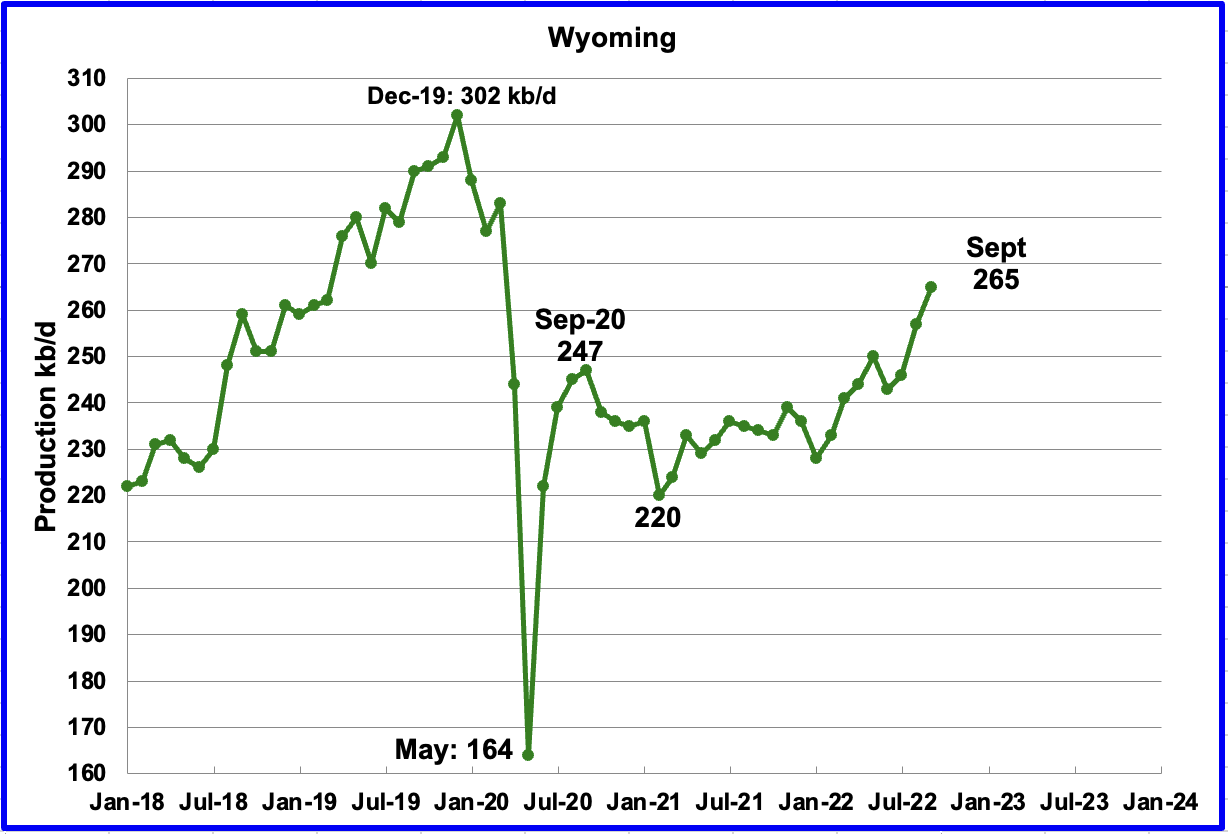
Wyoming’s oil production has been on a slow unsteady uptrend from the low of 220 kb/d in February 2021 due to increased drilling. September’s output reached a new post-pandemic high of 265 kb/d, an increase of 8 kb/d.
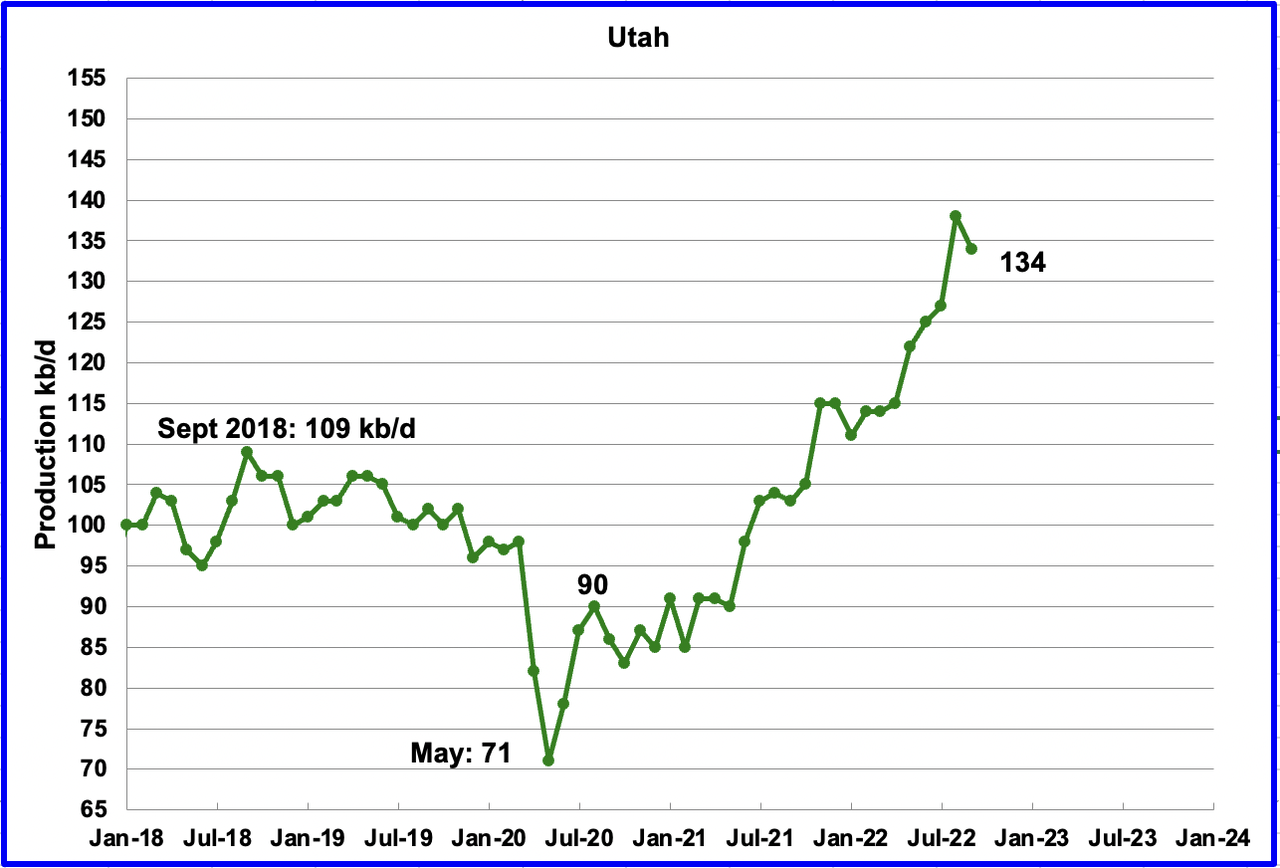
Utah’s oil production had been increasing steadily since January 2022. Production hit a new high in August of 138 kb/d after adding 11 kb/d to July’s output. September saw the first drop in many months. September production dropped by 4 kb/d to 134 kb/d/. Utah had 7 rigs operating in September.
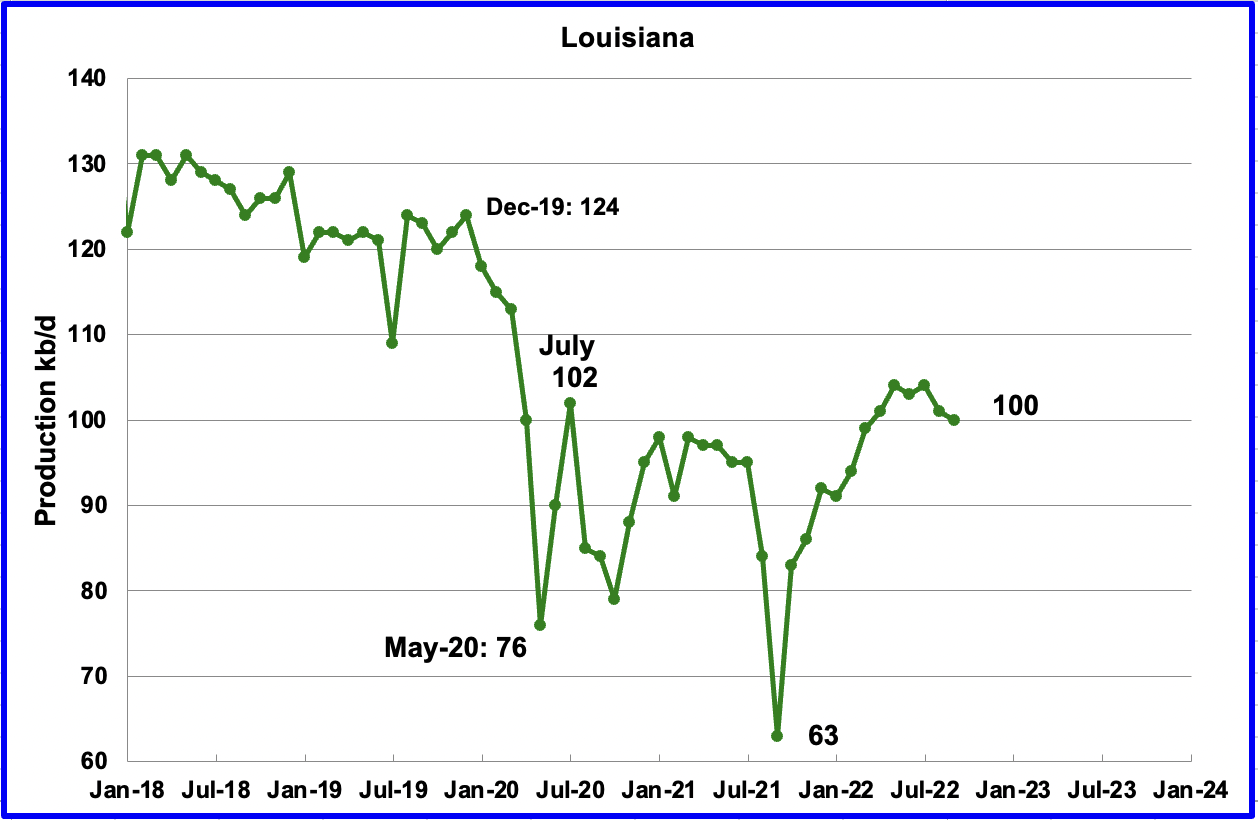
Louisiana’s output appears to be plateauing around the 100 kb/d level. September’s output dropped by 1 kb/d to 100 kb/d.
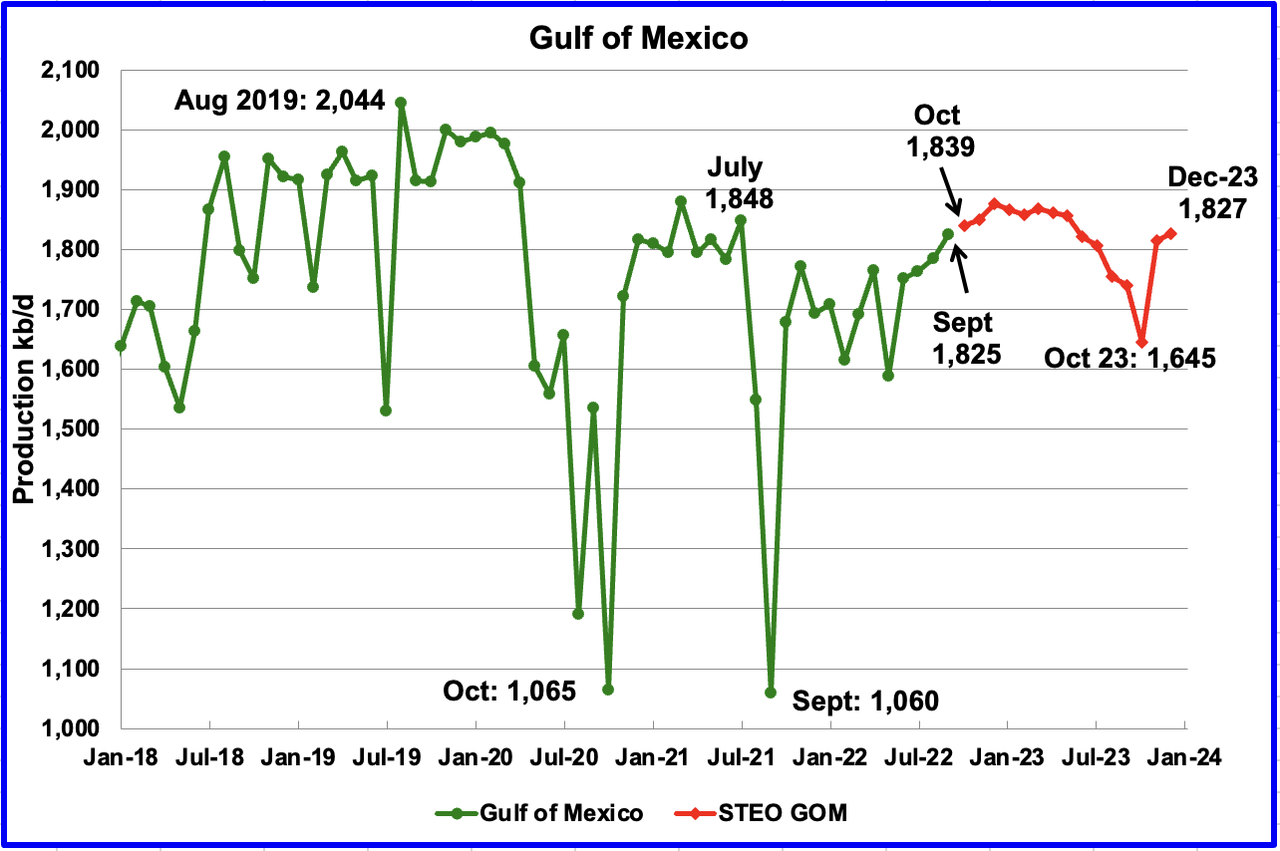
GOM production increased by 64 kb/d in September to 1,825 kb/d. If the GOM was a state, its production would normally rank second behind Texas.
The November 2022 STEO projection for the GOM output has been added to this chart and projects output will be 1,827 kb/d in December 2023, 16 kb/d lower than in the October report.
In the October report, the STEO was projecting October production would to drop to 1,650 kb/d, possibly associated with Hurricane Ian, which hit the GOM in late September. The current November STEO has revised up its October output forecast to 1,839 kb/d.
According to this source, two new oil drilling platforms in the GOM are scheduled to come online in late 2022. “BP Plc’s Argos and Shell Plc’s Vito – floating production platforms that are taller than 20-story buildings and have decks the size of football fields – will start pumping crude off the Louisiana shore later this year.
Vito has been delayed till early 2023 according to this source.
A Different Perspective on US Oil Production
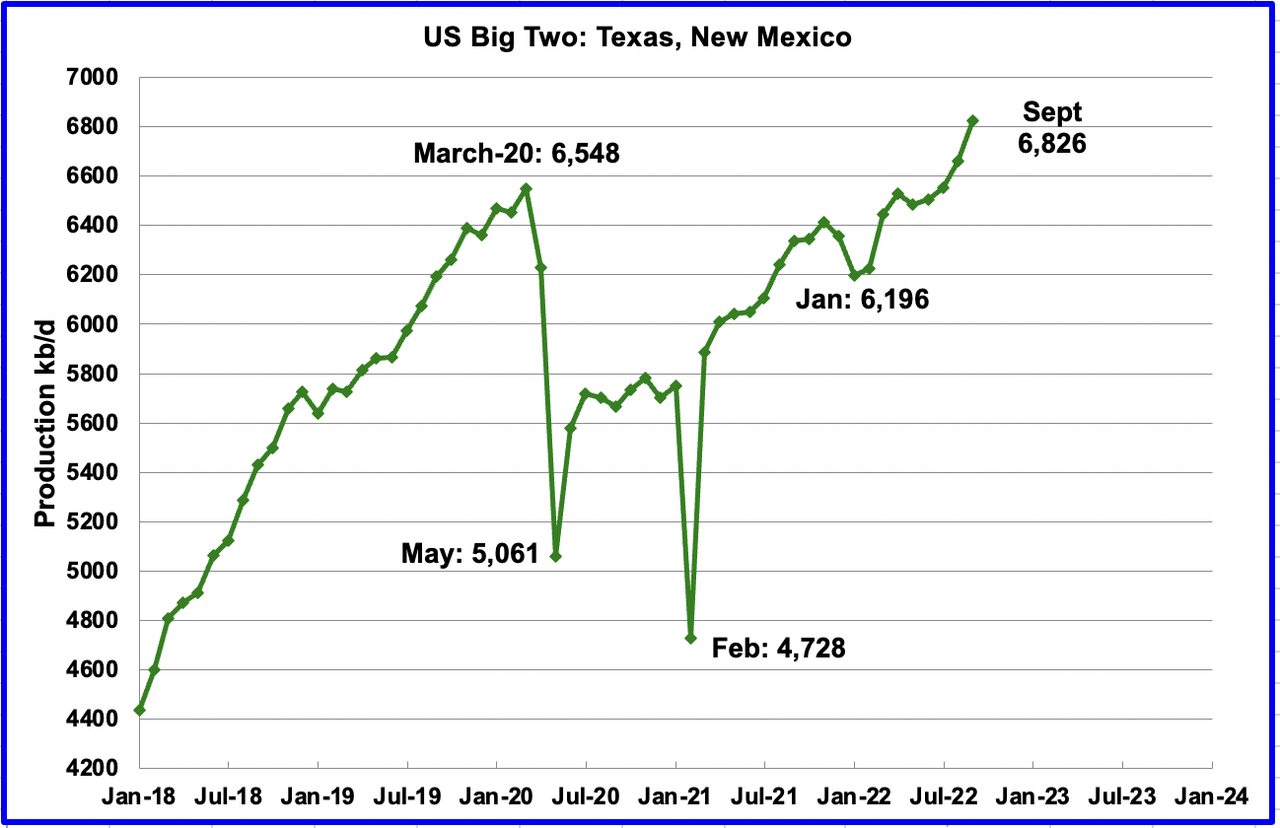
The Big Two states, combined oil output for Texas and New Mexico.
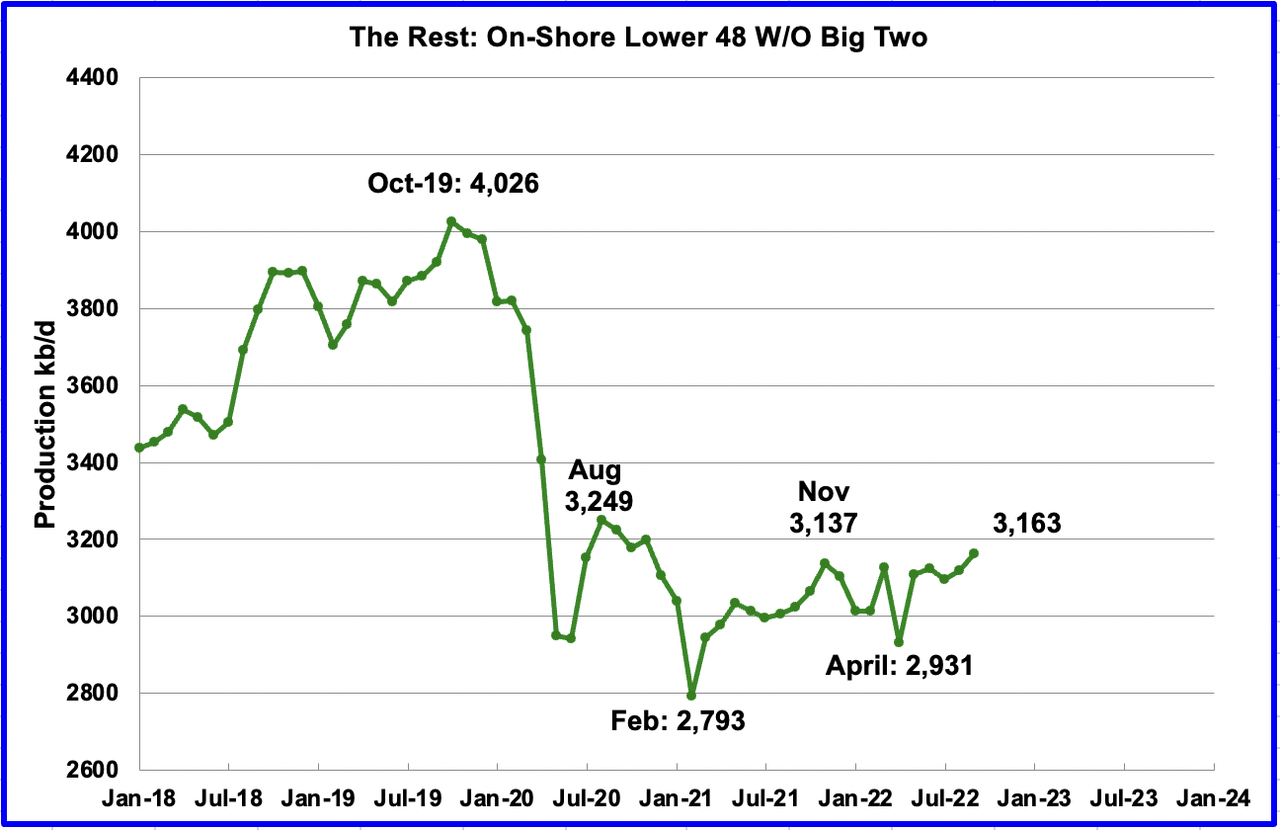
Oil production by The Rest
September’s production in the Big Two states increased by a combined 165 kb/d to a new high of 6,826 kb/d with Texas adding by 75 kb/d and New Mexico 90 kb/d. In September, The Rest increased output by 43 kb/d to 3,163 kb/d, most of which came from North Dakota.
The main thing to notice in the Rest Chart is that current production is 900 kb/d below the high of October 2019. The question we need answered is “Is this a permeant loss that will never be recovered?
Rigs and Fracs
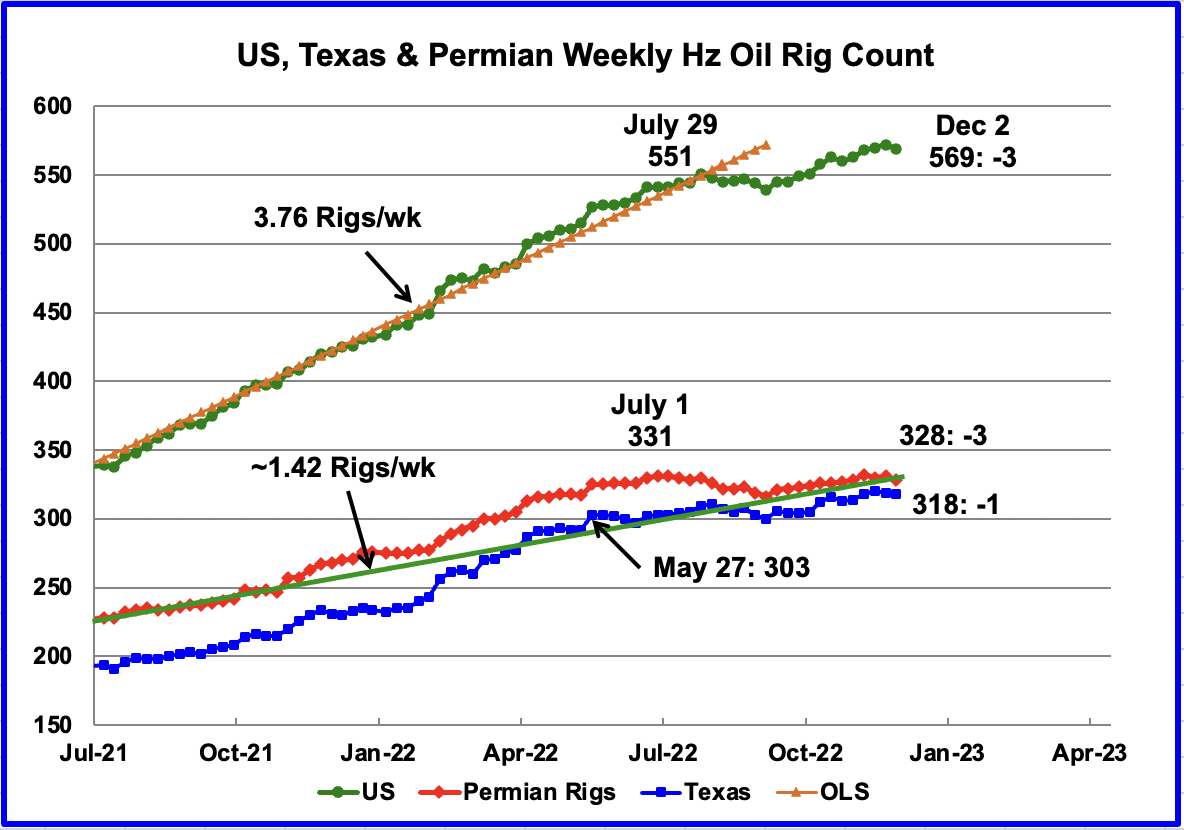
Since the beginning of April 2021 through to the week ending July 29, 2022, the US has been adding horizontal oil rigs at a rate of close to 3.82 rigs/wk, orange OLS line, and peaked at 551 rigs in the week ending July 29. However, since then, the number of operational rigs has wondered sideways. In the week ending December 2, the number of rigs decreased by 3 to 568.
In the Permian and Texas, the general trend for the number of operational rigs since July has been flat. In the week ending December 2, the Permian was down 3 rigs and Texas was down 1.
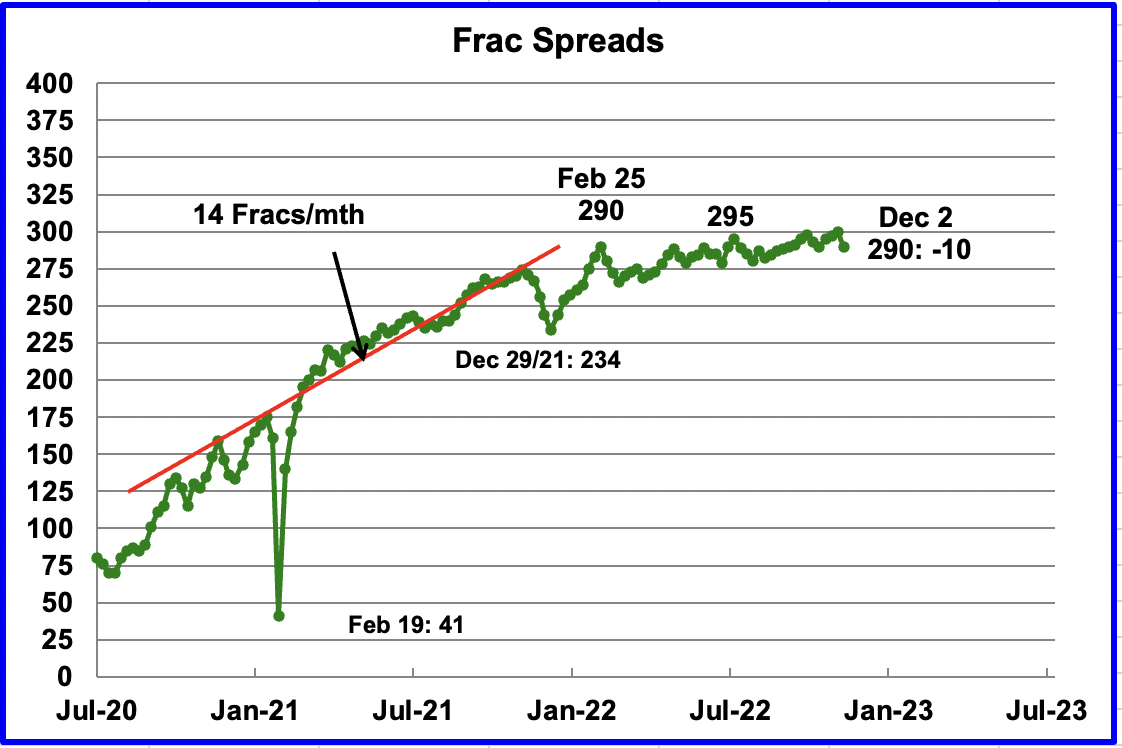
For frac spreads, the general trend since late February can best be described as essentially flat around the 290 level but with a hint of a slow increase toward 300 frac spreads. However, for the week ending December 2, the count dropped by 10. This is the beginning of a drop down into the 270 area as this is the slowdown associated with Thanksgiving and Christmas. A similar trend occurred last year.
Note that these 290 frac spreads include both gas and oil spreads.
Drilling Productivity Report
The Drilling Productivity Report (DPR) uses recent data on the total number of drilling rigs in operation along with estimates of drilling productivity and estimated changes in production from existing oil wells to provide estimated changes in oil production for the principal tight oil regions. The November DPR forecasts production to December 2022 and the following charts are updated to December 2022.
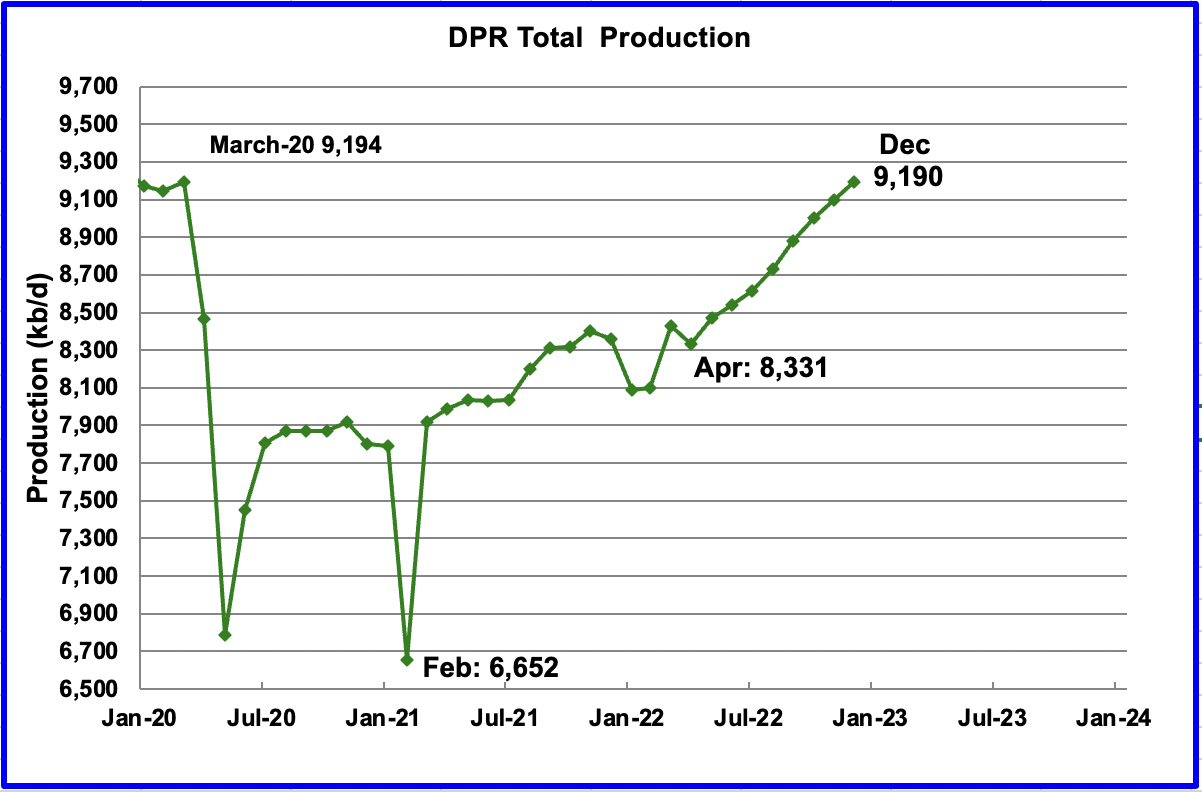
Above is the total oil production projected for December 2022 for the 7 DPR basins that the EIA tracks. Note that DPR production includes both LTO oil and oil from conventional wells.
The November DPR report made minimal revisions to the October report. The DPR is projecting that oil output for December 2022 will increase by 90 kb/d to 9,190 kb/d. From April’s output of 8,331 kb/d to December’s 2022, output in the DPR basins is forecast to increase by 859 kb/d or by an average rate of 107.4 kb/d/mth.
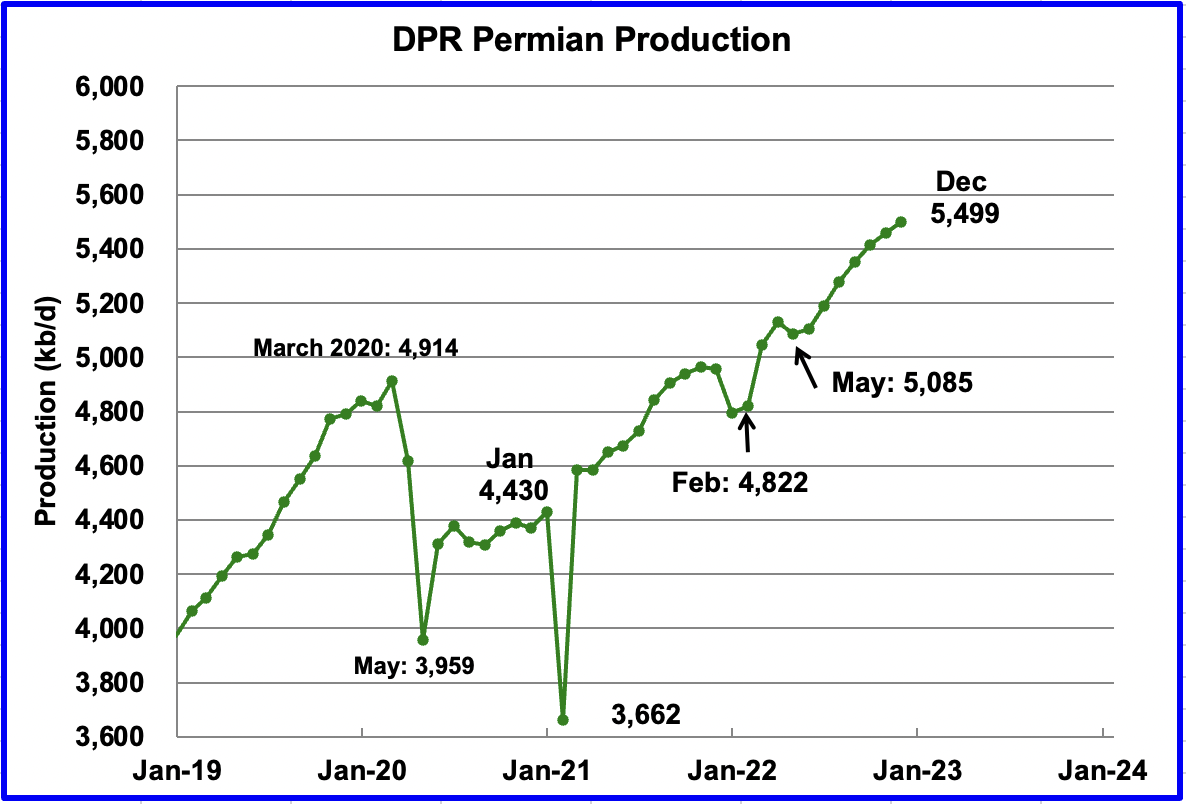
Permian output continues to increase in December. Production is expected to increase by 39 kb/d to a new high of 5,499 kb/d. From May to November, production is forecast to increase by 414 kb/d or at an average rate of 59.1 kb/d/mth.
If the Permian were part of OPEC, at 5,499 kb/d, it would be the second largest producer after Saudi Arabia.
Looking at the output from May to December, there is a hint that the monthly increase in production in the Permian may be slowing. In August, output increased by 87 kb/d. The December increase is less than half of that at 39 kb/d. More charts below hint at production growth slowing in the Permian.
During October, 421 wells were drilled and 434 were completed in the Permian. (Note that October is the latest month for DUC information). The completed wells added 373 kb/d to October’s output for an average of 860 b/d/well. The overall decline was 311 kb/d which resulted in a net increase for Permian output of 62 kb/d. Of the 434 completed wells, 362 were required to offset the decline. The completion of 13 extra DUCs over the drilled wells contributed 11.2 kb/d of the overall 62 kb/d increase.
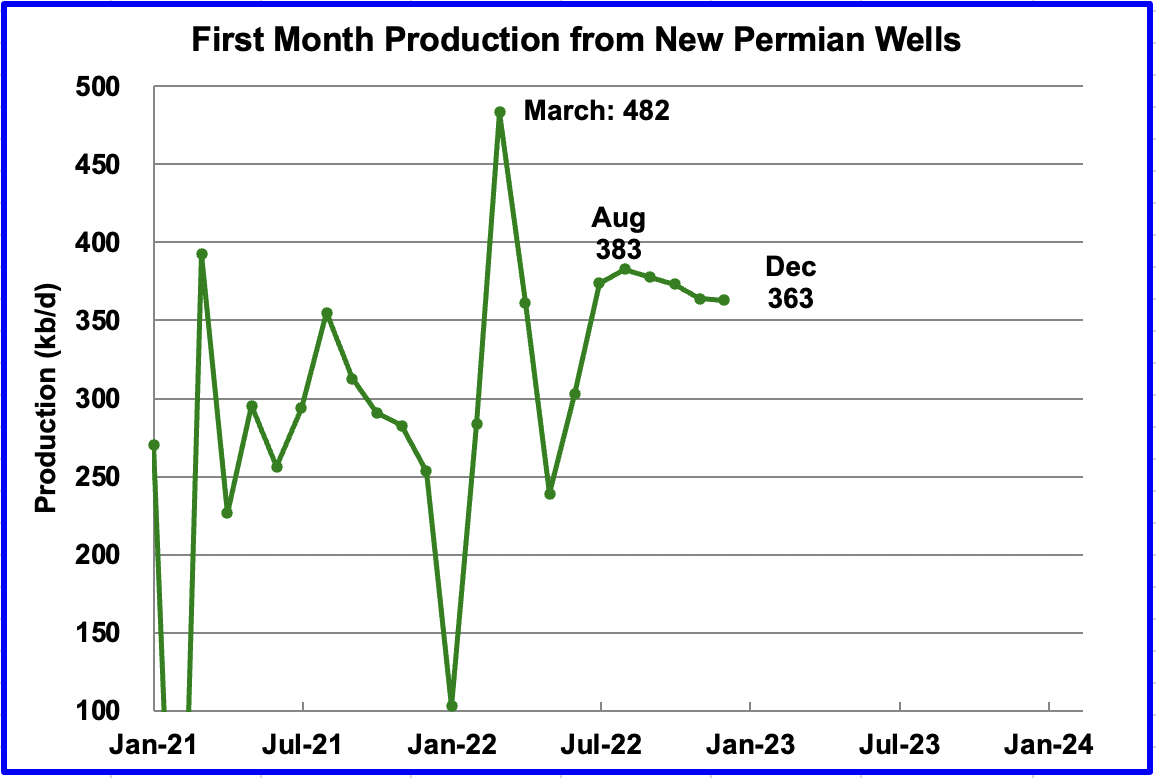
This chart shows the average first month total production from Permian wells tracked on a monthly basis. Since July 2022, the volatility shown in prior months has stopped. The reduced volatility may be related to the first upgraded LTO report released in September. Assuming the latest information is correct, total monthly production from the newest Permian wells may have peaked at 383 kb/d in August. Part of the decline shown is related to fewer wells being completed.
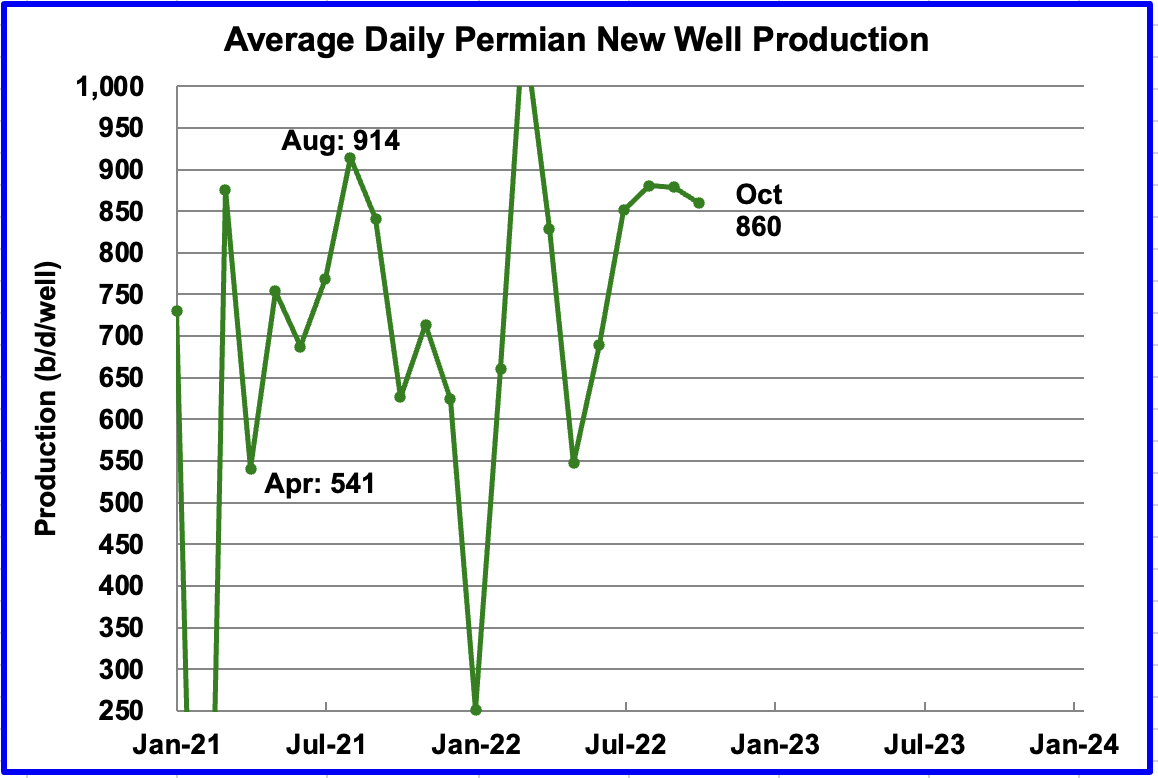
Average daily production for first month Permian wells also shows reduced volatility and indicates average production is 860 b/d in October and could be stabilizing in the 850 kb/d range. Note that October is the latest month for reported completion data.
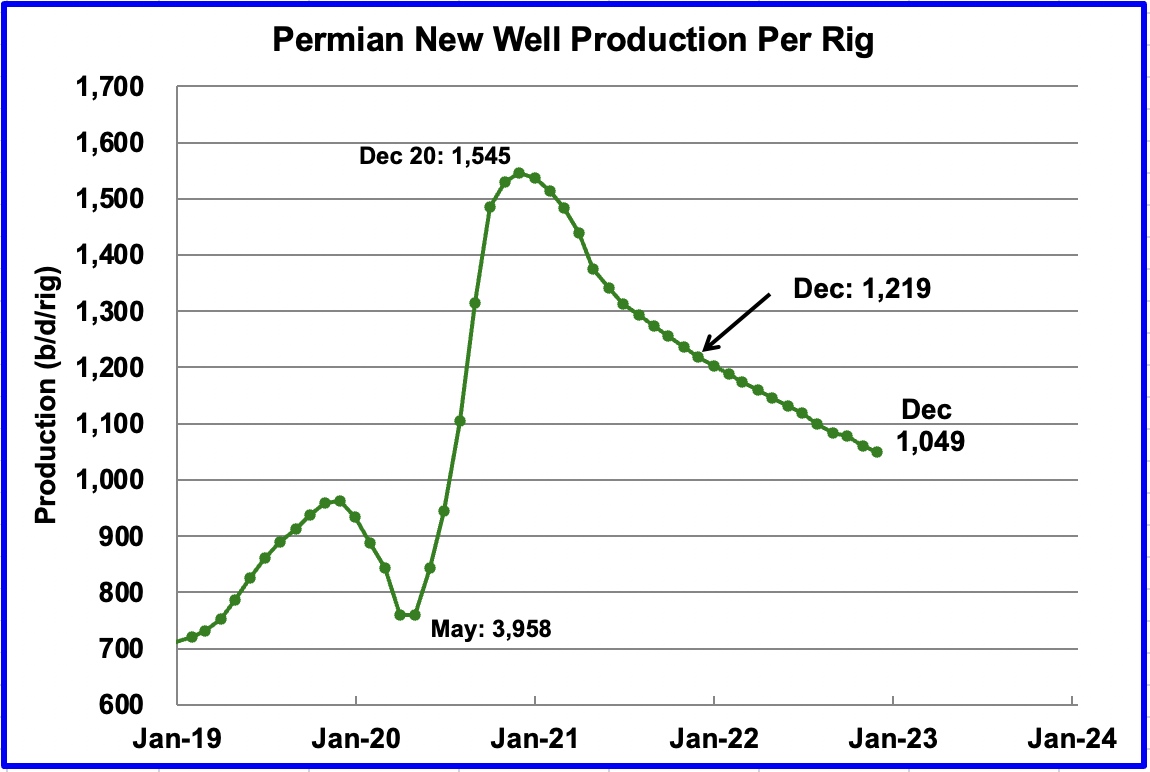
This chart shows that the productivity of Permian rigs has been decreasing since December 2020. In December 2020, at peak productivity, there were 170 rigs in operation. (See next chart) By October 2022, the rig count has doubled to 346 and the productivity had dropped by 30%.
Is this another indication that rigs are moving from Tier 1 areas to lower productivity Tier 2 areas? Since the average new well production shown in the previous chart has stayed close to 860 kb/d, this may also indicate a good blend of Tier 1 and Tier 2 wells are being used. It will be interesting to see if the downward trend of the last 12 months continues. Over this period, rig productivity has dropped by 170 b/d or at an average of 14.2 b/d/mth.
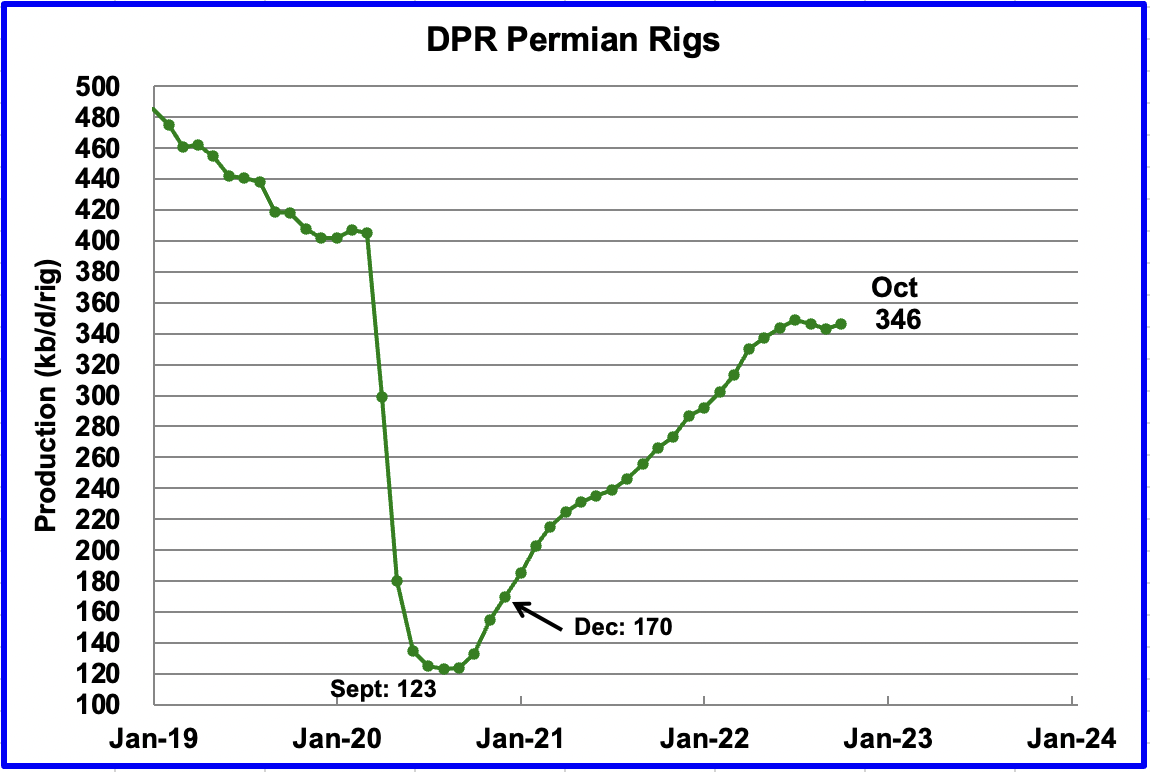
Permian rigs doubled from December 2020 to October 2022 while rig productivity dropped.
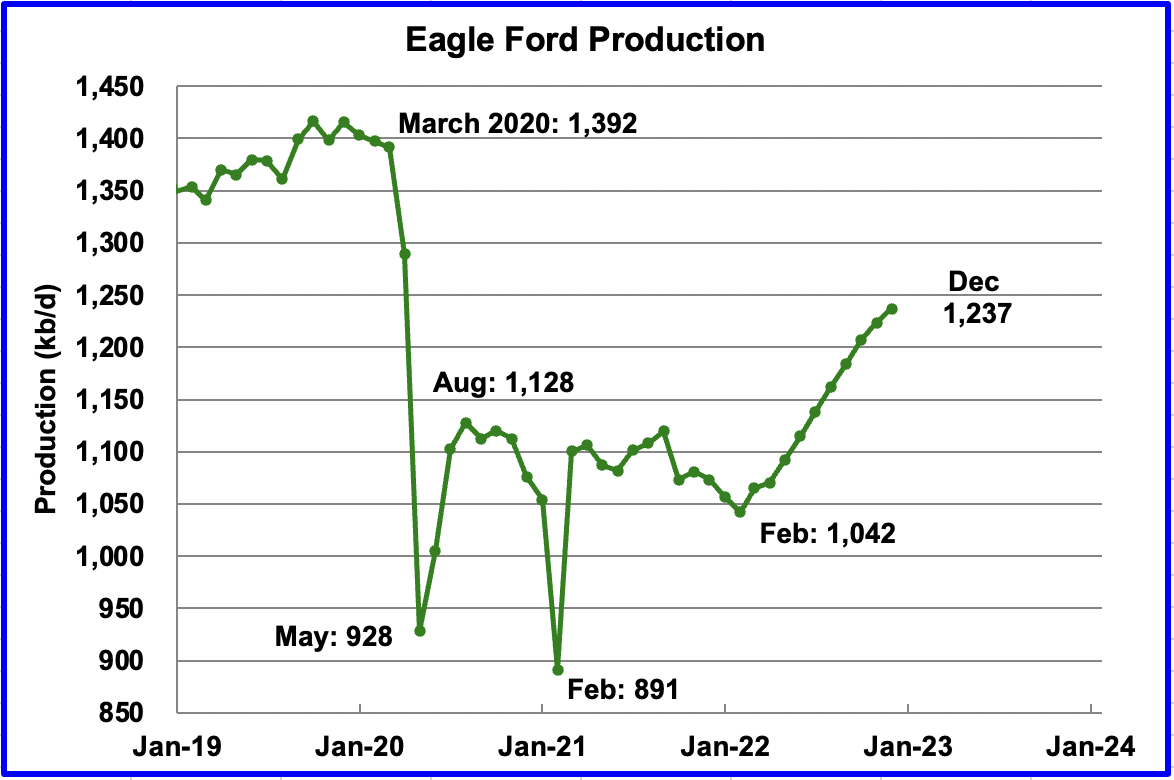
Output in the Eagle Ford basin has been showing an increasing trend since March 2022. For December, output is expected to increase by 14 kb/d to 1,237 kb/d. At the beginning of the year, 43 rigs were operating in the EF. As of November, 66 are operational and account for the increasing production.
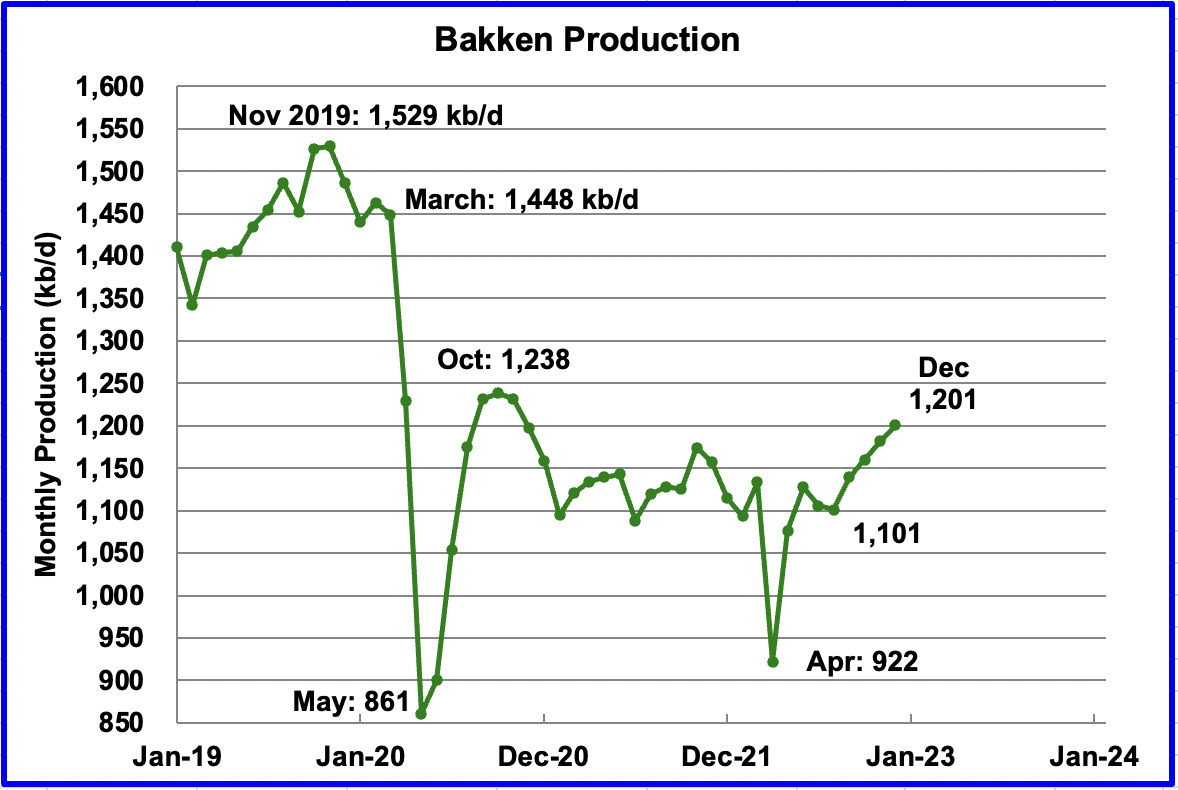
The DPR forecasts Bakken output in December to be 1,201 kb/d an increase of 19 kb/d over November.

This chart shows the Bakken’s output as reported by the North Dakota Oil and Gas Division. September production increased by 46 kb/d to 1,079 kb/d. The DPR Bakken chart above shows September production to be 1,140 kb/d, 61 kb/d higher due to part of the Permian basin located in Montana. The trends in the two charts up to September are essentially the same.
In the November DPR report, it was stated that production would increase in September. The projection for increased production was due to this source indicating a steady stream of completed wells would increase production in September. The source’s forecast was correct.
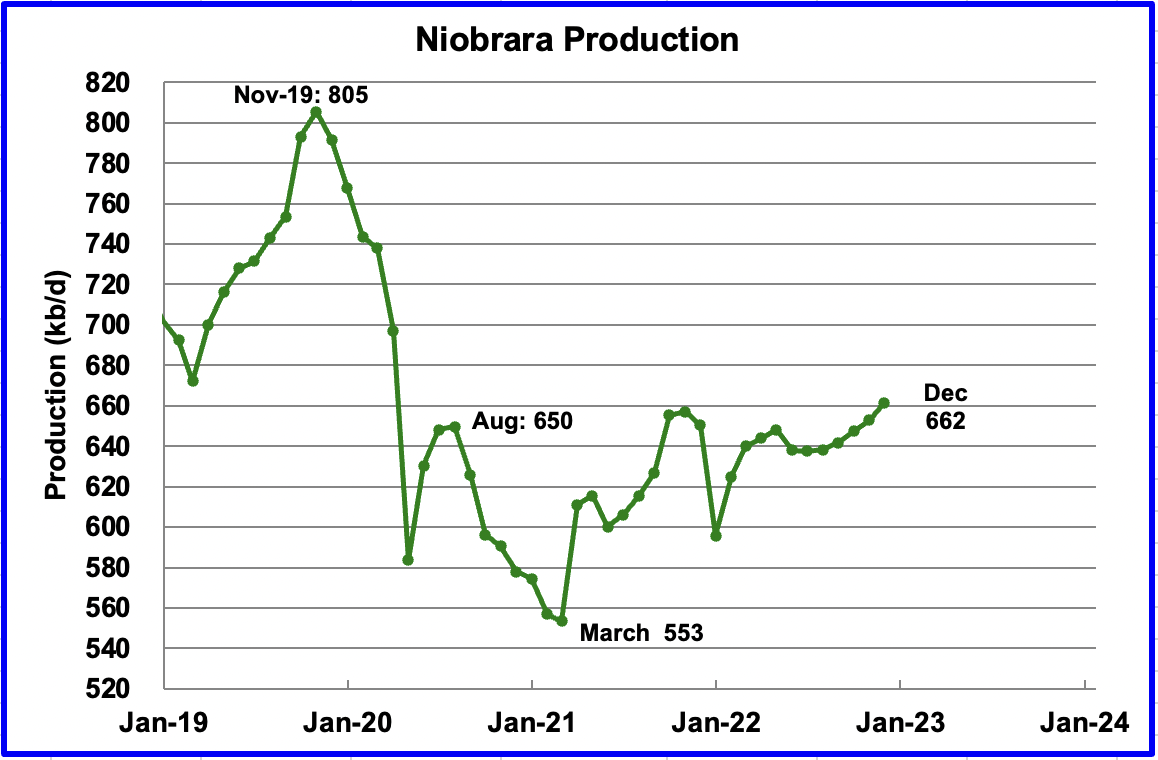
Output in the Niobrara continues to increase slowly. December output increased by 9 kb/d to 662 kb/d and set a post-pandemic high. The Niobrara had 12 rigs operating in January. By November, the count had increase to 19. In January, 95 wells were completed. By October monthly completions increased to 112, which accounts for the increasing production.
DUCs and Drilled Wells
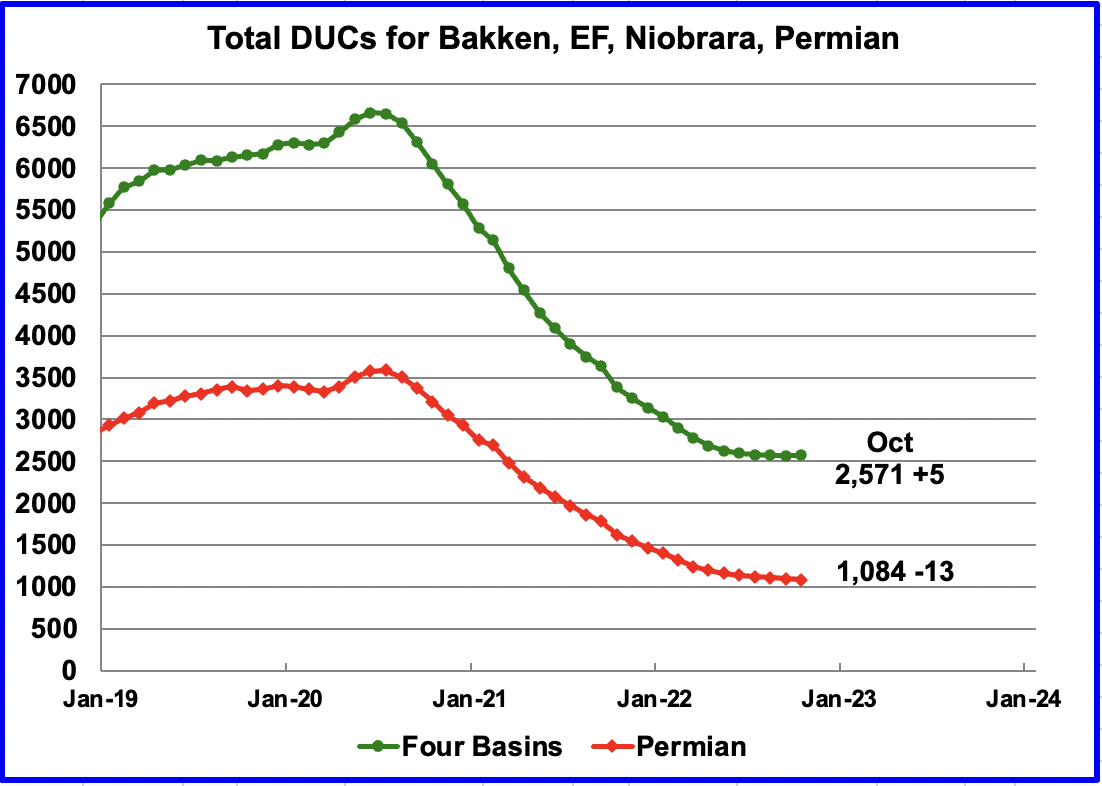
The number of DUCs available for completion in the Permian and the four major DPR oil basins has continued to fall every month since July 2020. Prior to July 2020 more wells were drilled than were completed. However, in October, the trend for total DUCs changed and increased by five.
In the Permian, the change in the monthly completion rate for DUCs has been essentially unchanged for the last three months at 13. In October, the number of remaining DUCs fell by 13 to 1,084. However, in the Niobrara, 133 wells were drilled and 112 were completed for a net increase of 21 DUCs to 414.

In the Permian, the monthly completion rate has been showing signs of slowing since the recent March peak of 450. This is consistent with the frac spread chart shown above where there has been little to no growth in frac spreads since February.
In October 434 wells were completed, 4 more than in September and 16 fewer than in March. During October, 421 new wells were drilled, an increase of 5 over September. The gap between drilled and completed wells in the Permian has remained essentially the same for the last three months at 13.
November Light Tight Oil Update
The EIA’s LTO database provides information on LTO production from seven tight oil basins and a few smaller ones. The November 2022 report updates tight oil production to October 2022.
This is the Third LTO report published after it was updated because of operational issues. While the first report revised production down, a bit much it appears, the second and third reports have revised production up.
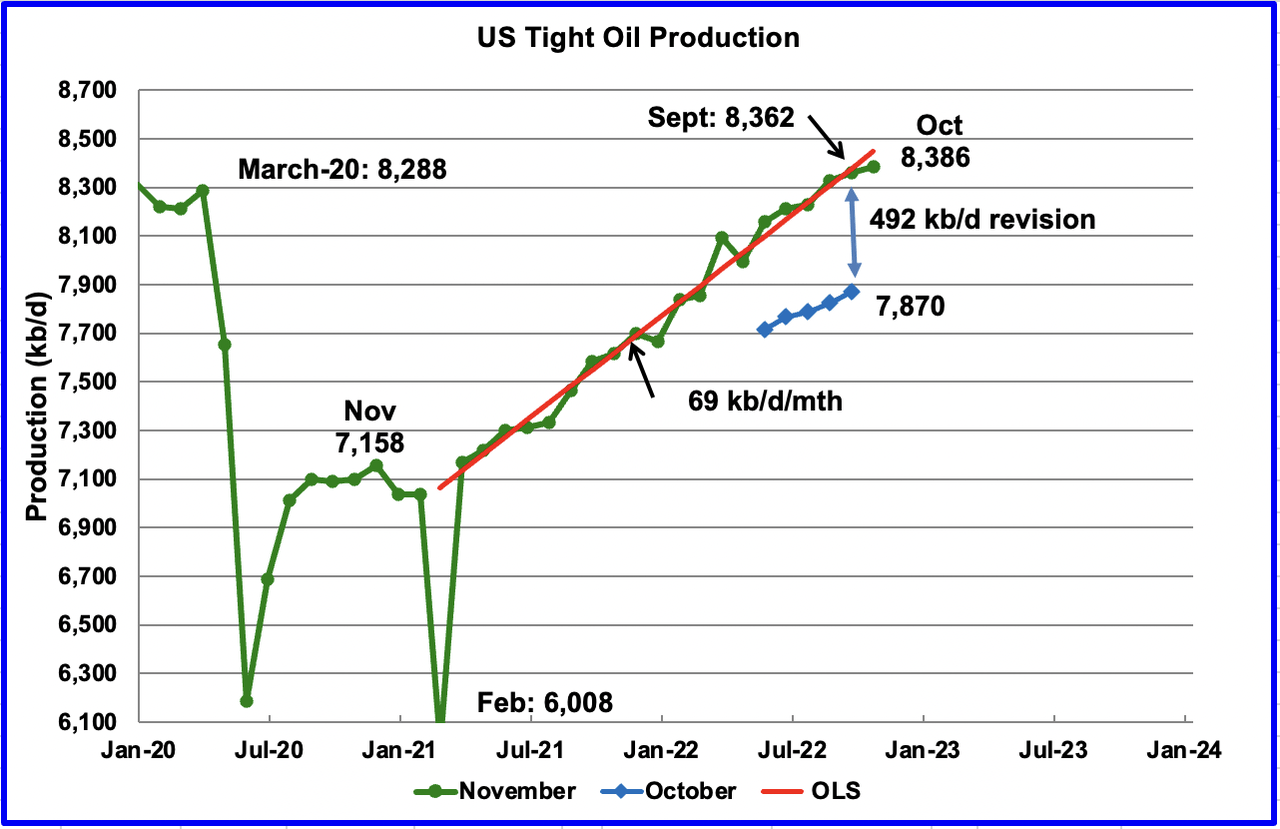
October’s LTO output increased by 24 kb/d to 8,386 kb/d.
This latest November report made a significant upward revision to its projected output. For instance, September production in the October report has been increased from 7,870 kb/d to 8,362 kb/d, an increase of 492 kb/d. Due to the large revision, an inquiry has been sent to the EIA requesting a review of the published LTO data. At this time, the EIA has indicated they are reviewing the data.
The red OLS line from March 2021 to October 2023 indicates a monthly production increase of 69 kb/d/mth, double the rate reported in October.
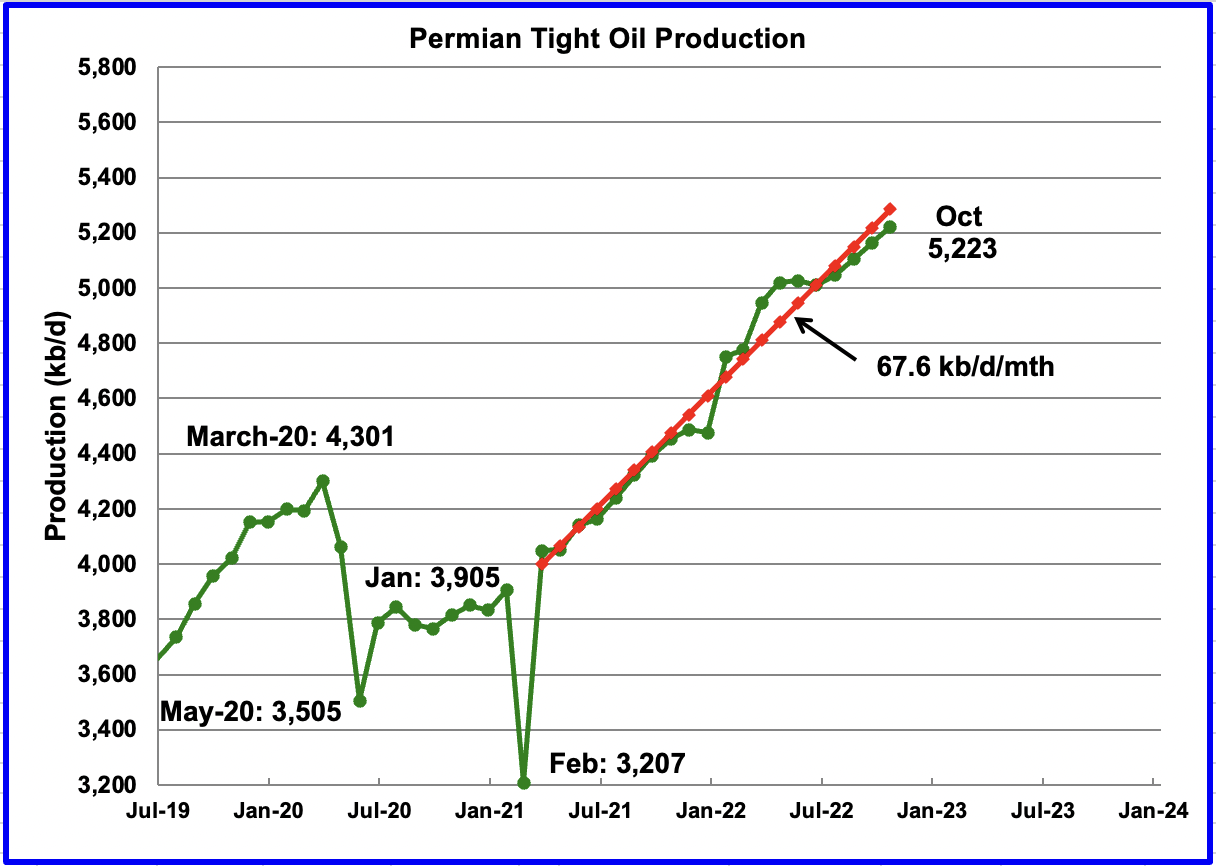
October’s output increased by 60 kb/d to 5,223 kb/d and is 922 kb/d higher than the high of 4,301 kb/d recorded in March 2020. Interestingly, the Permian’s rate of production increase is essentially the same as the total for the LTO basin.
According to this source, the Permian may have seen its best days. For Top U.S. Oil Producers, Permian Shale Output Is Losing Steam.
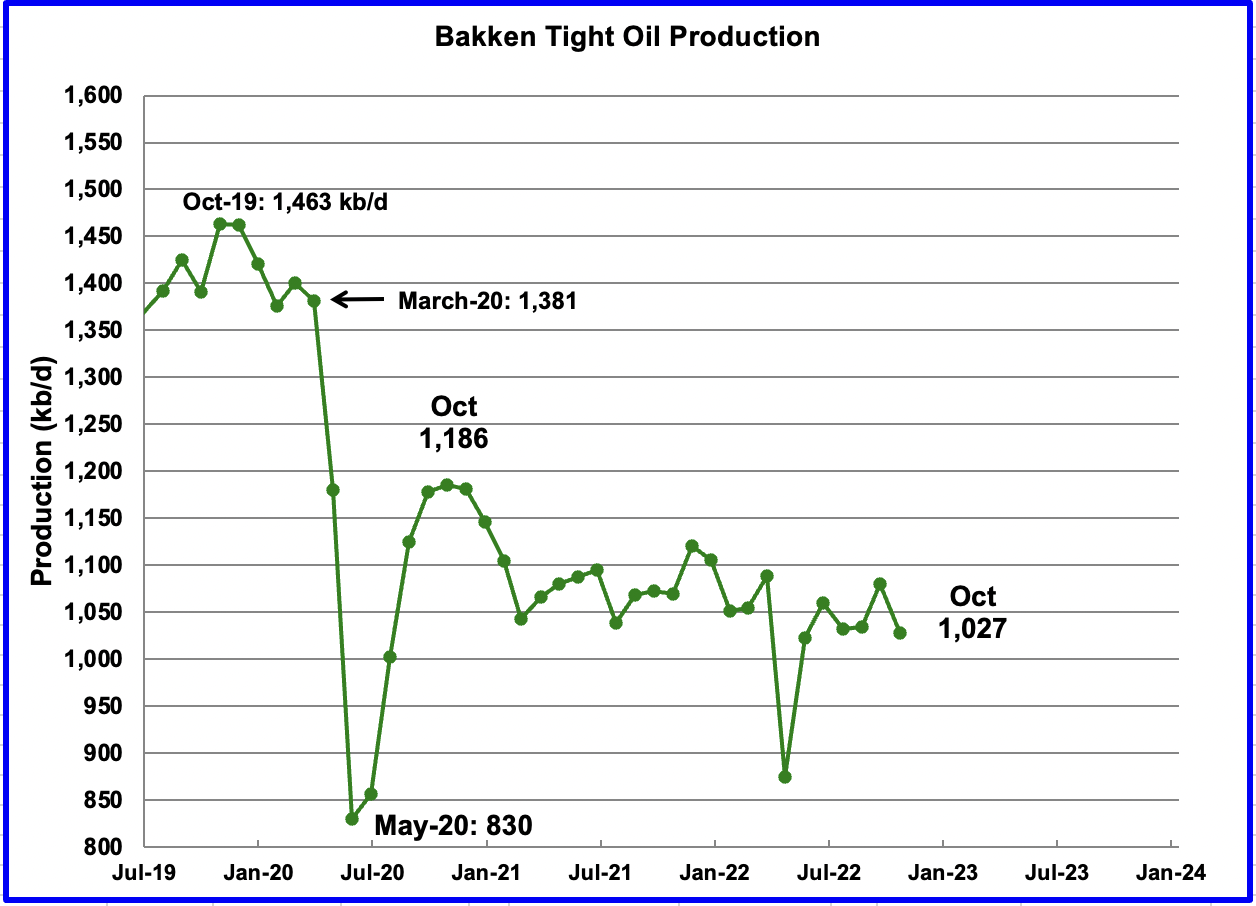
The Bakken’s October LTO output decreased by 53 kb/d to 1,027 kb/d. Note in the DPR Bakken report, October production increased by 20 kb/d and increased steadily from August to December.
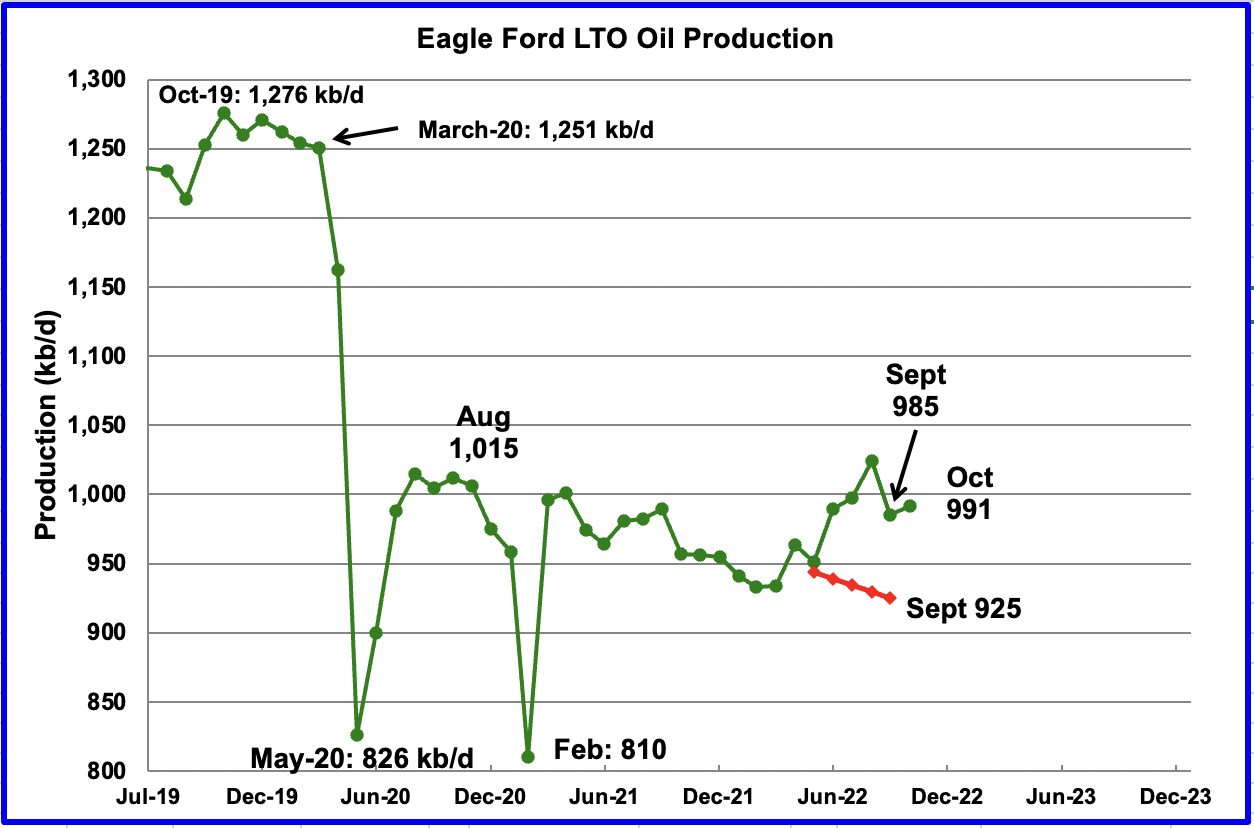
Production in the Eagle Ford basin increased by 6 kb/d in October to 991 kb/d.
As can be seen there has been a significant change in the EF production data in going from the October report to the November report. The November report has revised up all of the production data from June to September. September production has been revised up by 60 kb/d. More significantly, the updated data indicates that the EF basin is not in decline as the previous data indicated.
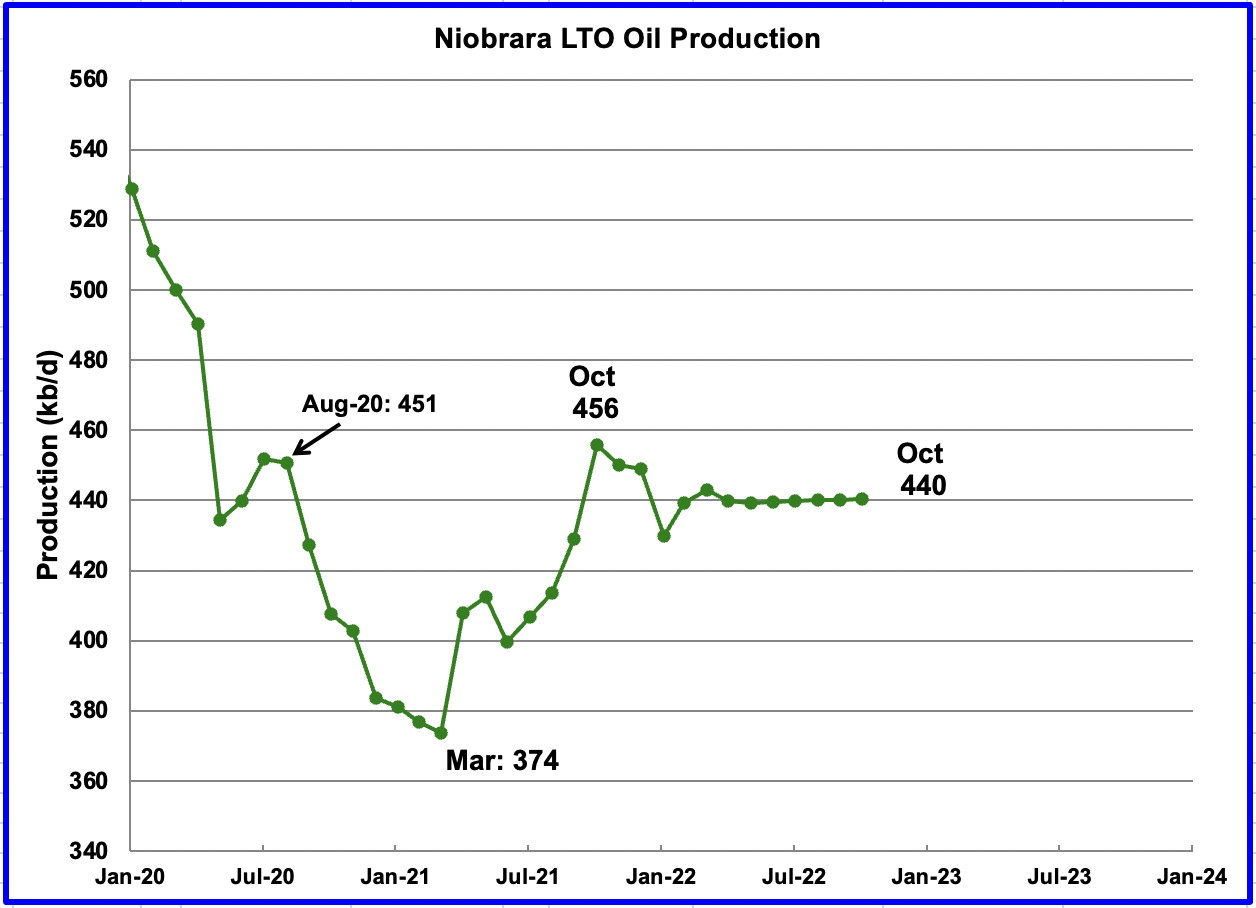
After increasing production from March 2021 to October 2021, output in the Niobrara began to drop in November 2021. Production since April has shown little growth. October’s output was unchanged at 440 kb/d and has been flat for the past seven months..
Onshore L48 Conventional Production
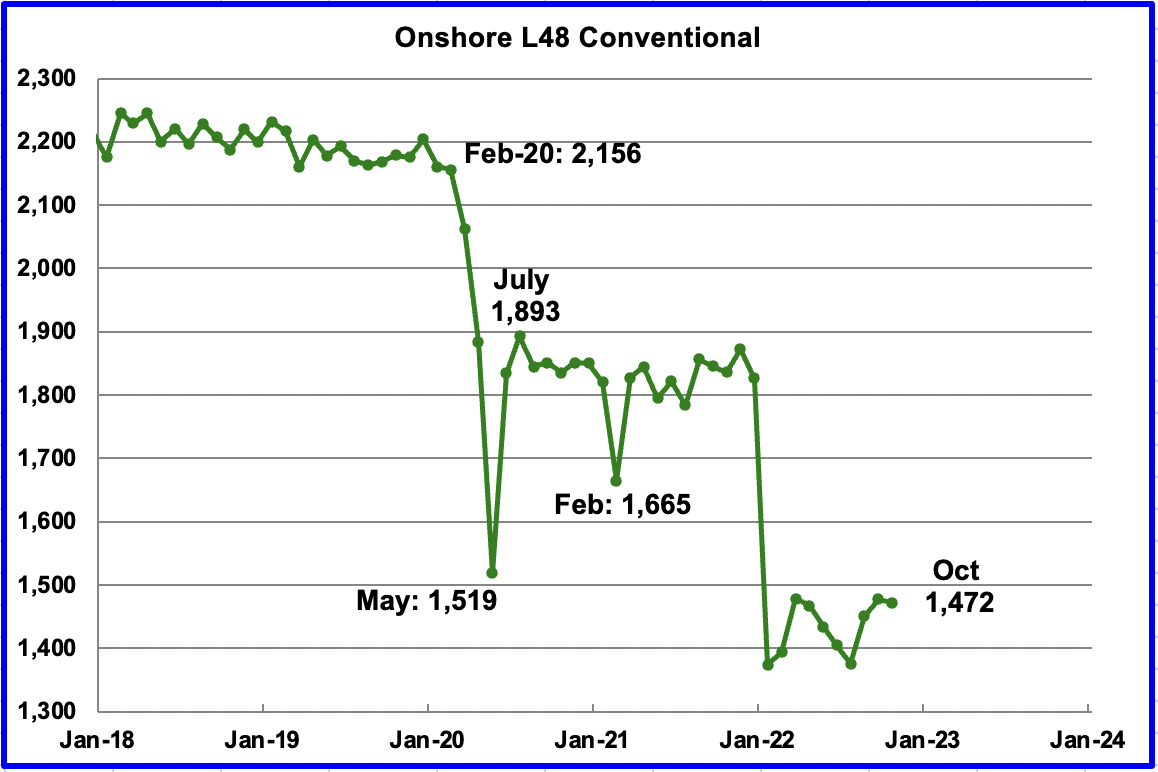
Conventional oil output in the Onshore L48 dropped by 6 kb/d in October to 1,472 kb/d. This estimate is based on a combination of the expected October LTO output and the November 2022 STEO report that has an October 2022 forecast for the US Onshore L48 output.
The big production drop in conventional crude in January is due to the massive upward revision to LTO production shown in the first chart of this section. We will have to wait for the next LTO report to see whether these November figures are revised.
Production Decline
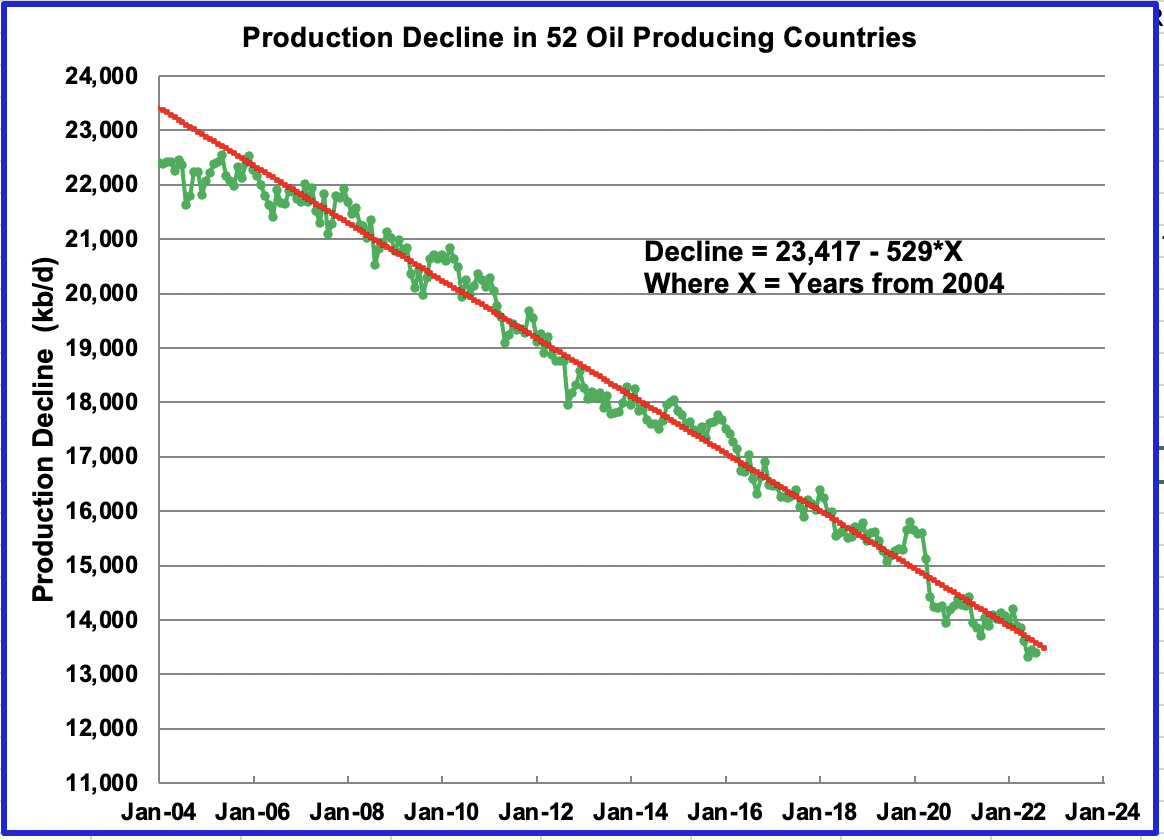
This chart shows the production decline in 52 small countries where many don’t reinvest much capital to maintain production. The annual decline rate over the period November 2005 to August 2022 is 529 kb/d/yr.
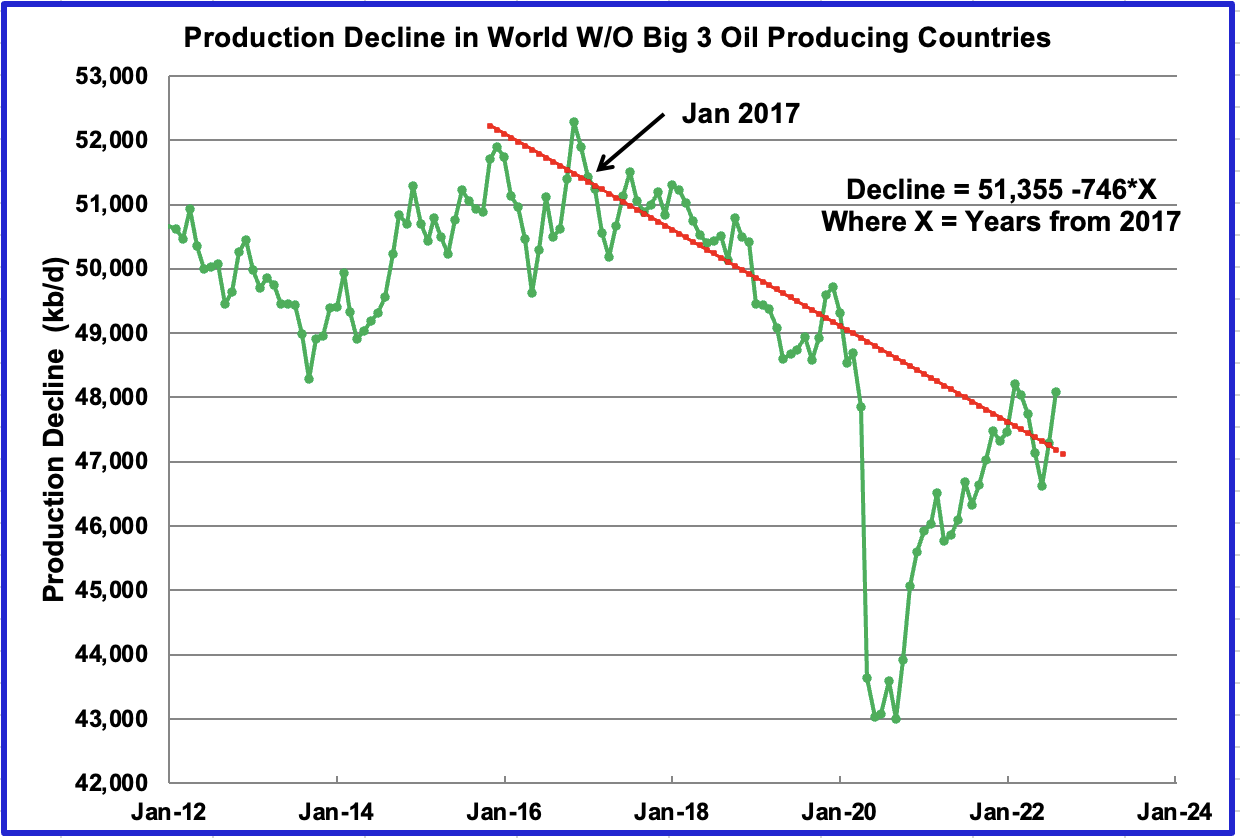
This chart shows the production decline in the world without the Big 3, US, Russia and Saudi Arabia over the period January 2017 to August 2022. February 2020 to September 2021 was left out of the analysis for the OLS line. The annual decline rate is 746 kb/d/yr.
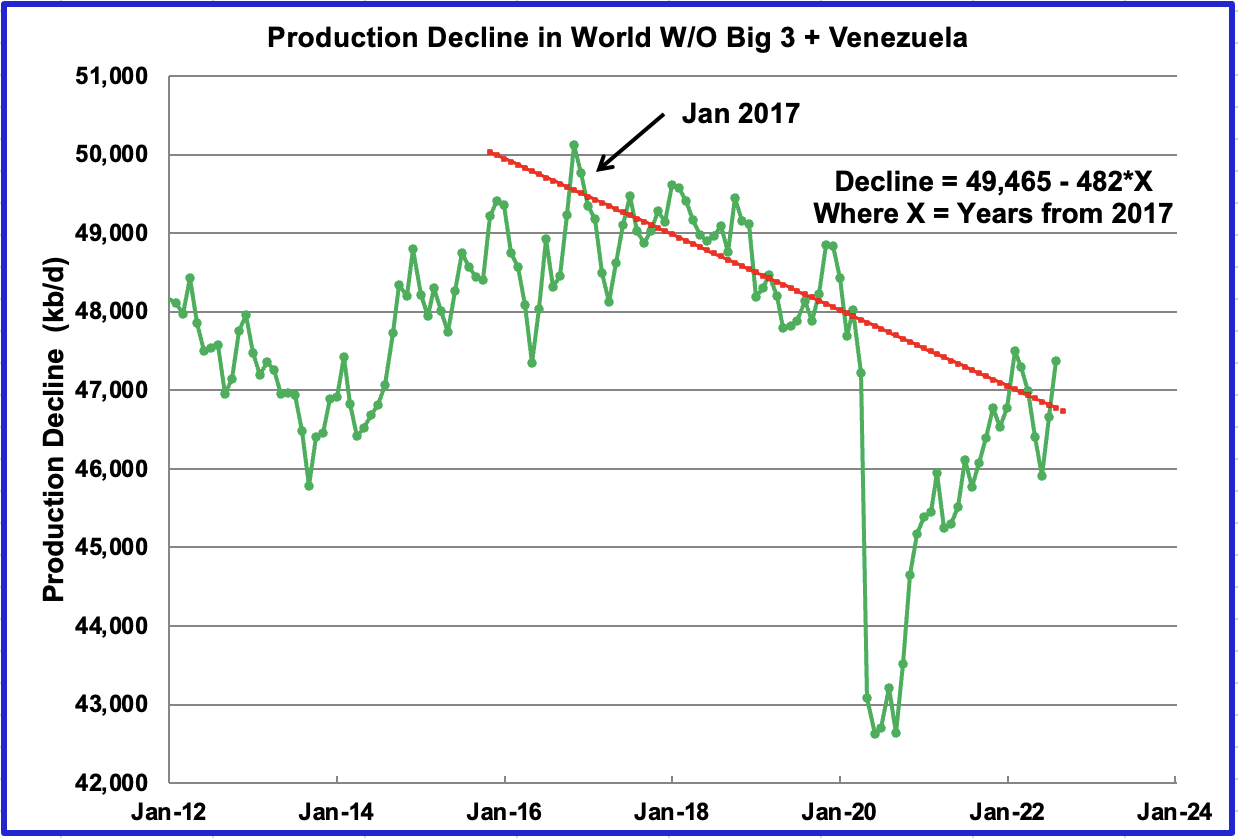
This chart shows the production decline in the world without the Big 3 plus Venezuela. The annual decline rate is 482 kb/d/yr. The point of this second chart is to show the impact of Venezuela on world oil decline rates. The OLS analysis is the same as done in the previous chart and provides a more recent decline rate, i.e. the time frame January 2017 to August 2022.
In looking at other combos for checking decline rates, I have decided it is best to leave out Venezuela because its historical production loss is related to sanctions as opposed to geology. Comparing the first and third charts, it appears that the world decline rate, excluding the Big 3 and Venezuela is in the neighbourhood of 500 kb/d/yr.
Editor’s Note: The summary bullets for this article were chosen by Seeking Alpha editors.
Be the first to comment