

Gold Price Talking Points
The price of gold consolidates following the failed attempt to test the November 2012 high ($1754), but the Federal Reserve meeting may heighten the appeal of the precious metal if the central bank shows a greater willingness to deploy more unconventional tools over the coming months.
Gold Price Outlook Hinges on Federal Reserve Interest Rate Decision
The price of gold carves a fresh series of lower highs and lows ahead of the Federal Open Market Committee (FOMC) interest rate decision as the Great Lockdown appears to have passed its peak.
The price of gold may face a larger pullback going in May as governments across Australia unveil plans to gradually roll back the lockdown laws, with the US taking a similar approach as the Trump administration outlines a three-phased approach to reopen the economy.
President Donald Trump tweets “Many States moving to SAFELY & QUICKLY reopen” as the ‘stay at home’ order in Texas is set to expire on Thursday, and the efforts to gradually restart the advanced economies may drag on the price of gold as it curbs speculation for additional monetary support.
The unprecedented response by fiscal authorities may encourage the FOMC to alter the forward guidance for monetary policy, and Chairman Jerome Powell and Co. may adopt a less dovish tone as the central bank expands the scope of the Municipal Liquidity Facility (MLF), with the program to now offer “up to $500 billion in lending to states and municipalities.”
Nevertheless, the FOMC may keep the door open to implement more non-standard measures as the “timing of the resumption of growth in the U.S. economy depended on the containment measures put in place,” and the central bank may continue to utilize its balance sheet as the rate cuts from earlier this year pushed “the target range to its effective lower bound (ELB).”
Source: Federal Reserve
It remains to be seen if the dovish forward guidance will help to restore investor confidence as the FOMC relies on its unconventional tools to combat the economic shock from COVID-19, and the low interest rate environment along with the Fed’s ballooning balance sheet may continue to act as a backstop for goldas marketparticipants look for an alternative to fiat-currencies.
However, the price of bullion may continue to consolidate over the remainder of the month amid the string of failed attempt to test the November 2012 high ($1754), with the Relative Strength Index (RSI) highlighting a similar dynamic as a bearish formation takes shape.
Sign up and join DailyFX Currency Strategist David Song LIVE for an opportunity to discuss potential trade setups.
Gold Price Daily Chart
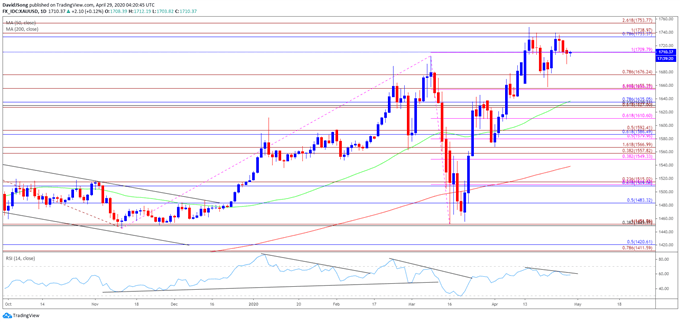
Source: Trading View
- The opening range for 2020 instilled a constructive outlook for the price of gold as the precious metal cleared the 2019 high ($1557), with the Relative Strength Index (RSI) pushing into overbought territory during the same period.
- A similar scenario materialized in February, with the price of gold marking the monthly low ($1548) during the first full week, while the RSI broke out of the bearish formation from earlier this year to push back into overbought territory.
- However, the monthly opening range for March as less relevant amid the pickup in volatility, with the decline from the monthly high ($1704) leading to a break of the January low ($1517).
- Nevertheless, the reaction to the former-resistance zone around $1450 (38.2% retracement) to $1452 (100% expansion) instilled a constructive outlook for bullion especially as the RSI reversed course ahead of oversold territory and broke out of the bearish formation carried over from the previous month.
- The break/close above $1710 (100% expansion) pushed the price of gold to a fresh yearly high ($1748), but the precious metal continues to track the range from earlier this month amid the lack of momentum to test the November 2012 high ($1754).
- The Relative Strength Index (RSI) highlights a similar dynamic as a bearish formation takes shape following the failed attempts to push into overbought territory.
- In turn, gold may continue to consolidate over the remainder of the month amid the string of failed attempt to close above the Fibonacci overlap around $1733 (78.6% retracement) to $1739 (100% expansion), with the lack of momentum to hold above the $1710 (100% expansion) region bringing the $1676 (78.6% expansion) area on the radar as the price for bullion carves a fresh series of lower highs and lows.
- Next area of interest comes in around $1655 (78.6% expansion) followed by the Fibonacci overlap around $1627 (61.8% expansion) to $1635 (78.6% retracement).

Recommended by David Song
Traits of Successful Traders
— Written by David Song, Currency Strategist
Follow me on Twitter at @DavidJSong
Be the first to comment