

Dow Jones, FTSE 100, DAX 30 Trader Positioning – Talking Points
- Short exposure to global equities climbed recently
- The Dow Jones, FTSE 100 and DAX 30 also rose
- What is the contrarian outlook for stocks ahead?
What Does Trader Positioning Say About Global Stock Market Trends?
Upside momentum in global equity indexes such as the Dow Jones, FTSE 100 and DAX 30 has been cautiously reinvigorated since I discussed them last week. Short exposure in these from retail traders has been slowing climbing since. Will this continue and what can that mean for global markets ahead?
Starts in:
Live now:
May 06
( 00:05 GMT )
Recommended by Daniel Dubrovsky
What Do Other Traders Buy/Sell Bets Say About Price Trends?
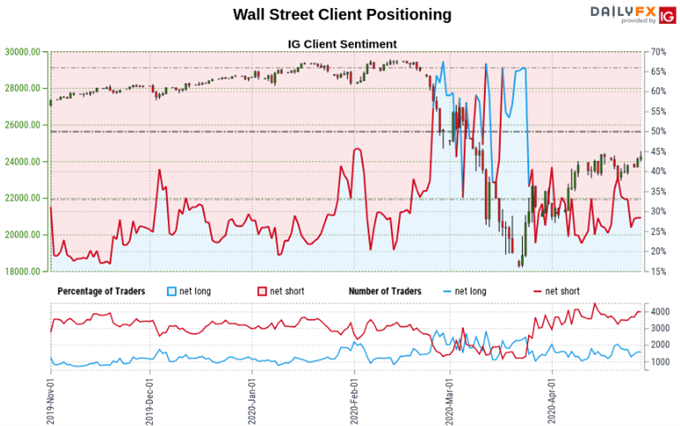
Dow Jones Sentiment Outlook
According to IG Client Sentiment (IGCS), about 36.39% of traders are net long the Dow Jones at the time of this writing. This is down from about a 65% net long standpoint when prices bottomed last month. Yet those biased to the upside are up 6.03% from yesterday while down 4.91% over a weekly basis. The combination of current sentiment and recent changes gives a further mixed Wall Street trading bias.
Dow Jones Technical Analysis
From a technical standpoint, Dow Jones futures are pressuring former rising support from 2016 – blue lines on the 4-hour chart below. Resistance seems to be holding at 24327 while a near term trend line from early April seems to be guiding the index higher – green line. Further gains may place the focus on key resistance at 25020. A turn lower could pave the way for a retest of 23000.

Recommended by Daniel Dubrovsky
Improve your trading with IG Client Sentiment Data
Dow Jones Futures 4-Hour Chart

Dow Jones Futures Chart Created in Trading View
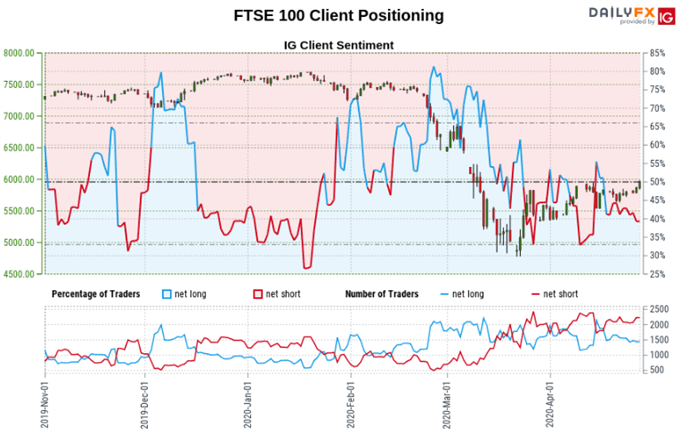
FTSE 100 Sentiment Outlook
About 33.76% of retail traders are net long the FTSE 100 based on IGCS at the time of writing. Those net short are 8.3% and 28.6% higher from yesterday and last week respectively. The combination of current sentiment and recent changes offers a stronger FTSE 100bullish contrarian trading bias. From a psychological perspective, that could speak to a greater share of investors attempting to sell as prices rise.
FTSE 100 Technical Analysis
The FTSE 100 attempted to break above a key range of resistance between 5861 and 5955. Yet prices struggled to find follow-through. Rising support from late March – green line below – may maintain the upside trajectory. This could pave the way to test resistance at 6169. Otherwise, a turn lower exposes key support at 5603.
FTSE 100 4-Hour Chart
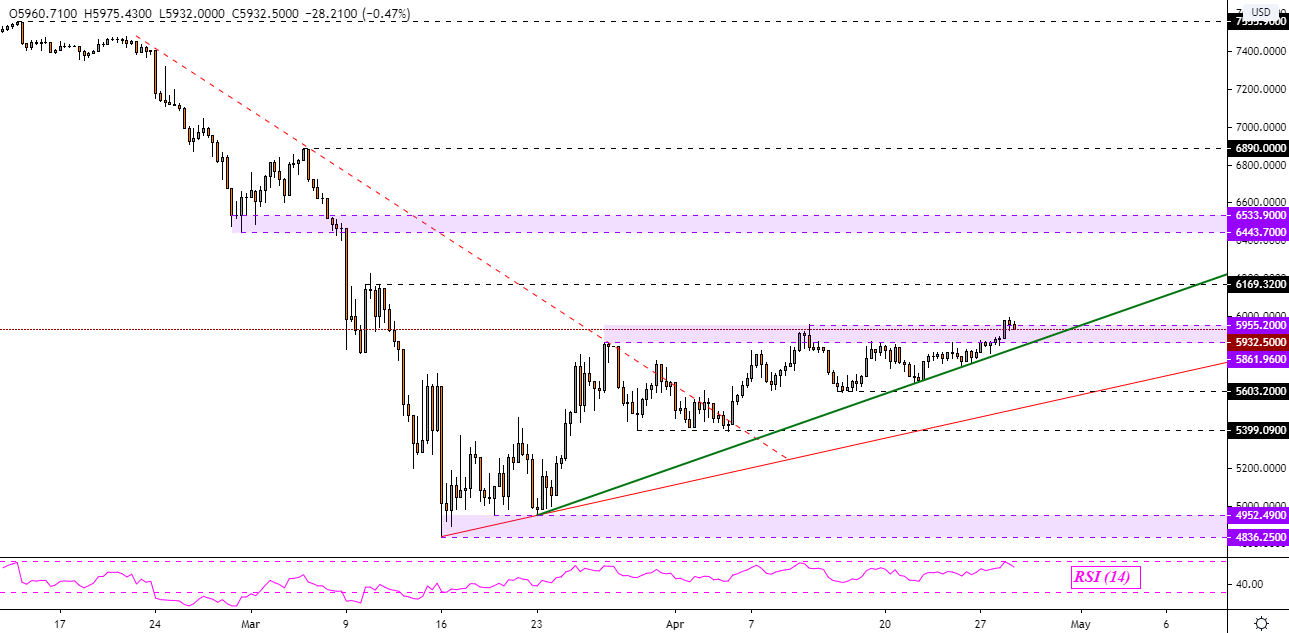
FTSE 100 Chart Created in Trading View
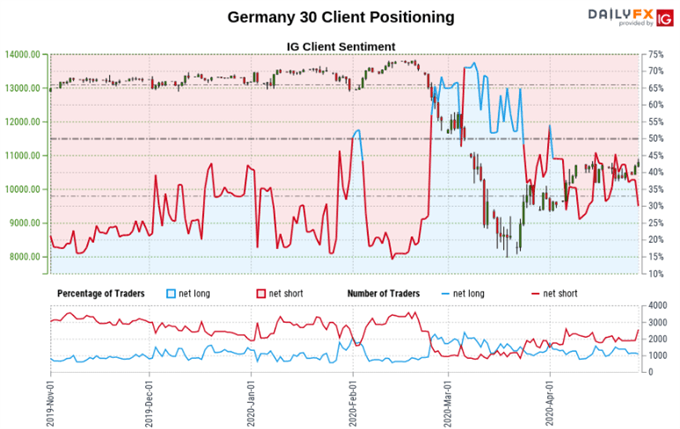
DAX 30 Sentiment Outlook
IGCS shows that roughly 31.58% of retail traders are net long the DAX 30 at the time of posting. The number of investors net long are 23.61% and 26.89% lower compared to yesterday and last week respectively. the combination of current sentiment and recent changes gives us a stronger DAX 30 bullish contrarian trading bias.
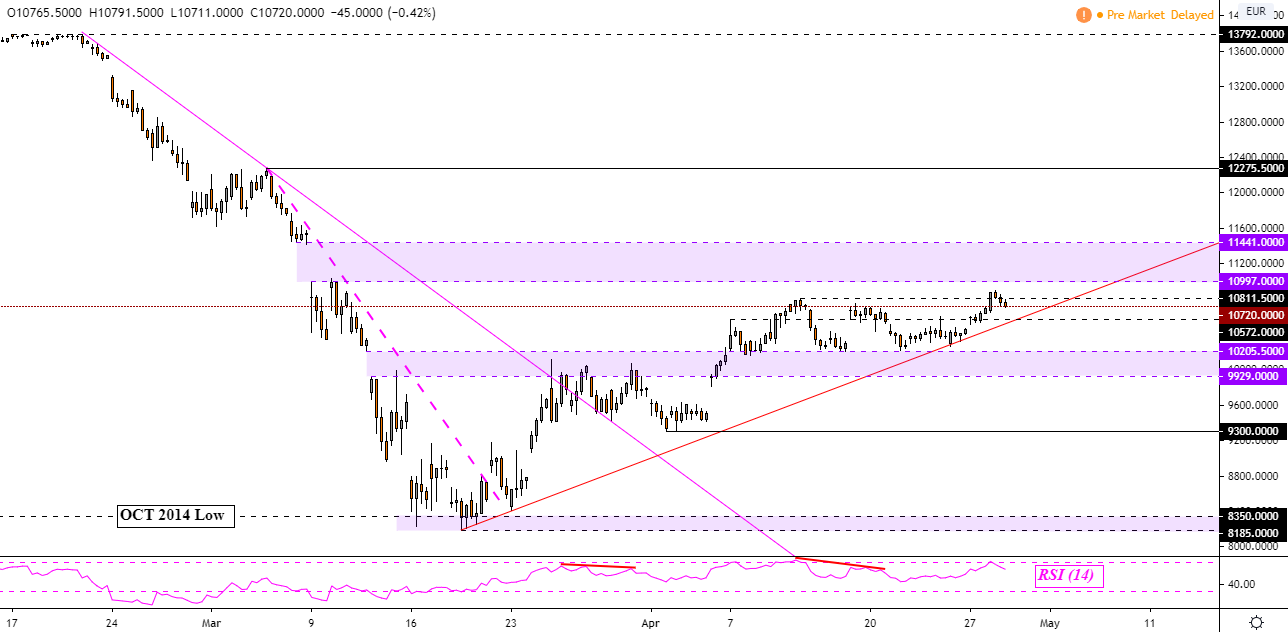
DAX 30 Technical Analysis
The DAX 30 struggled to maintain a push above key resistance at 10811 as prices face rising support from March’s bottom – red line below. Adherence to the trend line could push the DAX 30 into another wider range of resistance sitting above between 10997 to 11441. Otherwise a turn lower would expose the horizontal support range between 9929 to 10205.
DAX 30 Futures 4-Hour Chart
DAX 30 Futures Chart Created in Trading View
*IG Client Sentiment Charts and Positioning Data Used from April 28 Report
— Written by Daniel Dubrovsky, Currency Analyst for DailyFX.com
To contact Daniel, use the comments section below or @ddubrovskyFX on Twitter
Be the first to comment