

Gold Price Talking Points
The price of gold carves a series of lower highs and lows despite the kneejerk reaction to the US Personal Consumption Expenditure (PCE) Price Index, and bullion appears to be on track the test the monthly low ($1617) as it reverses ahead of the 50-Day SMA ($1680).
Gold Price Falls Towards Monthly Low After Failing to Test 50-Day SMA
The price of gold struggles to hold its ground amid the recent rebound in US Treasury yields, and the precious metal may track the negative slope in the moving average if it fails to defend the yearly low ($1615).
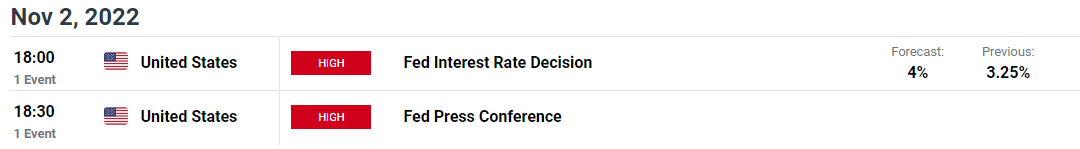
Looking ahead, the Federal Reserve interest rate decision on November 2 may influence the near-term outlook for gold as the central bank is expected to implement another 75bp rate hike, and Chairman Jerome Powell and Co. may continue to prepare US households and businesses for higher interest rates as the Federal Open Market Committee (FOMC) appears to be on track to carry its hiking-cycle into 2023.
As a result, the FOMC rate decision may drag on the price of gold should the committee show a greater willingness to pursue a highly restrictive policy, but it remains to be seen if the central bank will maintain its existing approach in combating inflation as the CME FedWatch Tool reflects speculation for a smaller rate hike in December.
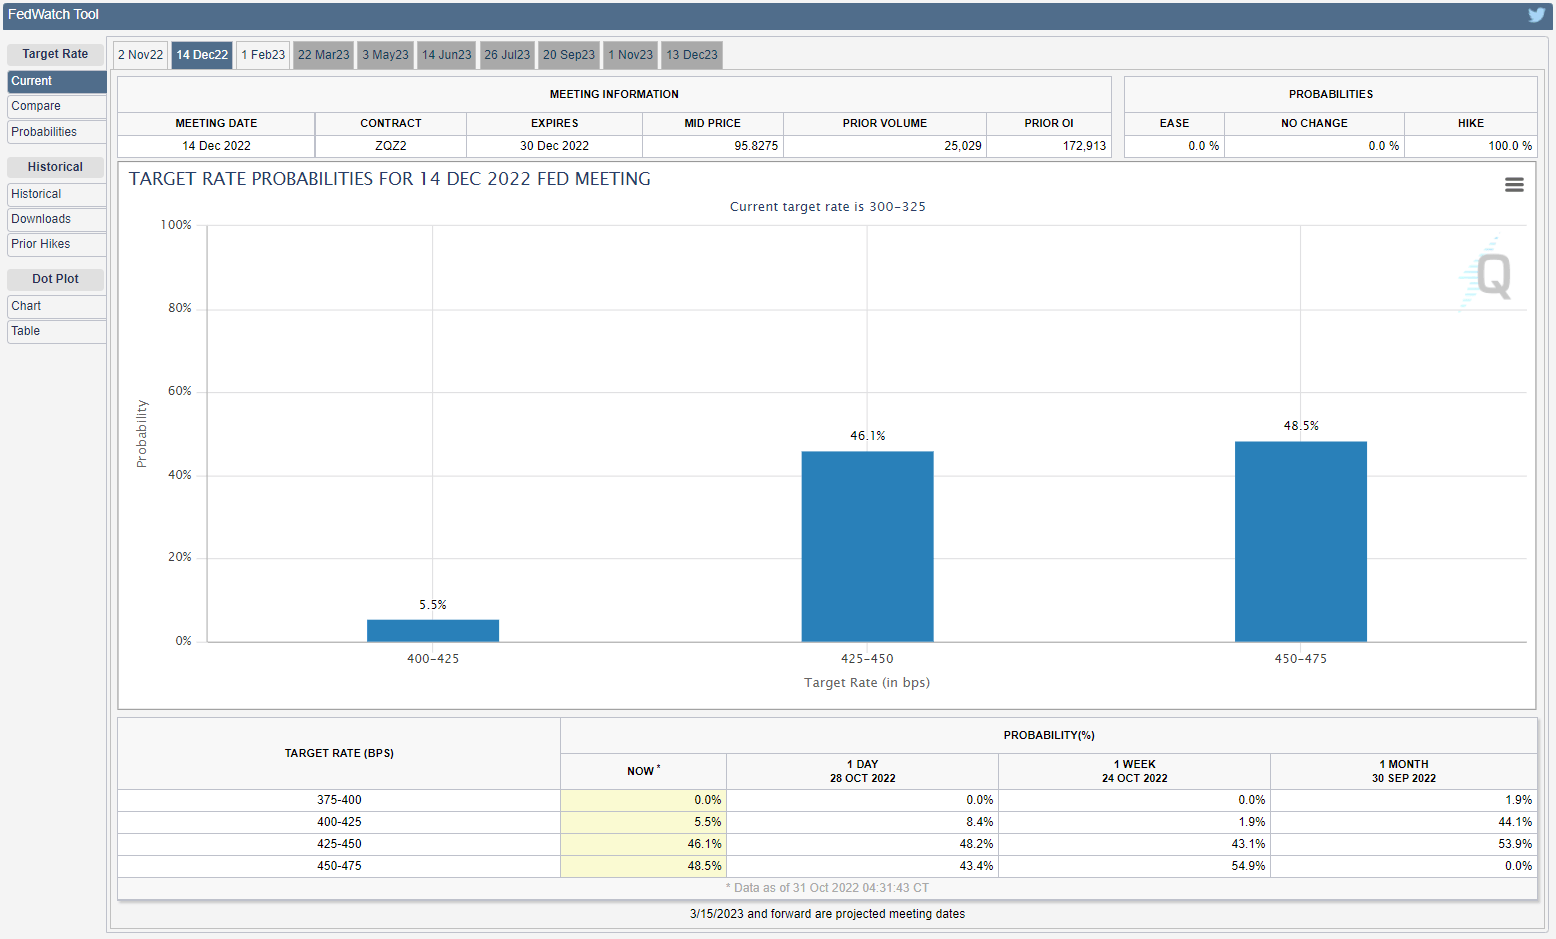
Source: CME
In turn, a shift in the Fed’s forward guidance may heighten the appeal of gold as the central bank acknowledges that “it would become appropriate at some point to slow the pace of policy rate increases while assessing the effects of cumulative policy adjustments on economic activity,” and the precious metal may continue to defend the September low ($1615) should the FOMC deliver a dovish rate-hike.
With that said, the price of gold may attempt to test the test the monthly low ($1617) as it reverses ahead of the 50-Day SMA ($1680), but the Fed rate decision may prop up the previous metal if the central bank plans to implement smaller rate hikes over the coming months.
Gold Price Daily Chart

Source: Trading View
- The price of gold carves a series of lower highs and lows following the string of failed attempts to close above $1670 (50% expansion), and the precious metal may continue to track the negative slope in the 50-Day SMA ($1680) as it reverses ahead of the moving average.
- Failure to defend the September low ($1615) along with a close below the Fibonacci overlap around $1601 (38.2% expansion) to $1618 (50% retracement) may push the price of gold towards the $1584 (78.6% retracement) region, with the next area of interest coming in around the April 2020 low ($1568).
- However, the price of gold may continue to track the September range as it holds above the monthly low ($1617), with a move above the $1648 (50% expansion) region bringing $1670 (50% expansion) back on the radar.
Trading Strategies and Risk Management
Becoming a Better Trader
Recommended by David Song
— Written by David Song, Currency Strategist
Follow me on Twitter at @DavidJSong
Be the first to comment