

Gold Price Talking Points
The price of gold appears to have reversed course following the failed attempt to test the February high ($1872), and the precious metal may struggle to retain the rebound from the November low ($1765) as the weakness coincides with a rise in longer-dated US Treasury yields.
Gold Price Eyes Monthly Low as US Yields Approach Pre-Pandemic Levels
The price of gold approaches the monthly low ($1785) as the 10-Year US Treasury yield hits 1.25%, with the flattening slopes in the 50-Day ($1856) and 200-Day SMA ($1856) casting a bearish outlook as the moving averages start to converge with one another.
A ‘death cross’ formation may take shape over the coming days even though the Federal Reserve remains on track to “increase our holdings of Treasury securities by at least $80 billion per month and of agency mortgage-backed securities by at least $40 billion per month,” and the decline from the record high ($2075) seems to be a shift in market behavior rather than an exhaustion in the broader trend as the low interest rate environment no longer provides a backstop for bullion.
In turn, the price of gold may remain under pressure ahead of the next Federal Open Market Committee (FOMC) interest rate decision on March 17 as longer-dated Treasury yields push towards pre-pandemic levels, and it seems as though the central bank is in no rush to switch gears asChairman Jerome Powellemphasizes that “we are still very far from a strong labor market.”
With that said, the price of gold may continues to give back the rebound from the November low ($1765) as the precious metal no longer exhibits the bullish price action from 2020, and the Relative Strength Index (RSI) may indicate a further decline in gold prices if the oscillator crosses below 30 and pushes into oversold territory.
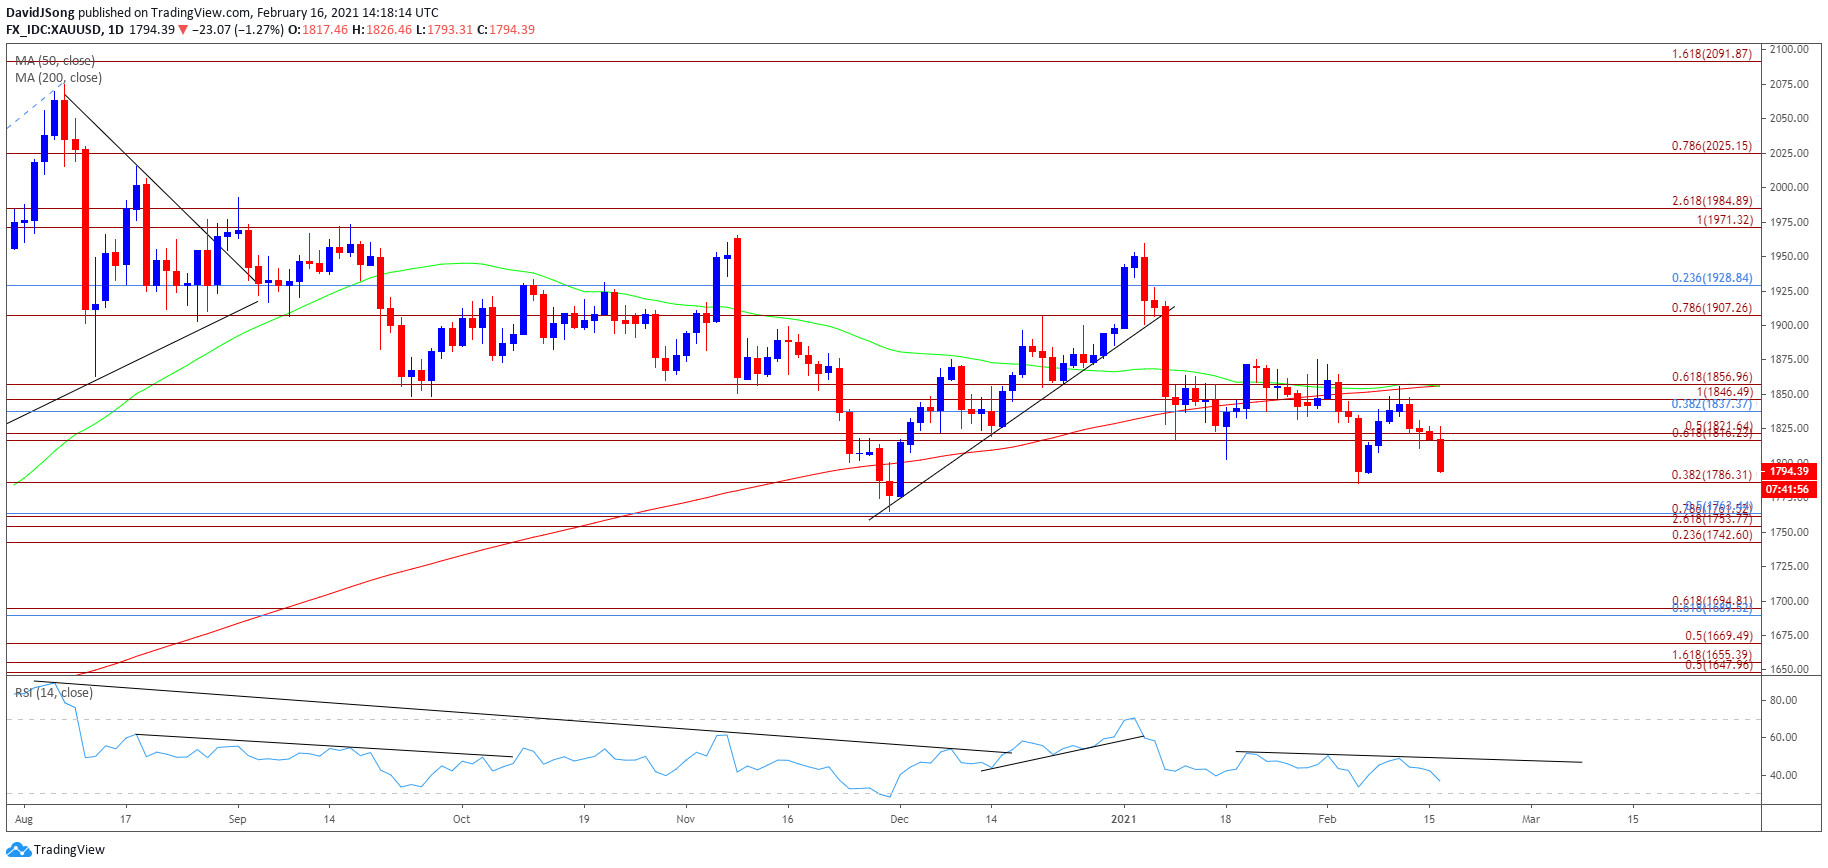
Gold Price Daily Chart
Source: Trading View
- Keep in mind, the price of gold pushed to fresh yearly highs throughout the first half 2020, with the bullish price action also taking shape in August as the precious metal tagged a new record high ($2075).
- However, the bullish behavior failed to materialize in September as the price of gold traded below the 50-Day SMA ($1856) for the first time since June, with developments in the Relative Strength Index (RSI) negating the wedge/triangle formation established in August as the oscillator slipped to its lowest level since March.
- The RSI dipped into oversold territory in November for the first time since 2018, with the correction from the record high ($2075) indicating a potential shift in market behavior as the price of gold continues to trade at its lowest level since July.
- In turn, the V-shape recoverythat materialized ahead of the July low ($1758) may continue to unravel as the price of gold approaches the February low ($1785), and the RSI may show the bearish momentum gathering pace if the oscillator crosses below 30 and pushes into oversold territory like the behavior seen in November.
- Need a close below the $1786 (38.2% expansion) region to bring the Fibonacci overlap around $1743 (23.6% expansion) to $1763 (50% retracement) on the radar, with the next area of interest coming in around $1690 (61.8% retracement) to $1695 (61.8% expansion).

Recommended by David Song
Traits of Successful Traders
— Written by David Song, Currency Strategist
Follow me on Twitter at @DavidJSong
Be the first to comment