

Gold Price Talking Points
The price of gold retraces the decline from earlier this month as the Federal Reserve deploys more unconventional tools to curb the weakening outlook for growth, and the precious metal appears to be making a run at the yearly high ($1704) following the reaction to the former-resistance zone around $1450 (38.2% retracement) to $1452 (100% expansion).
Gold Price Eyes 2020 High Following Reaction to Former Resistance Zone
The price of gold carves a series of higher highs and lows as the Federal Open Market Committee (FOMC) expands the use of its non-standard tools, with the central bank pledging to establish a“Main Street Business Lending Program to support lending to eligible small-and-medium sized businesses.”
It seems as though major central banks will continue to push the limits of monetary policy as their benchmark interest rate sit near zero, and the FOMC along with its counterparts may take additional steps to combat the supply/demand shock amid the growing number of coronavirus cases.
The wave of monetary and fiscal stimulus should help to cushion the world economy especially as US Treasury Secretary Steven Mnuchin tweets that G7 officials “will work together to restore economic growth and protect jobs and businesses,” but the slew of non-standard measures may ultimately lead to unintended consequences as central banks push monetary policy into uncharted territory.
With that said, the low interest rate environment may act as a backstop for goldas marketparticipants look for an alternative to fiat-currencies, and the broader outlook for bullion remains constructive as the reaction to the former-resistance zone around $1450 (38.2% retracement) to $1452 (100% expansion) helped to rule out the threat of a Head-and-Shoulders formation.

Recommended by David Song
Download the 1Q 2020 Forecast for Gold
Sign up and join DailyFX Currency Strategist David Song LIVE for an opportunity to discuss potential trade setups.
Gold Price Daily Chart
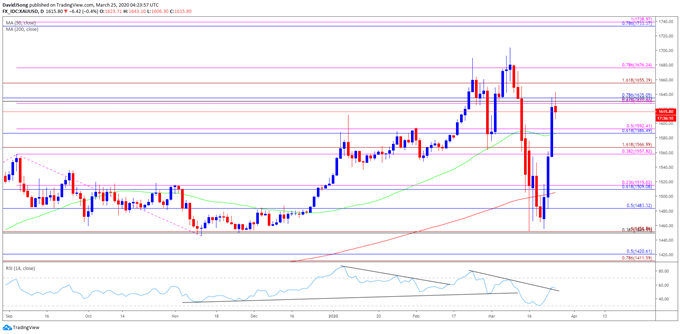
Source: Trading View
- The opening range for 2020 instilled a constructive outlook for the price of gold as the precious metal cleared the 2019 high ($1557), with the Relative Strength Index (RSI) pushing into overbought territory during the same period.
- A similar scenario materialized in February, with the price of gold marking the monthly low ($1548) during the first full week, while the RSI broke out of the bearish formation from earlier this year to push back into overbought territory.
- However, the price of gold has failed to maintain the monthly opening range for March after trading to a fresh yearly high ($1704), with the recent decline producing a break of the January low ($1517).
- Nevertheless, the reaction to the former-resistance zone around $1450 (38.2% retracement) to $1452 (100% expansion) casts a constructive outlook for bullion especially as the RSI reverses course ahead of oversold territory and breaks out of the bearish formation carried over from the previous month.
- Need a break/close above the Fibonacci overlap around $1627 (61.8% expansion) to $1635 (78.6% retracement) to bring the $1655 (161.8% expansion) region on the radar, with the next area of interest coming in around $1676 (78.6% expansion) followed by the yearly high ($1704).

Recommended by David Song
Traits of Successful Traders
— Written by David Song, Currency Strategist
Follow me on Twitter at @DavidJSong
Be the first to comment