

Gold price started a fresh increase above the $1,960 resistance. Crude oil price is also rising and might climb further above the $107.
Important Takeaways for Gold and Oil
· Gold price started a fresh increase above $1,930 and $1,950 against the US Dollar.
· There is a key bullish trend line forming with support near $1,968 on the hourly chart of gold.
· Crude oil price gained pace after it broke the $100 and $102 resistance levels.
· There is a key bullish trend line forming with support near $103.20 on the hourly chart of XTI/USD.
Gold Price Technical Analysis
Gold price formed a support base near $1,910 and started a fresh increase against the US Dollar. The price gained pace for a move above the $1,925 level to move into a positive zone.
There was a clear move above the $1,960 level and the 50 hourly simple moving average. The price even climbed above the $1,975 resistance level. However, it faced resistance near the $1,980 and $1,982 levels.
A high is formed near $1,981 on FXOpen and the price is now consolidating gains. There was a minor decline below $1,970, but the bulls were active near $1,960.
The price recovered and climbed above the 50% Fib retracement level of the downward move from the $1,981 swing high to $1,960 low. The price is now trading well above $1,960 and the 50 hourly simple moving average.
On the upside, the price is facing resistance near the $1,975 level. The main resistance is now forming near the $1,980 level. A close above the $1,980 level could open the doors for a steady increase towards $1,990. The next major resistance sits near the $2,000 level.
On the downside, an initial support is near the $1,970 level. There is also a key bullish trend line forming with support near $1,968 on the hourly chart of gold.
The next major support is near the $1,960 level, below which there is a risk of a larger decline and the price might even struggle to stay above $1,950.
Oil Price Technical Analysis
Crude oil price formed a base above the $92 level against the US Dollar. The price started a major increase above the $95 and $98 resistance levels.
The price even climbed above the $100 level and the 50 hourly simple moving average. Finally, there was a move above the $105 level. A high is formed near $106.96 and the price is now consolidating gains.
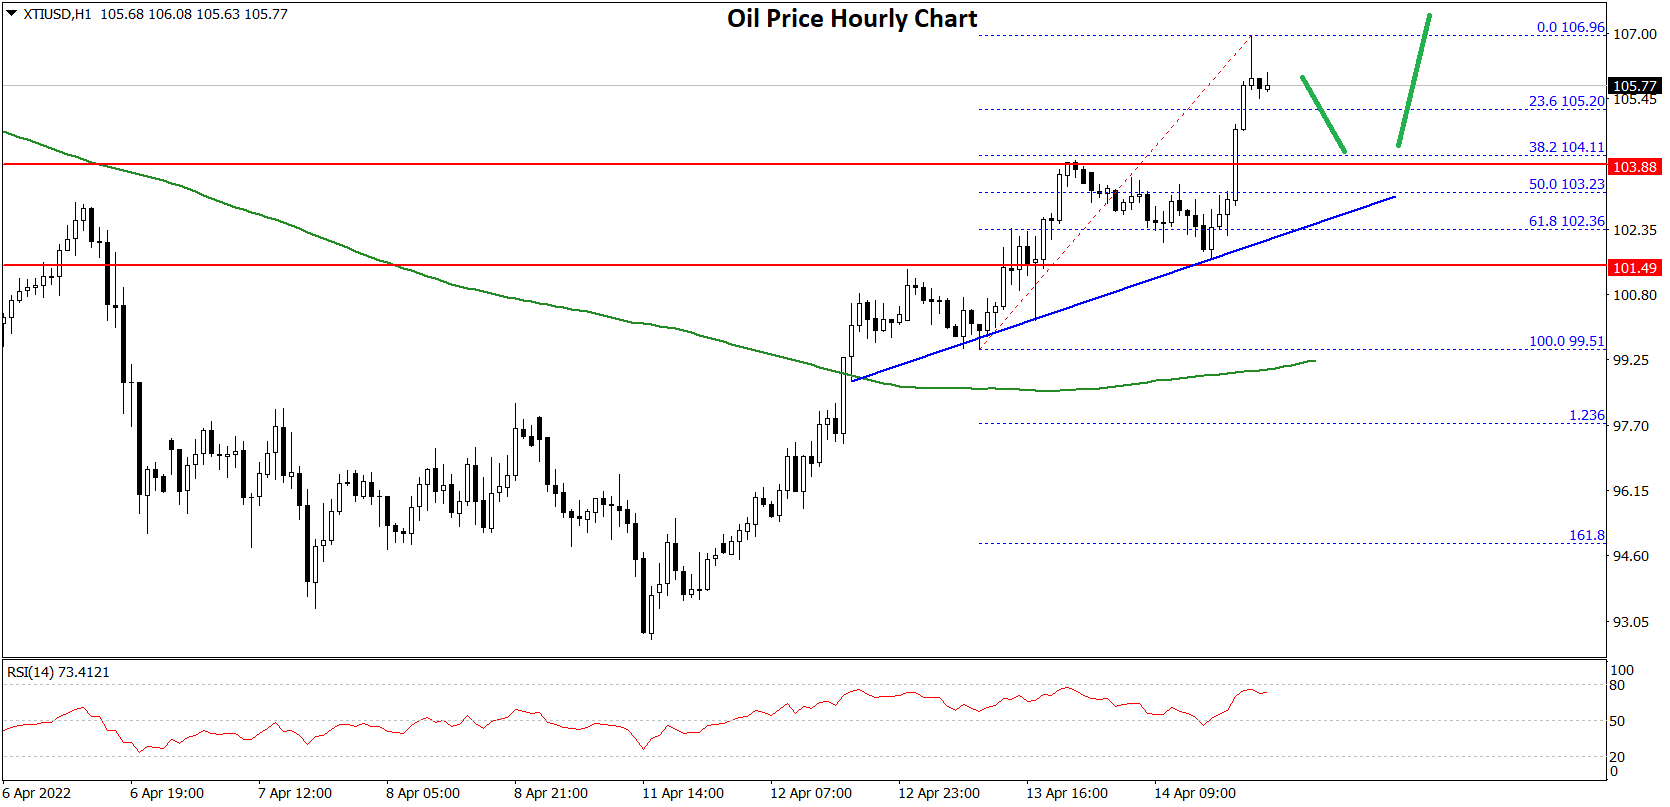
An immediate support is near the $105.20 level. It is near the 23.6% Fib retracement level of the upward move from the $99.51 swing low to $106.96 high.
The next major support is near the $103.20 level. There is also a key bullish trend line forming with support near $103.20 on the hourly chart of XTI/USD. The trend line is close to the 50% Fib retracement level of the upward move from the $99.51 swing low to $106.96 high.
If there is a downside break, the price might decline towards $101.50. On the upside, the price might face resistance near the $106.50 level.
The next key resistance is near the $107.00 level, above which the price might accelerate higher towards $110.00.
This forecast represents FXOpen Markets Limited opinion only, it should not be construed as an offer, invitation or recommendation in respect to FXOpen Markets Limited products and services or as financial advice.

Be the first to comment