

monsitj/iStock via Getty Images
Best of a bad bunch
Gold fell for the sixth consecutive month, dropping 2.6% to finish September at US$1,671.8/oz. It was a challenging month for most assets, with global equities down 9.5%, global bonds down 5.1% and commodities down 8.4% (Chart 5). While a relative outperformer and thus a good diversifier, gold wasn’t the crisis hedge it has often been historically, certainly when measured in US dollars. However, for non-US investors, gold performance remains strong YTD (Table 1).
Adding to pressure on the US dollar gold price, gold futures fell to their shortest net position in four years. In addition, gold ETF outflows continued, with holdings falling 95 tonnes over the month. Price resistance under these pressures was, however, quite impressive: gold hit a monthly intra-day low of US$1,615/oz but recovered to end the month above US$1,670/oz.2
Our Gold Return Attribution Model (GRAM) highlights a disconnect between what was suggested by gold’s long-term drivers and how gold actually fared (Chart 1). Large positive residuals – captured by the ‘unexplained’ category – during 2022 are likely the result of an unquantified geopolitical risk premium in gold and/or a change in the sensitivity of gold to some of the underlying variables. We believe both factors are at play.
In the case of a sensitivity change, we believe investors are less concerned – but not unconcerned – about rising interest rates, as forward expectations of rates remain anchored at considerably lower levels.
|
Data as of 6 October, 2022 Sources: Bloomberg, World Gold Council; Disclaimer *To 30 September 2022. Our Gold Return Attribution Model (GRAM) is amultiple regression model of monthly gold price returns, which we group intofour key thematic driver categories of gold’s performance: economic expansion,risk & uncertainty, opportunity cost, and momentum. These themes capturemotives behind gold demand; most poignantly, investment demand, which isconsidered the marginal driver of gold price returns in the short run.‘Unexplained’ represents the percentage change in the gold price that is notexplained by factors currently included in the model. Results shown here arebased on analysis covering an estimation period from February 2007 toSeptember 2022.
|
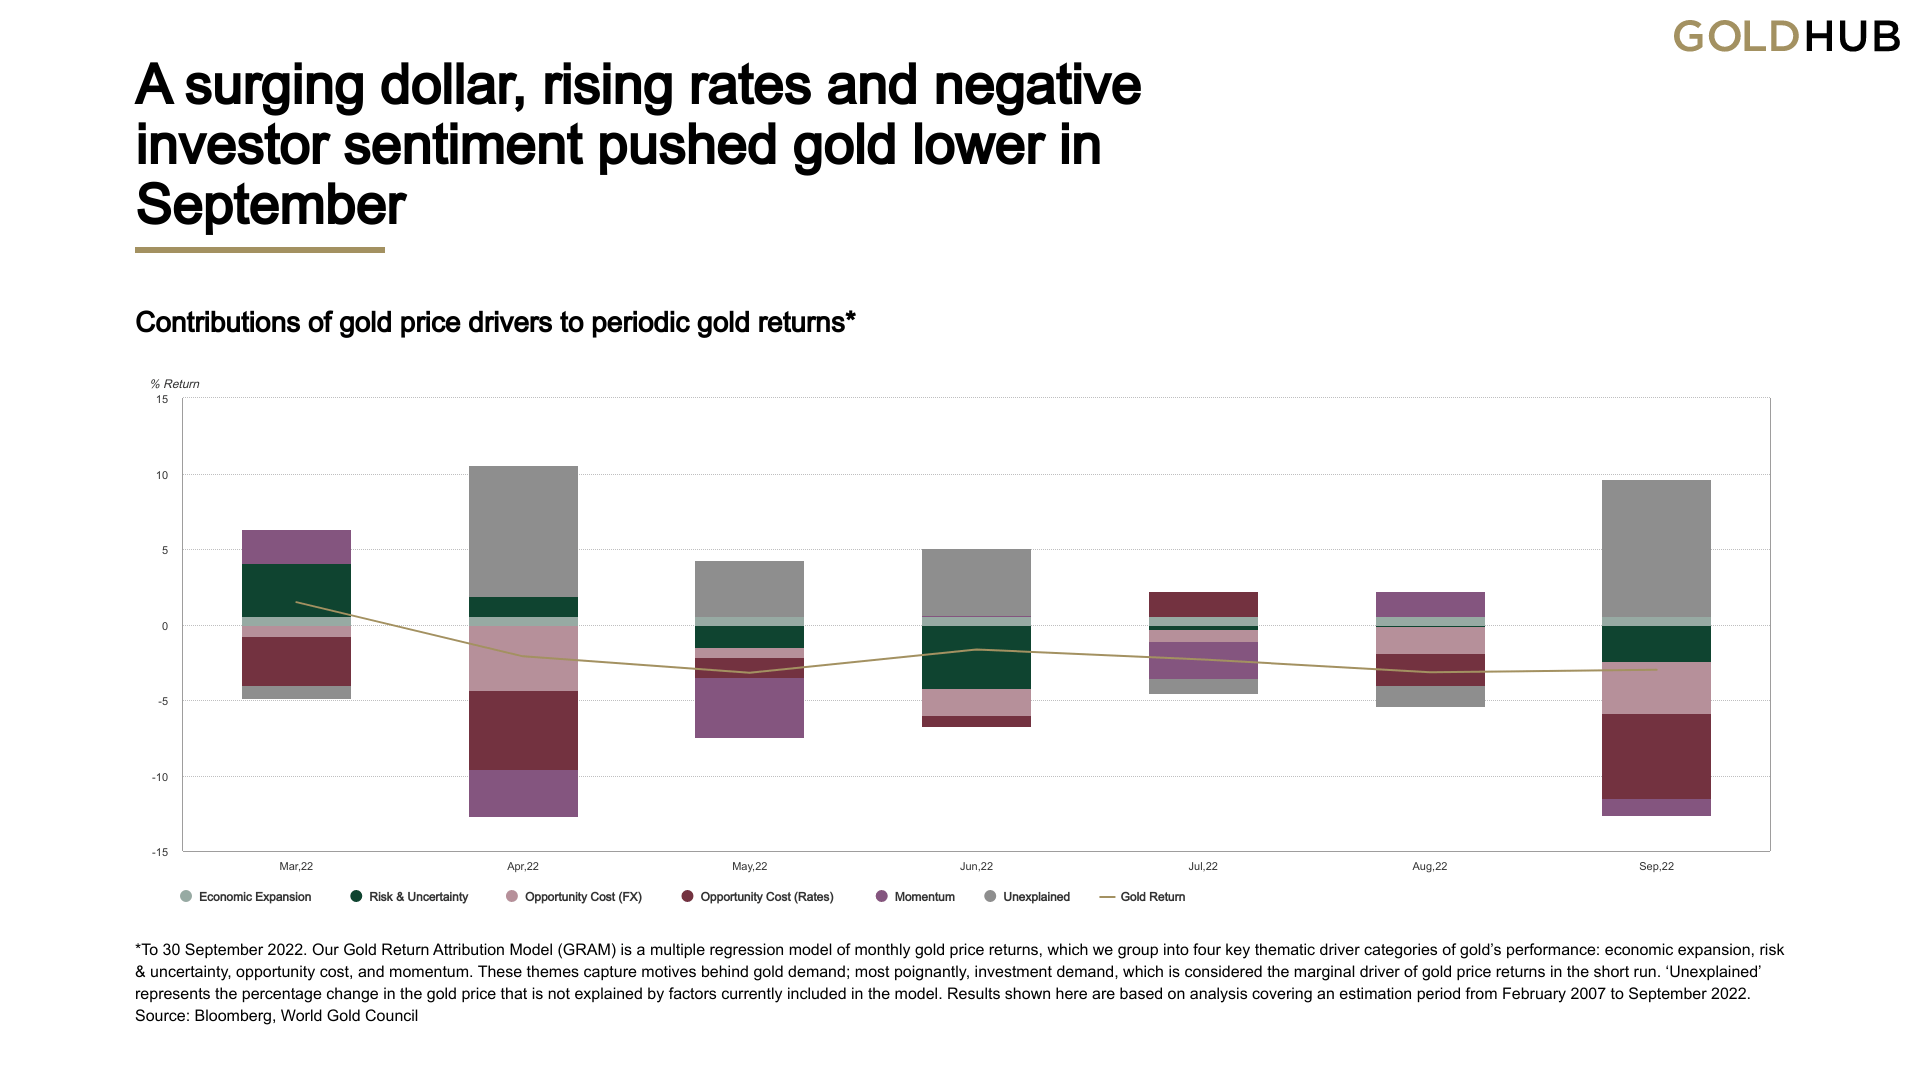
Table 1: Gold’s y-t-d performance continues to remain positive for investors outside the US
Gold price and return in different periods across key currencies*
| USD (OZ) | EUR(OZ) | JPY (G) | GBP(OZ) | CAD (OZ) | CHF (OZ) | INR (10g) | RMB (G) | TRY (OZ) | AUD (OZ) | |
|---|---|---|---|---|---|---|---|---|---|---|
| 30 Sep price | 1,672 | 1,706 | 7,779 | 1,497 | 2,312 | 1,650 | 43,723 | 382 | 30,975 | 2,612 |
| September return | -2.6% | -0.1% | 1.5% | 1.4% | 2.6% | -1.6% | -0.3% | 0.6% | -0.8% | 4.2% |
| YTD return | -7.4% | 7.4% | 16.4% | 12.3% | 1.4% | 0.3% | 1.3% | 3.4% | 29.2% | 5.2% |
|
*As of 30 September 2022. Based on the LBMA Gold Price PM in local currencies: US dollar (USD), euro (EUR), Japanese yen (JPY), pound sterling (GBP), Canadian dollar (CAD), Swiss franc (CHF), Indian rupee (INR), Chinese yuan (RMB), Turkish lira (TRY), and Australian dollar (AUD). Source: Bloomberg, ICE Benchmark Administration, World Gold Council |
Looking ahead…
Downed by the dollar
The surge in the US dollar – up 15%in 2022 alone as measured by the US dollar index (DXY)3 – has been a headache for many assets in H2 and is now becoming a rising burden for central banks. And the impact on gold has been two-fold. First, gold is most commonly quoted in US dollars – so, as it’s numeraire, a stronger dollar necessarily leads to a falling gold price. Second, this impact has been compounded in the recent rally by the dollar’s safe-haven demand, creating competition for gold. Outside of the US, gold has done well in both nominal and real terms (Table 2).
Two factors explain almost 90% of US dollar strength since late 2020:4 interest rates differentials and safe-haven flows.5
Aggressive US Fed monetary policy tightening relative to other major central banks has made the US an attractive destination to obtain yield. Alongside this, the Fed’s overnight liquidity reverse-repo (RRP) facility has become a refuge for investors, doubling holdings from US$1.2trn to US$2.4trn in a year.
In our view, there are three factors that might trigger a reversal -or at least a pause – in the US dollar, thus alleviating some of the pressure on gold:
- A historically high valuation and positioning in the US dollar relative to DXY components
- Central bank intervention in FX markets and/or bond markets
- Better aligned bond market expectations.
Valuations and positioning stretched
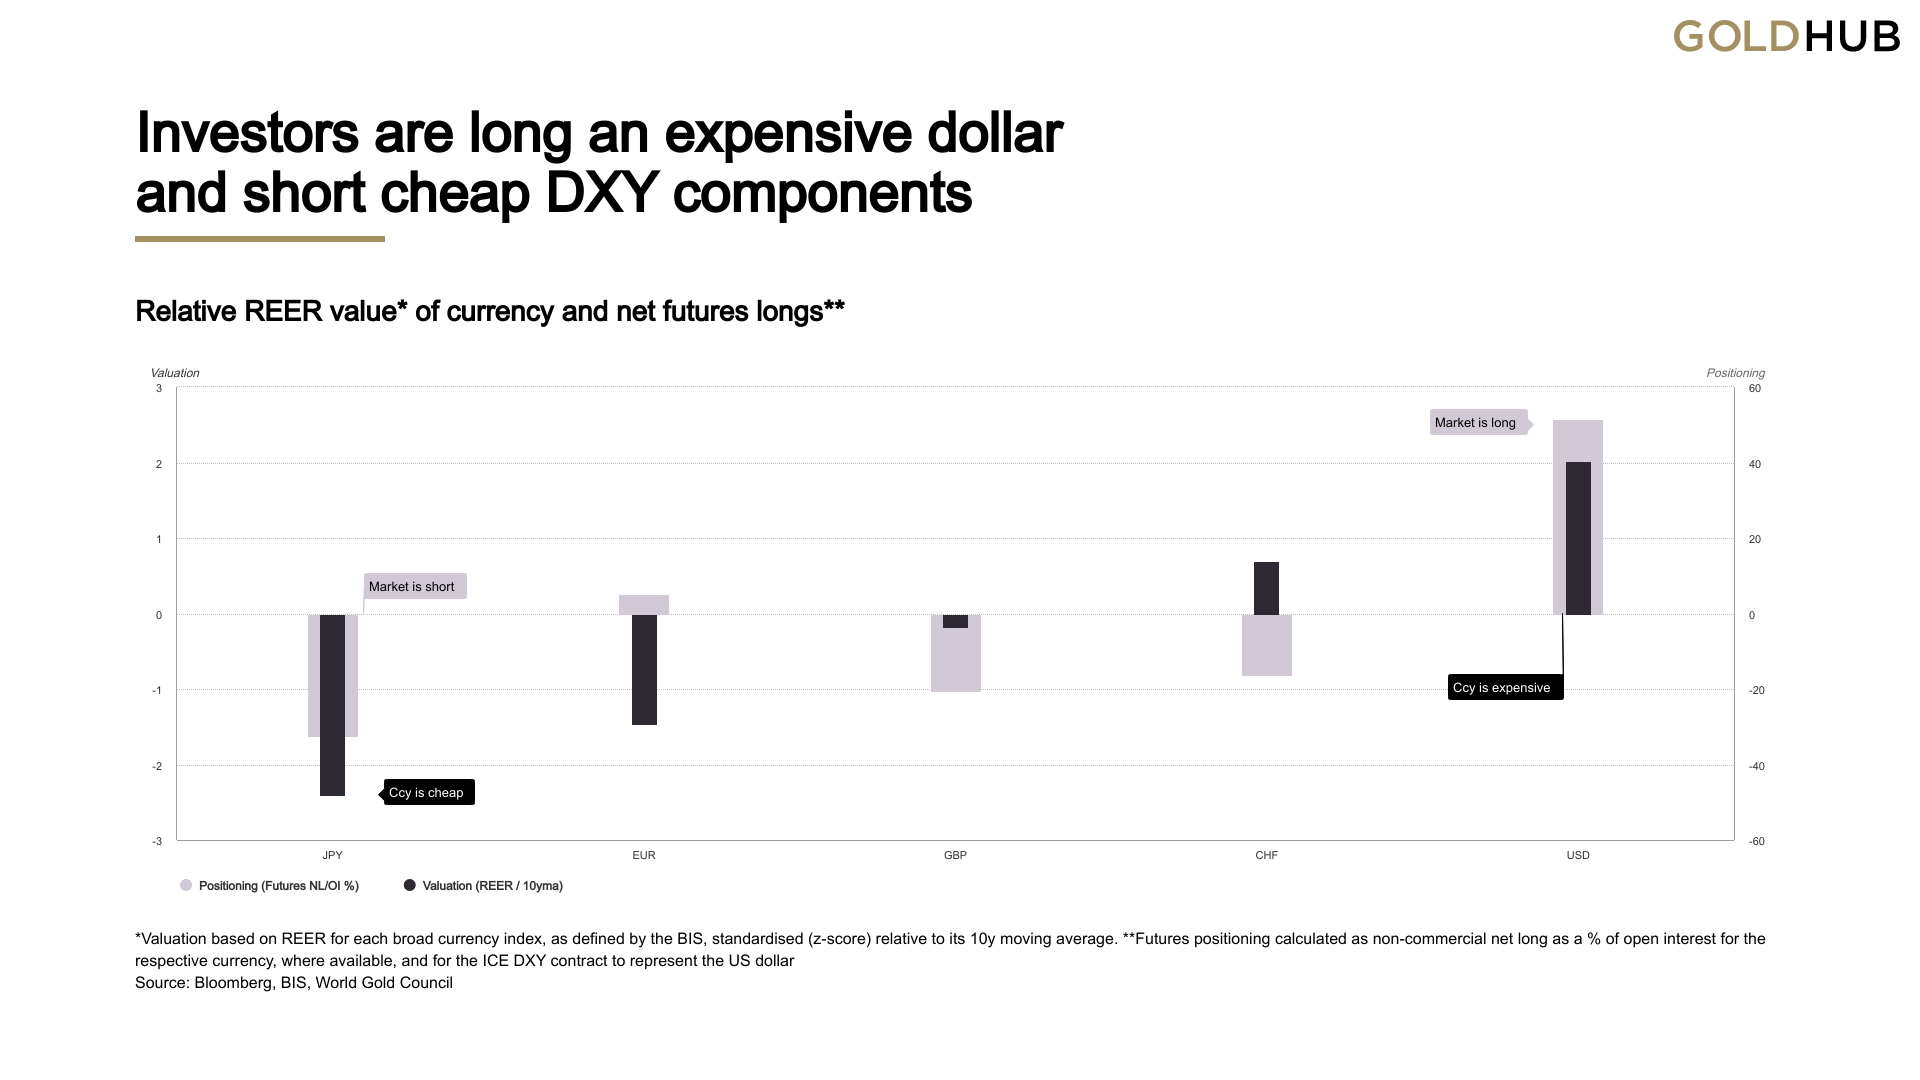
The DXY sits at a 20-year high and, on a relative real effective exchange rate (REER) basis,6 the US dollar is currently the most expensive major currency by some margin. Futures positioning also indicates a crowded long DXY vs EUR, JPY and GBP (Chart 2), the main components in the DXY. These extreme positions now appear to be rolling over.7 In the last 10 years, when DXY net longs as a share of open interest have fallen back decisively through 40% from an elevated position, it has coincided with a more prolonged drop in the DXY itself.8 The net long share is currently 55, having dropped from a peak of 77 in June.9
Table 2: Gold’s performance dampened in USD, but not elsewhereGold price and annual return in key currencies*
|
|
Sources: Bloomberg, Bank for International Settlements, World Gold Council; Disclaimer *Valuation based on REER for each broad currency index, as defined by the BIS, standardised (z-score) relative to its 10y moving average. **Futures positioning calculated as non-commercial net long as a % of open interest for the respective currency, where available, and for the ICE DXY contract to represent the US dollar. |
Central banks may have had enough
Only three years ago countries were vying for weaker currencies. Now they are anathema to economic health. Broad-based policy tightening to combat inflation has been undermined by dollar strength. So much so that active intervention in FX markets is now being implemented.
The Bank of Japan (BoJ) intervened on 22 September, for the first time in 24 years. Whether their actions prove successful remains to be seen. But the fact that the yen – which makes up 15% of the DXY – remains the cheapest major currency, has a sizeable net short position against it, and the BoJ has the largest hoard of US dollar assets10 with which to defend its currency, suggests a significant risk of a reversal.
Yen intervention was swiftly followed by similar action in China and India – not DXY components but an important signal nonetheless. There have also been interventions in bond markets by the BoE (12% of DXY) – indirectly supporting the sudden fall in the currency – and to a lesser extent the ECB (57% of DXY), with its support for Italian bonds.
Interventions historically have been more successful when done jointly, (as in the Plaza Accord in 1985), so full-scale ECB participation might be required. Should this occur, the impact on the dollar could be material. A recent survey from Bloomberg11 showed that 45% of 795 respondents expected an orchestrated response to stop the dollar’s run.
Impact on gold from a dollar turn
For gold, we see a dollar turn as a positive outcome, but there are risks too.
A dollar reversal would offer an almost immediate numeraire benefit. GRAM estimates a price elasticity of 0.88.12 This implies that, a 1% fall in the US dollar, holding all else constant, is associated with a 0.88% rise in gold. Hypothetically, a full unwind of DXY performance y-t-d return would imply a 13% rise in gold.
Further, one possible outcome of a weaker dollar would be a risk asset rally,13 potentially threatening to exacerbate global inflation problems. We view this as gold positive as it could draw more investors to gold as an inflation hedge, particularly in the absence of a dollar headwind.
A potential risk for gold is a disorderly offloading of US Treasuries, held as reserve assets, to defend currencies. This could push yields up further – raising gold’s opportunity cost. But an uncontrolled rise in yields would also present a whole new set of systemic problems which the US and other countries would most likely try to avoid, so we see that as a remote risk.14
Gold’s rate sensitivity appears to have fallen
Alongside the US dollar, rising US interest rates have also presented an obstacle to gold investment, with yields increasingly attractive to some investors. In our view, the rate-driven drag on gold may be lower going forward for three reasons:
- investors now appear to have priced in rising rates (Chart 3)
- investors’ sensitivity to rate hikes seems to have fallen (Chart 4)
- bond market forward expectations signal falling rates over the next 6-18 months.15
Chart 3: Fed and market implied expected terminal Fed funds rate converging
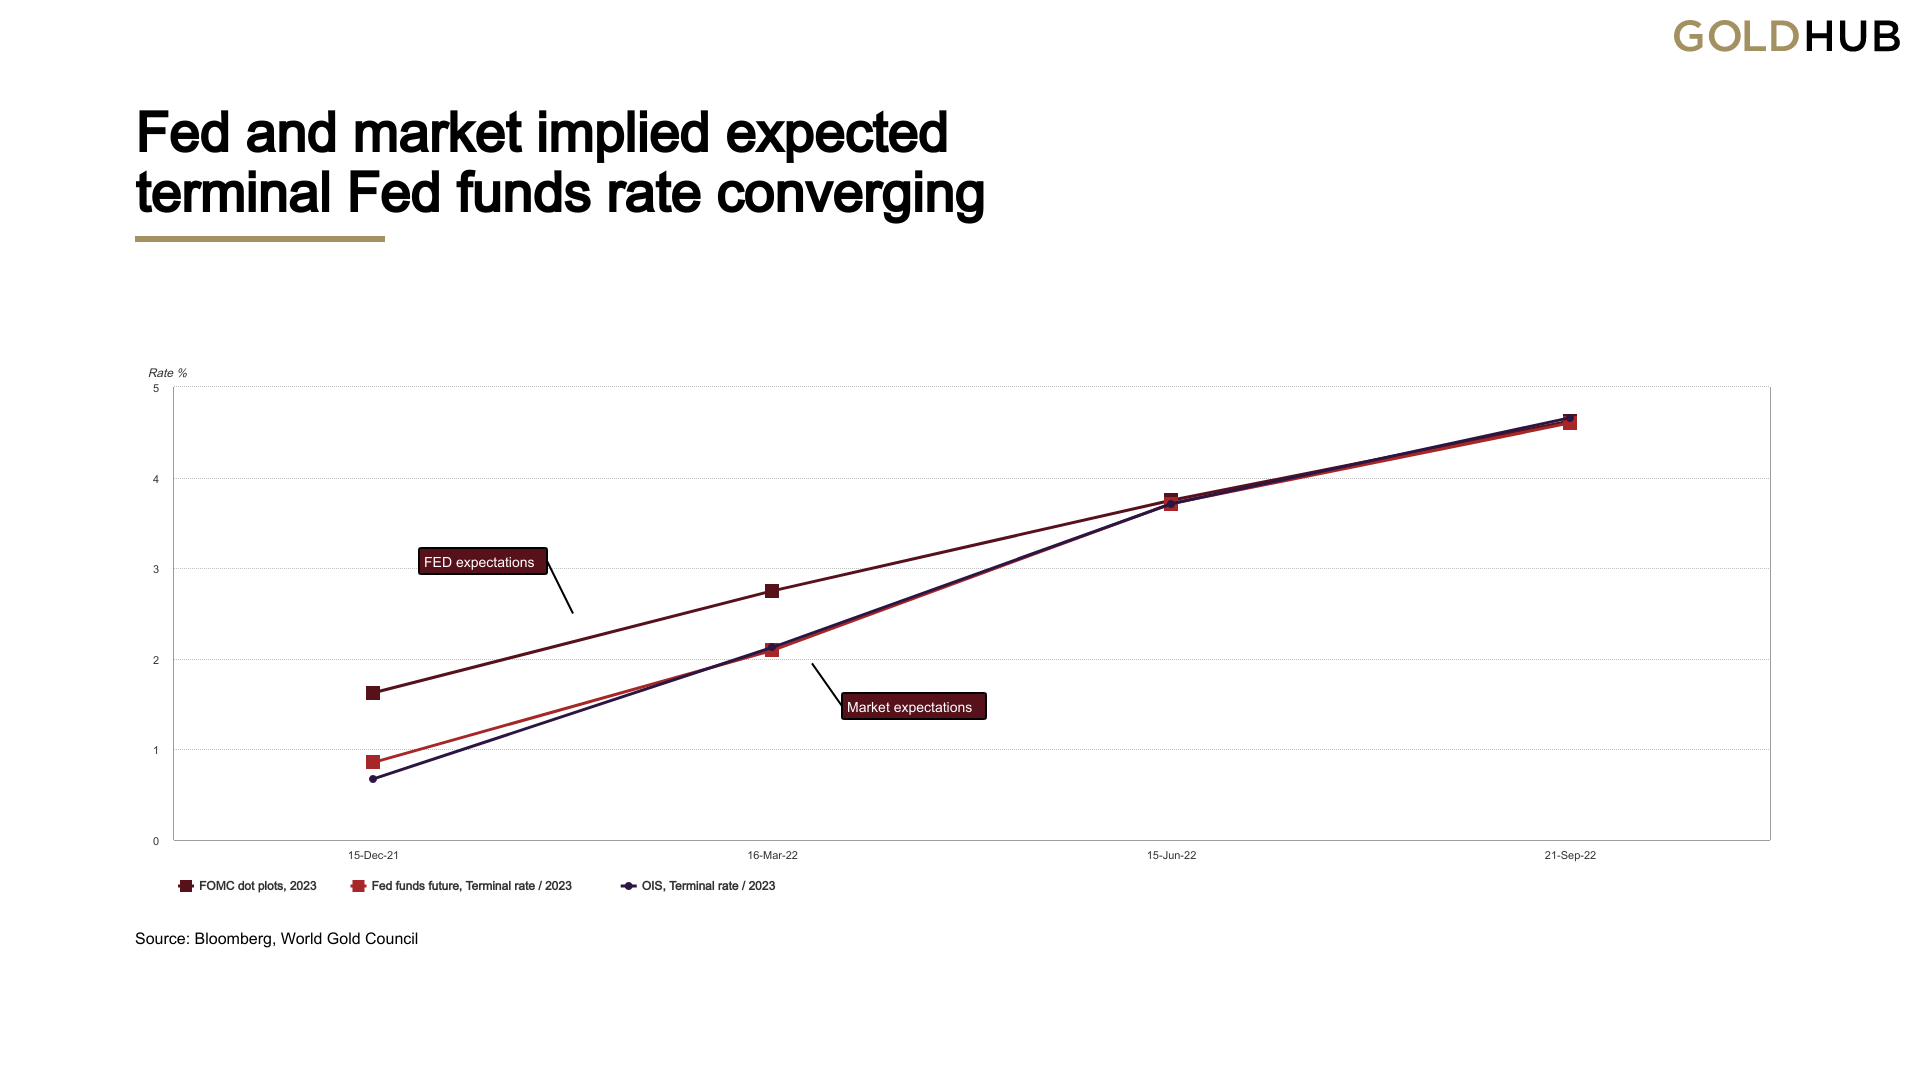 Sources: Bloomberg, World Gold Council; Disclaimer |
In summary…
We think the dollar will be a key driver of gold prices over the next few months and see risks to dollar strength primarily from valuation, positioning and further central bank intervention – which would be gold supportive, in our view. In addition, it appears that gold investors now view policy rate rises as less of a threat to gold than before. They appear to have accepted Fed hawkishness and its terminal rate forecast. In addition, their sensitivity to Federal Market Open Committee (FOMC) announcements has fallen and the growing yield curve inversion and forward rate expectations signal a consensus expectation for lower rates ahead.
Chart 4: Investors appear increasingly more accepting of Fed hawkishness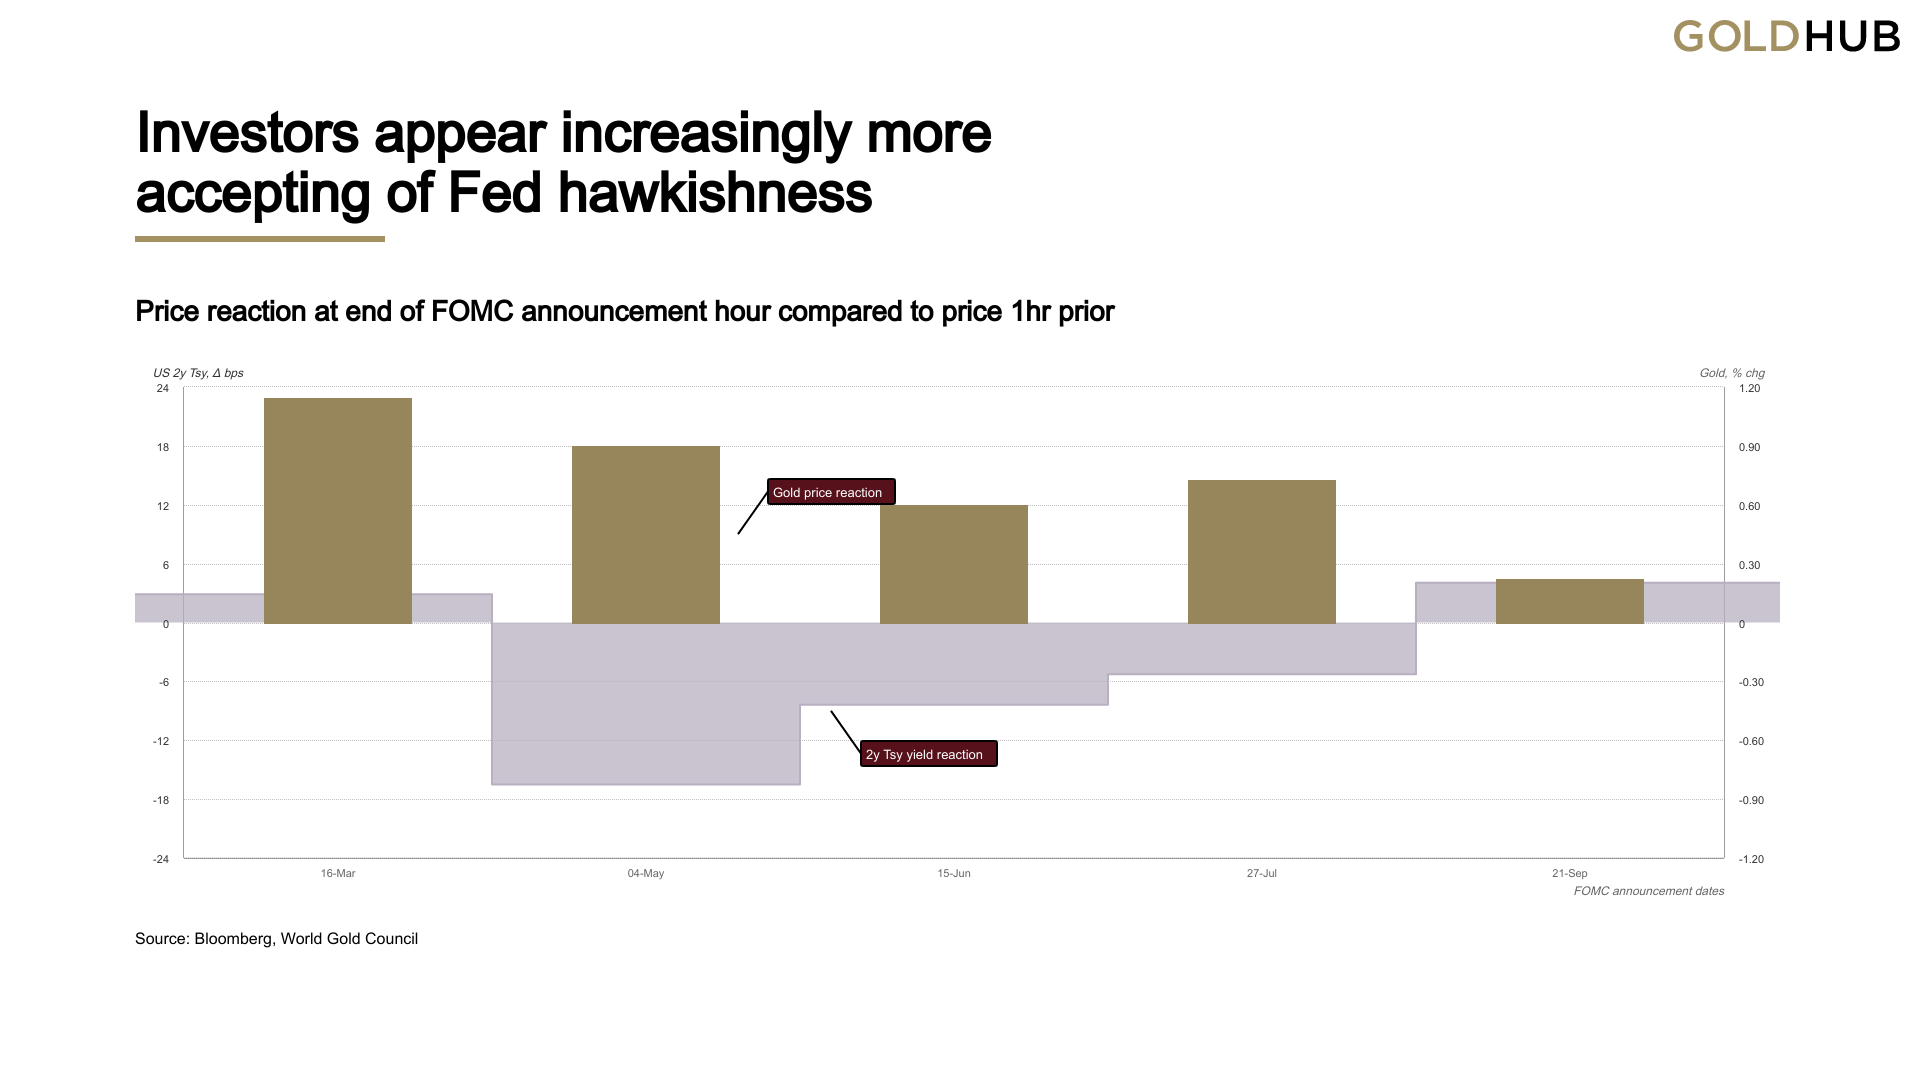 Sources: Bloomberg, World Gold Council; Disclaimer |
Chart 5: Gold has outperformed most asset classes in September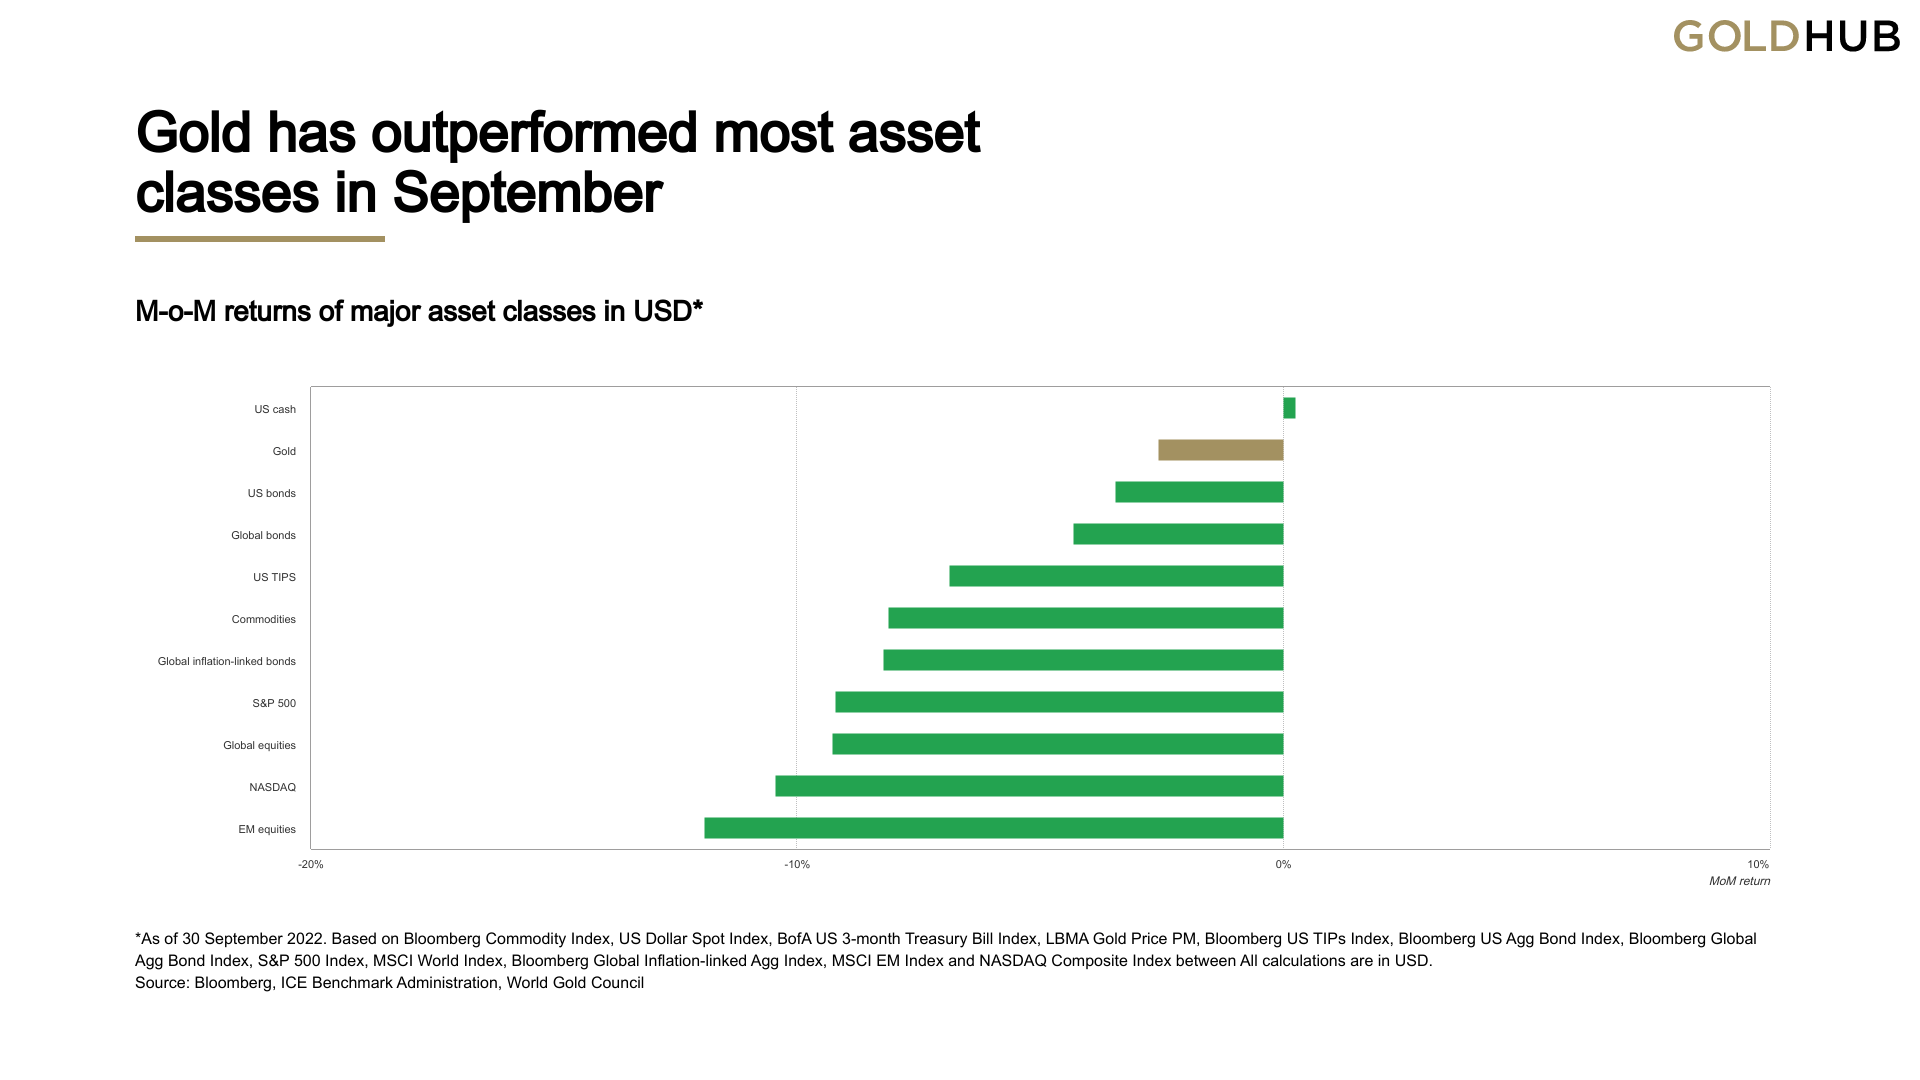 Sources: Bloomberg, ICE Benchmark Administration, World Gold Council; Disclaimer *As of 30 September 2022. Based on Bloomberg Commodity Index, US Dollar Spot Index, BofA US 3-month Treasury Bill Index, LBMA Gold Price PM, Bloomberg US TIPs Index, Bloomberg US Agg Bond Index, Bloomberg Global Agg Bond Index, S&P 500 Index, MSCI World Index, Bloomberg Global Inflation-linked Agg Index, MSCI EM Index and NASDAQ Composite Index between All calculations are in USD. |
Regional insights
China: In September, a 26% m-o-m rise in the average daily trading volumes of Au9999 (the physical gold contract traded on the Shanghai Gold Exchange) sends a positive signal about local gold demand. The surging local gold price premium during the month also reflected robust gold demand. Replenishment by manufacturers ahead of the National Day Holiday in early October – a traditional sales boost for gold products – might be a vital driver.
India: Retail demand drew support in September from a correction in the local gold price and festival purchases, although was muted during the inauspicious period of Pitru-Paksha. Positive sentiment saw the local market – albeit briefly – jump back into a premium for the first time in four months, before returning to a relatively narrow discount for the rest of the month.
Europe: Severe monetary tightening in the face of continued inflation paints a mixed picture for European gold bar and coin demand. While retail investors tend to favour gold’s inflation hedging properties – particularly in the German-speaking markets – the hefty rate rises may act as a brake on demand. The turmoil in UK markets, which saw sterling plummet to multi-decade lows in reaction to the new government’s ‘mini-budget’, reportedly encouraged investors to seek the safety of gold.
US: Combined US Mint gold Eagle and Buffalo coin sales totalled 88,500oz in September (+20% m-o-m, -11% y-o-y), driven by a significant increase in Buffalo sales (Chart 6). Y-t-d gold sales by the US Mint now total 1,267,500oz, 7% higher than the same period last year and the second highest January through September total on record.
Central banks: Central bank gold buying slowed to 20t in August (Chart 7). Turkey’s 9t purchase lifted its gold reserves to a two-year high of 478t. Uzbekistan and Kazakhstan also added to gold reserves, by 9t and 2t respectively. Preliminary data suggests another addition by Qatar, but this is yet to be confirmed by IMF statistics.
ETFs: Global gold ETF holdings declined by 95.4t (US$5.1bn) in September, their fifth consecutive monthly outflow (Table 3). Holdings of 3,548.5t (US$191.1bn) are still up 1.1% ($2.3bn) y-t-d, despite outflows of more than 131.2t ($US39.8bn) since January. Outflows were concentrated among North American- and European-listed funds, driven by continued rate hikes from both the Fed and the ECB. Funds in South Africa and Australia drove minor net outflows from funds in ‘other’ regions. Gold ETFs listed in China remained stable as interests encouraged by the RMB depreciation may have countered the lower gold price volatility.16 17
Chart 6: US Mint sales have reached 22-year highs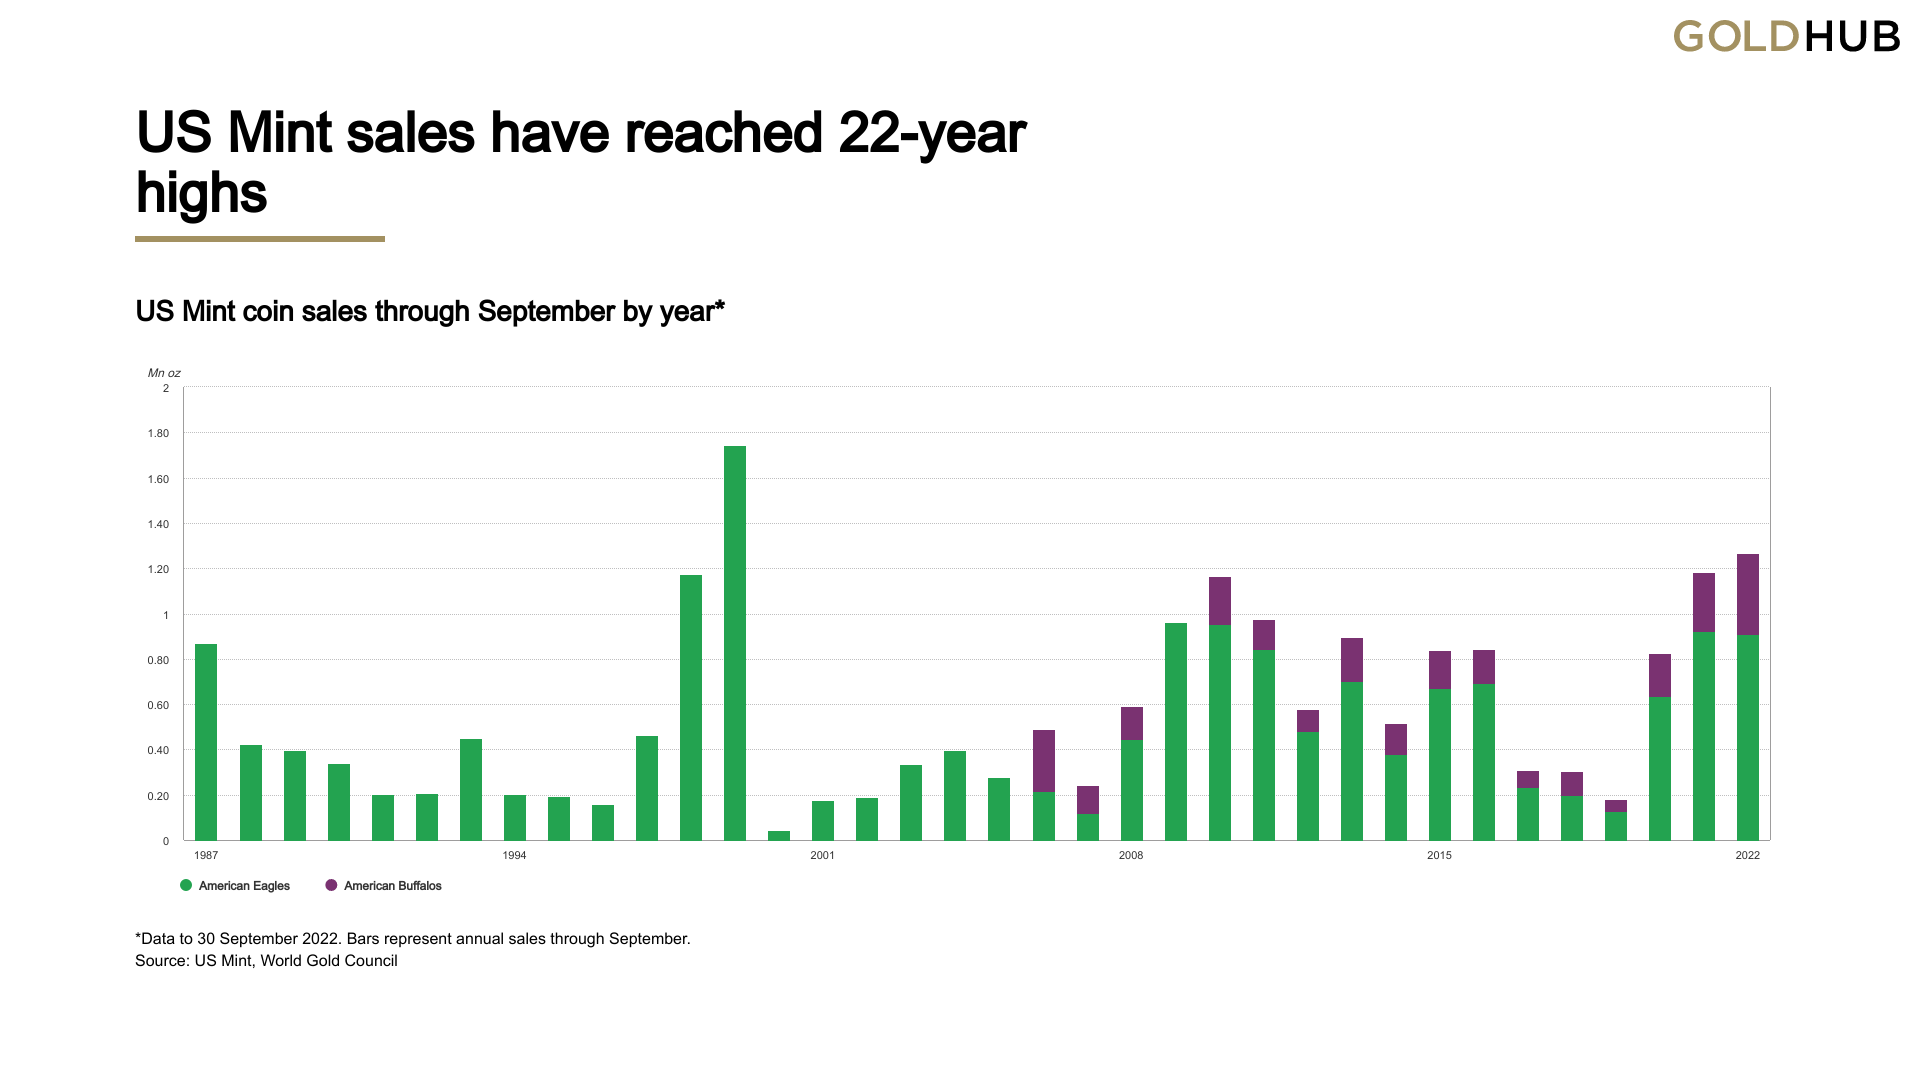 Sources: US Mint, World Gold Council; Disclaimer *Data to 30 September 2022. Bars represent annual sales through September. |
Chart 7: August was the fifth consecutive month of net buying from central banks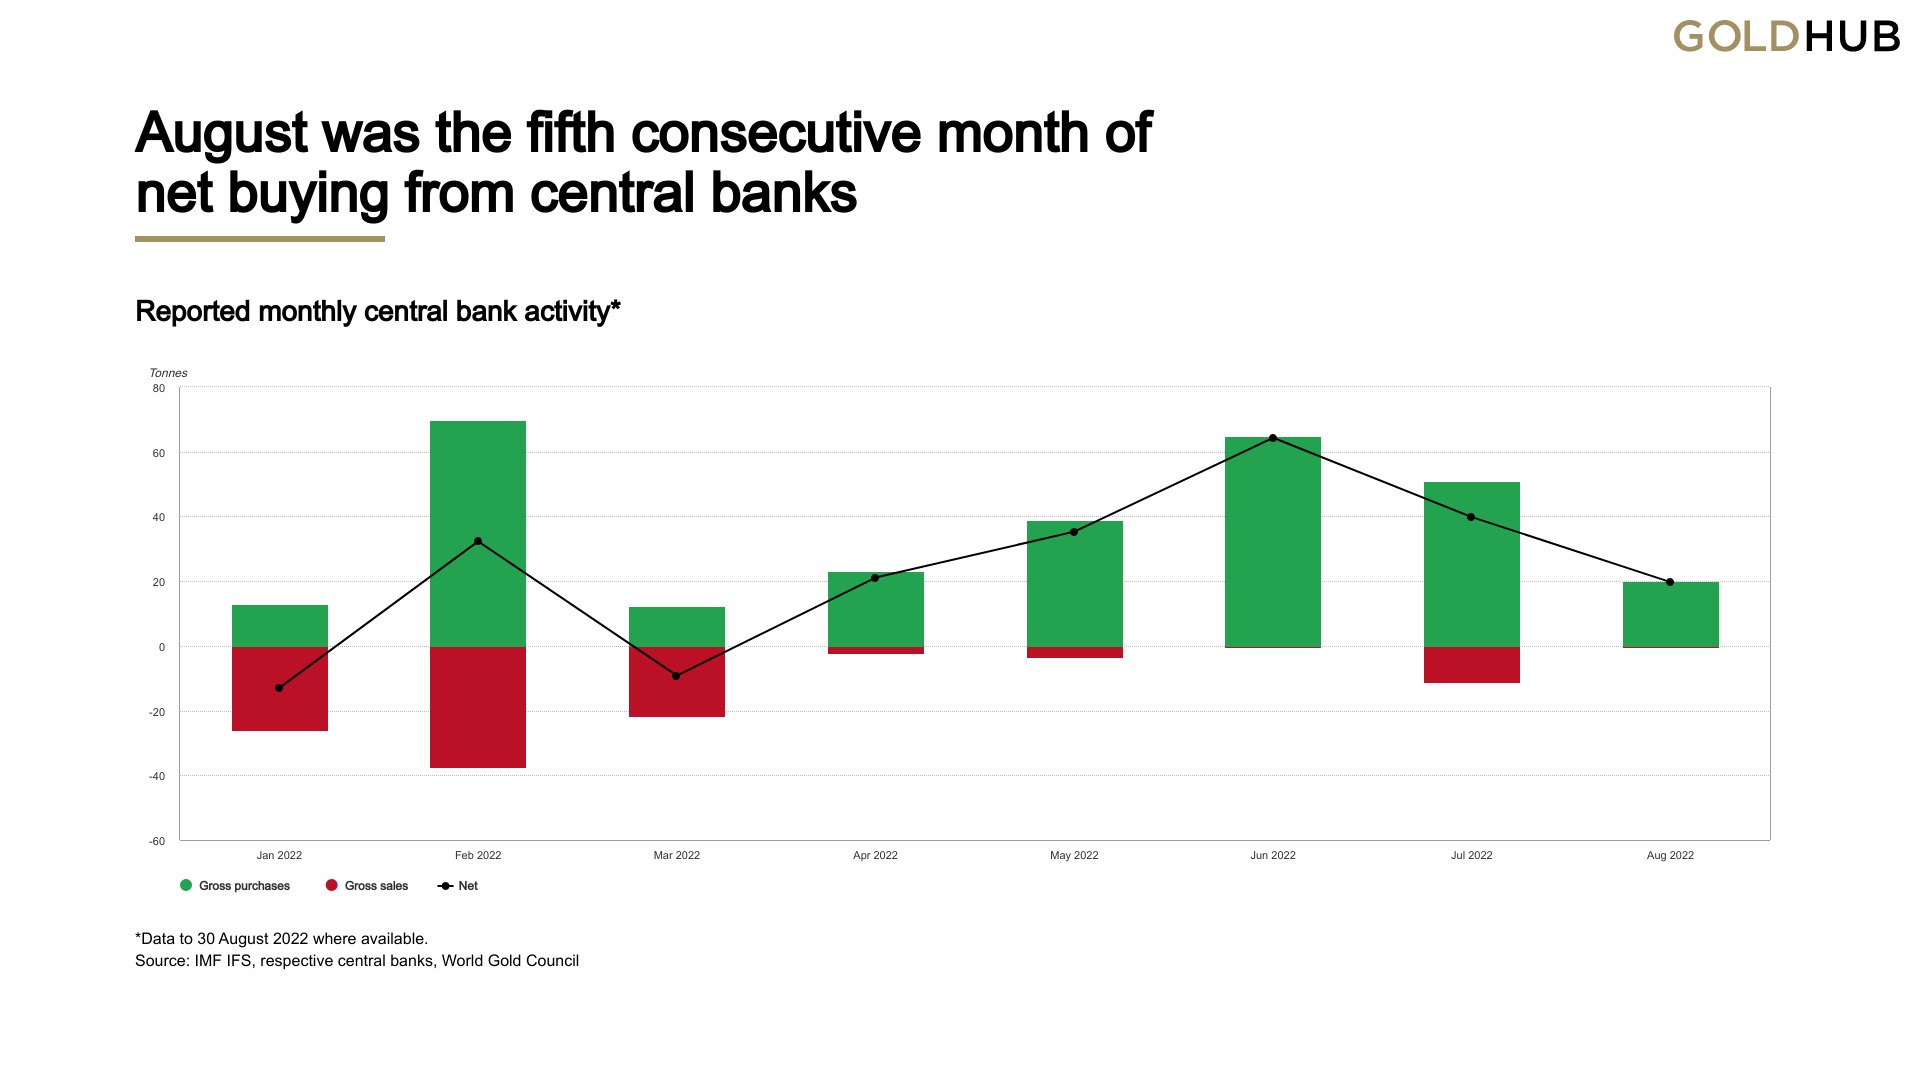 Sources: IMF IFS, Respective central banks, World Gold Council; Disclaimer *Data to 30 August 2022 where available. |
Table 3: Gold ETFs experienced widespread outflows in SeptemberGold ETF flows by region*
*Data to 30 September 2022. On Goldhub, see: Gold-backed ETF flows. Source: Bloomberg, Company Filings, ICE Benchmark Administration, World Gold Council |
Footnotes1 Based on the LBMA Gold Price PM in USD as of 30 September 2022. 2 Based on the intraday low in XAU on 28 September 2022 and LBMA Gold Price PM in USD on 30 September 2022. 3 Trade-weighted basket of currencies against the dollar. Weights as of 30th Sept: EUR (57%), JPY(14%), GBP(12%), CAD(9%), SEK(4%), CHF(4%) 4 Regression model of DXY index as a function of interest rate differentials and FED RRP demand, based on weekly data from 04/09/2020to 30/09/2022. Residuals from the model are stationary (p-value < 0.1) based on an ADF test with constant and with and without trend. Relative interest rates: US 2y Tsy yield less average of German, UK and Japanese 2y Gov’t bond yields. FED overnight RRP liquidity facility (TOMOREPO Index). 5 www.brookings.edu/wp-content/uploads/2022/09/Obstfeld-Zhou-Conference- Draft-BPEA-FA22.pdf 6 Valuation provided by BIS as REER relative to its 10-year moving average. 7 Valuations can remain high for extended periods and futures only represent a very small proportion of total activity in the FX so in isolation, these indicators should be relied upon with caution. 8 DXY net longs fell decisively through 40% in September 2012, July 2013, March 2016, May 2017 and June 2020. The last four saw DXY returns of between -2.9 and -4.8% over the following three months. 9 As of 27 September 2022. Source: Bloomberg 10 US$1.29tr as of August 2022. 11 MLIV Pulse Survey, 3 October 2022. 12 Based on analysis covering an estimation period from February 2007 to September 2022. 13 Equities with foreign cash-flow or commodity-linked exposure would benefit most 14 Japan remains the largest foreign holder of US Treasuries, but has an estimated US$136bn held in cash. 15 Fed funds futures signal that investors expect the Fed’s policy rate to peak in March 2023, and drop thereafter 16 All value figures based on the LBMA Gold Price PM as of 30 September 2022. 17 We regularly review the global gold-backed ETF universe and adjust the list of funds and holdings based on newly available data and information. |
Editor’s Note: The summary bullets for this article were chosen by Seeking Alpha editors.
Be the first to comment