

plastic_buddha
Introduction
Note: Galiano Gold (NYSE:GAU) currently operates and manages the Asanko gold mine or AGM, located in Ghana, West Africa, jointly owned with Gold Fields (GFI). Also, Galiano Gold owns the Asumura project indicated below.
Note: Galiano is the joint venture operator and currently receives an annual service fee from the JV of $7.1 million. Gold Fields Limited owns a 45% equity interest in the AGM JV, with the Government of Ghana owning a 10% free‐carried interest.
Note: I have followed GAU quarterly since 2021. This new article is a quarterly update of my article published on June 17, 2022.
GAU Galiano Gold at a glance 3Q22 (GAU Presentation)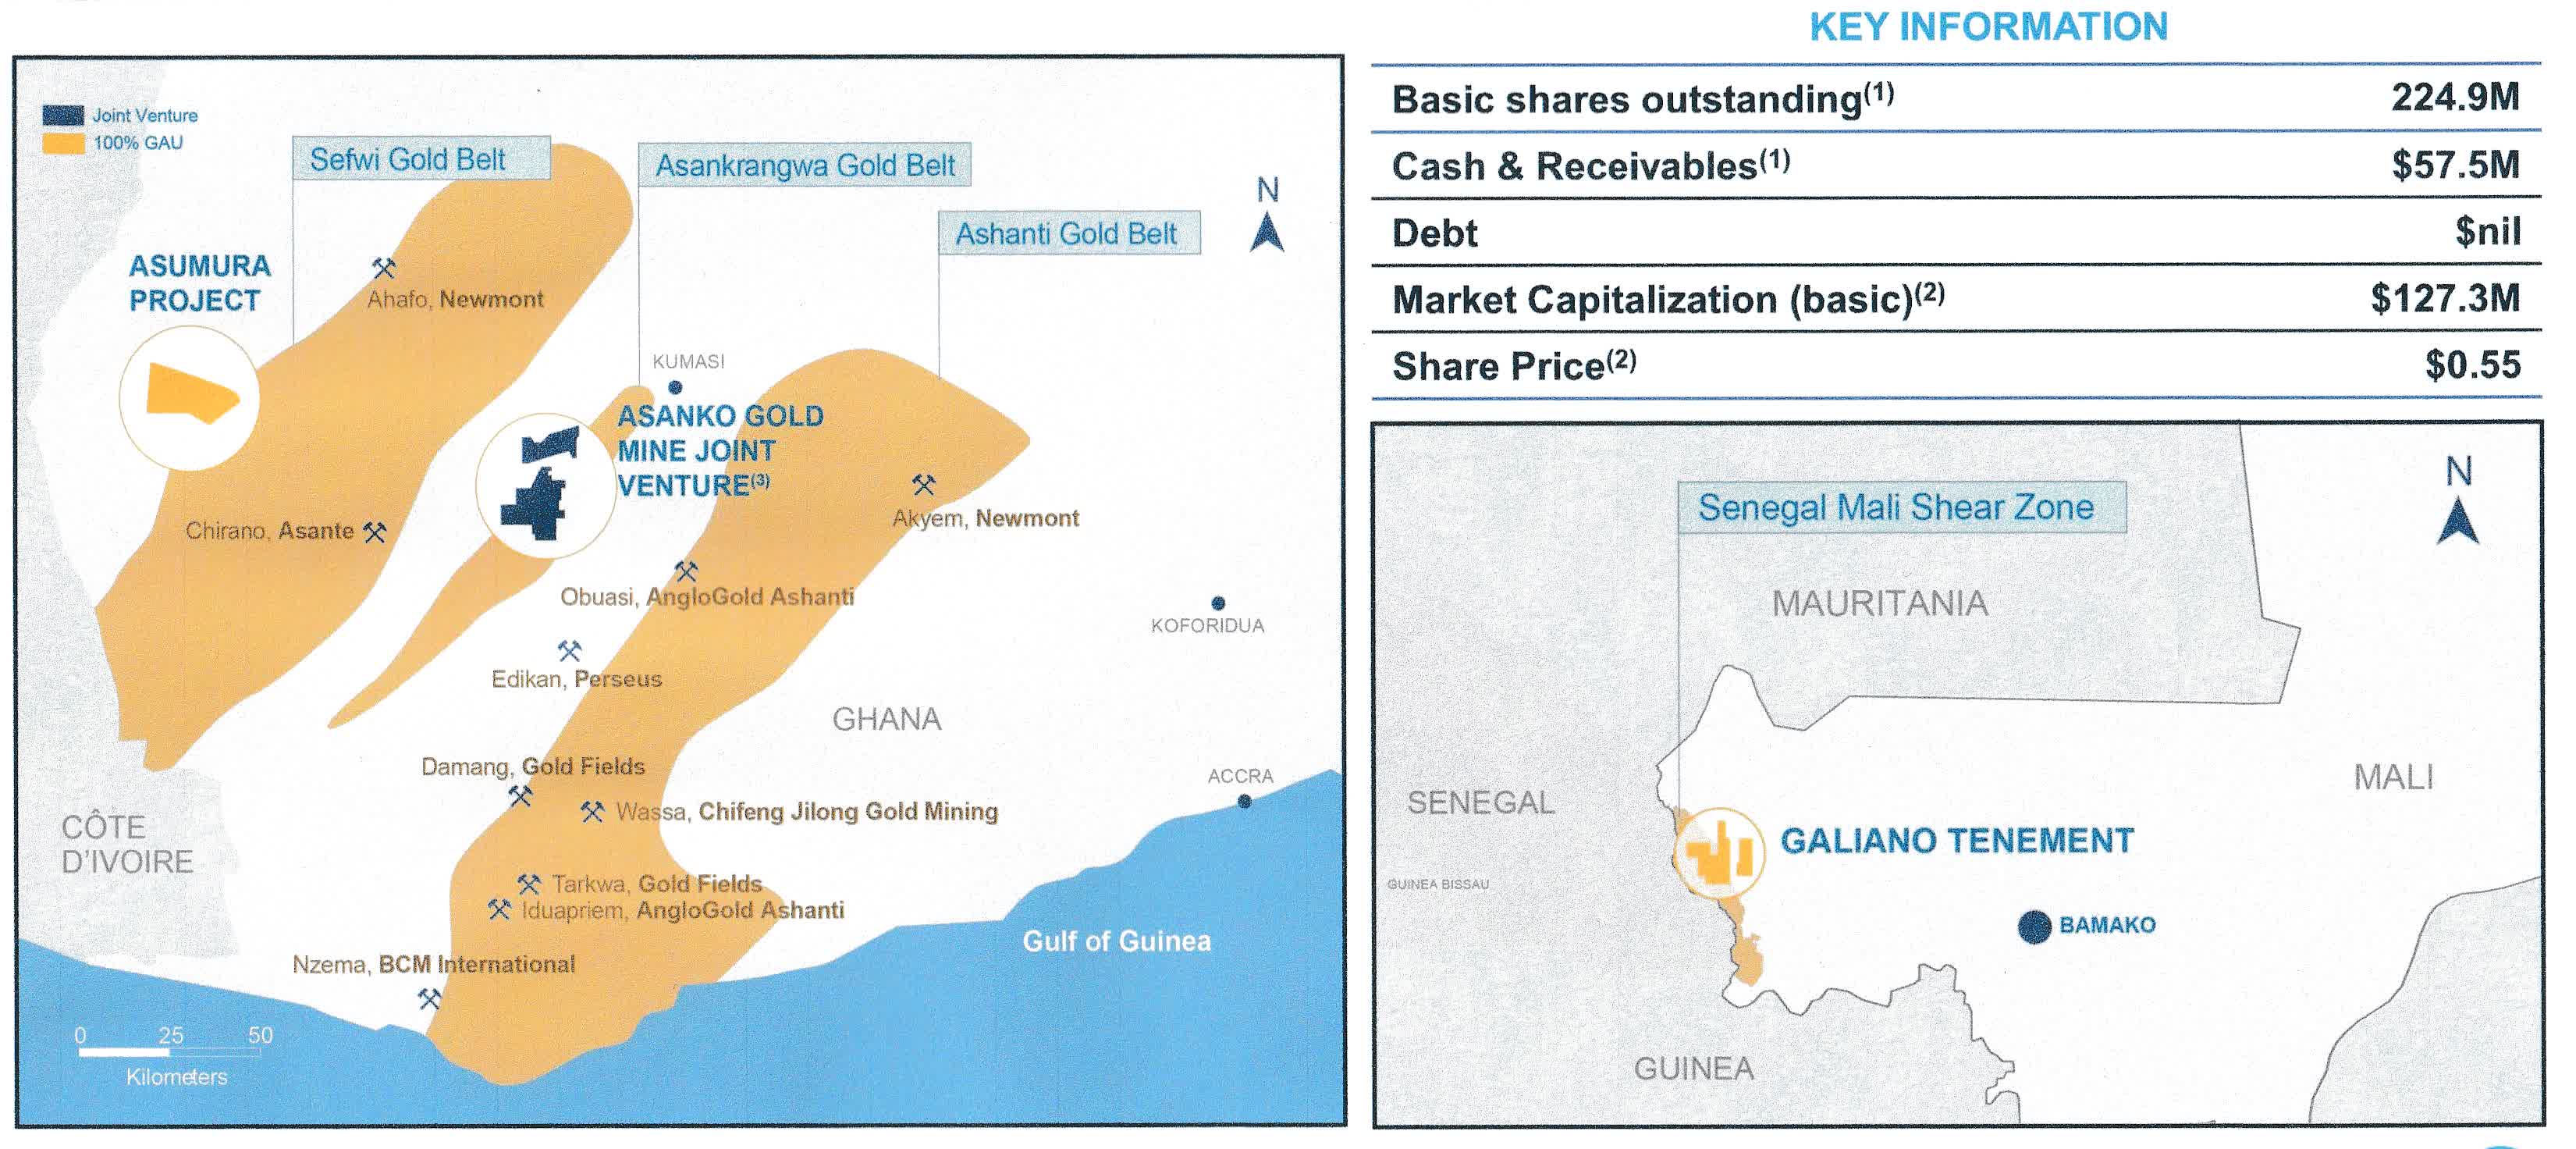
On November 9, 2022, Galiano Gold reported financial results for the third quarter of 2022.
1 – 3Q22 Results Snapshot
GAU 3Q22 Highlights (GAU Presentation)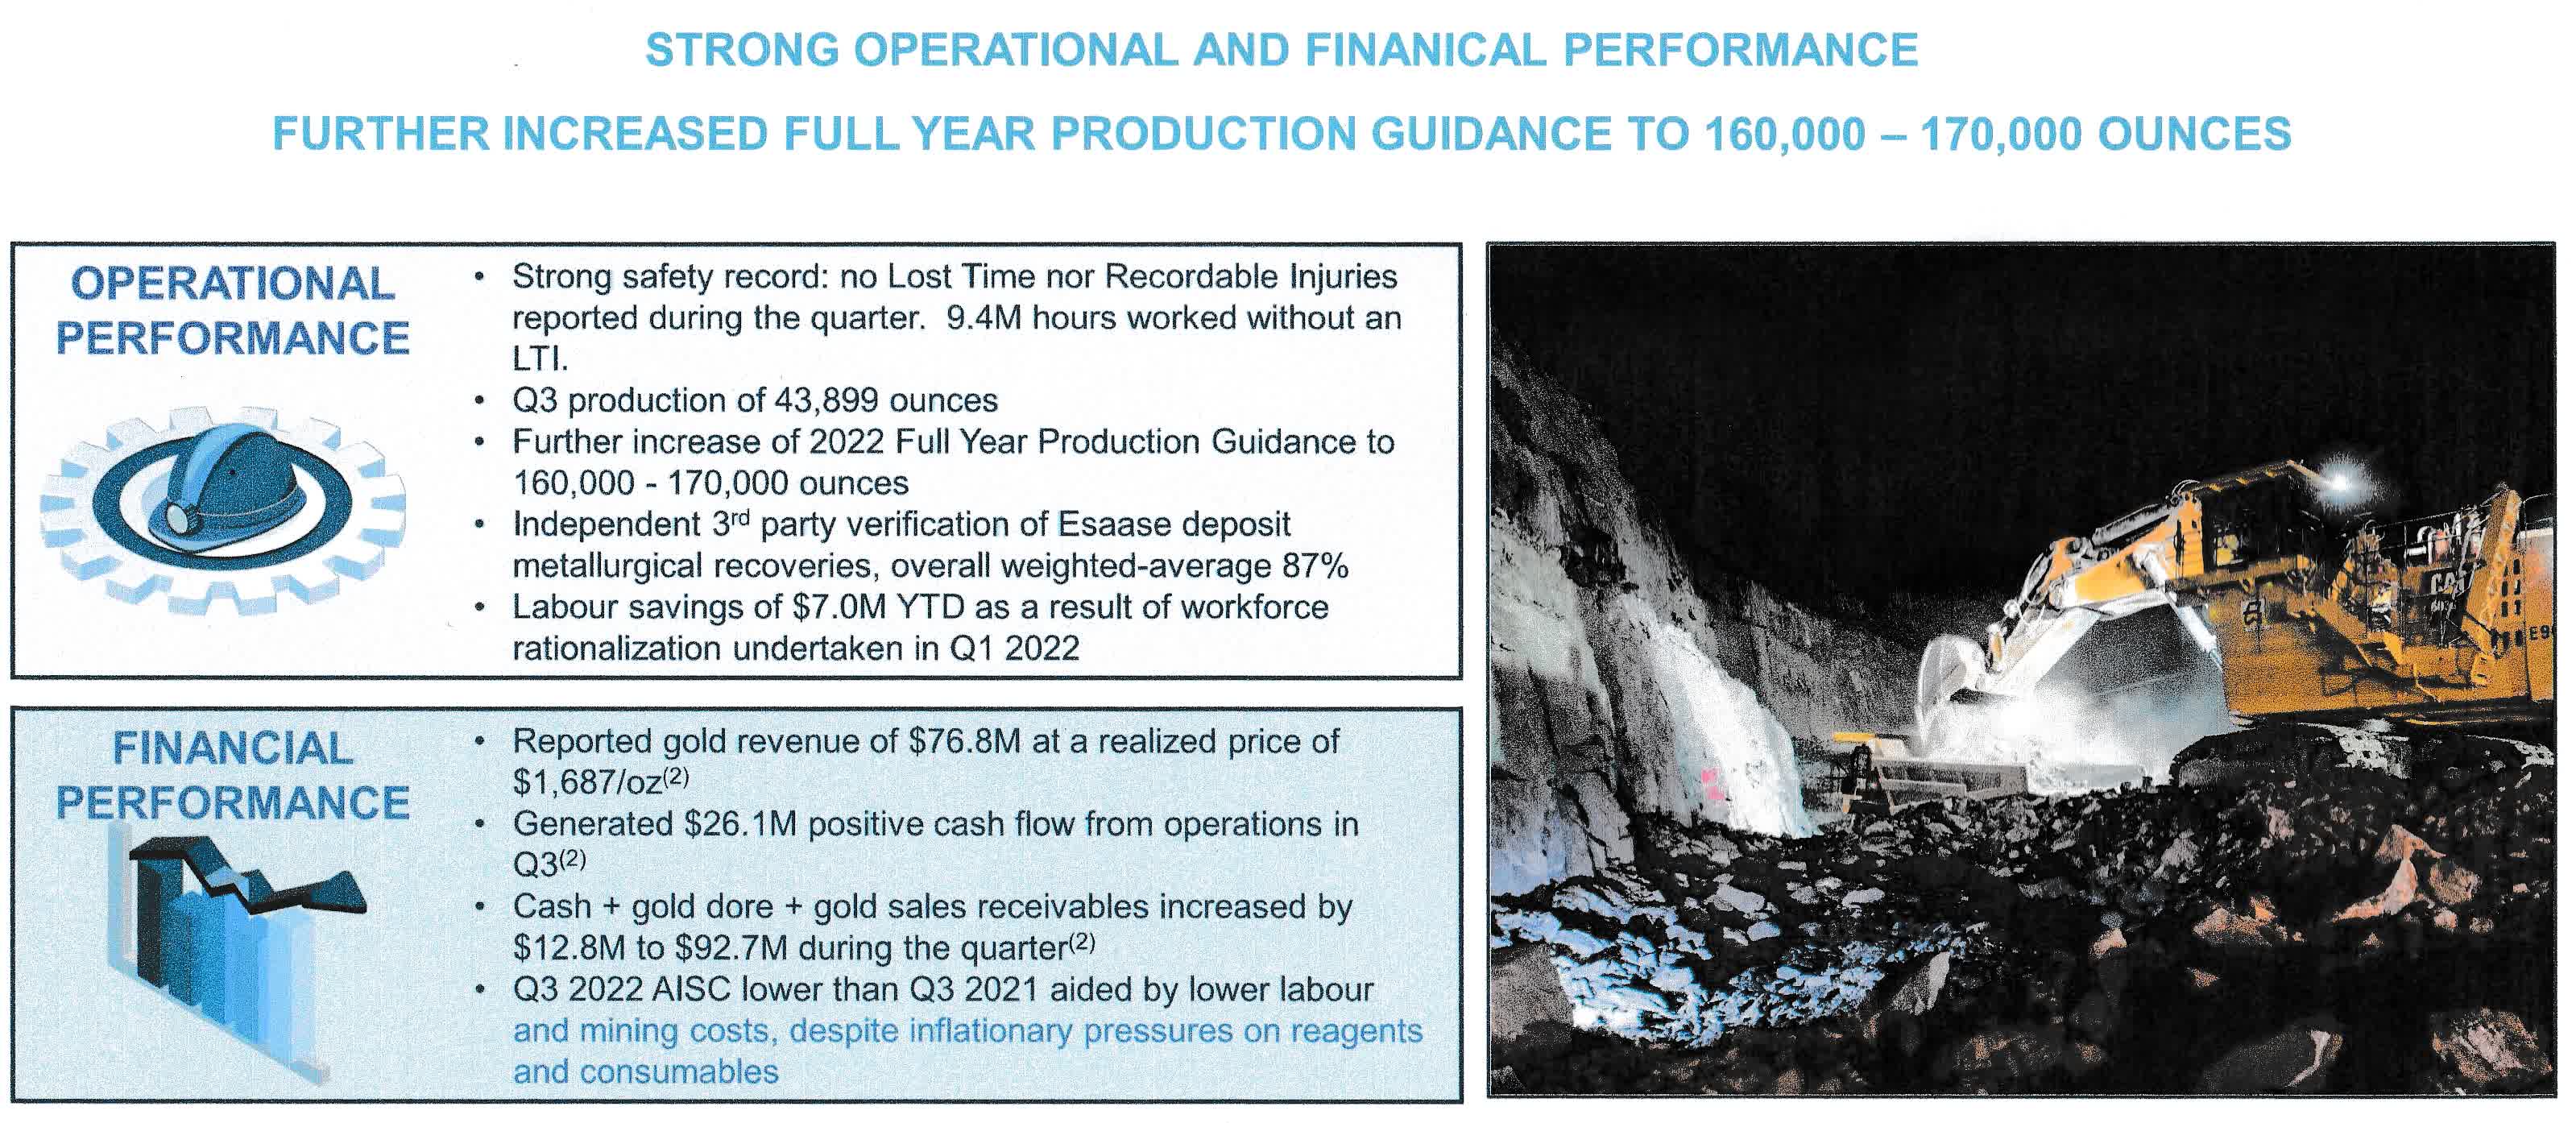
Galiano Gold reported that gold production at the Asanko gold mine in Ghana (“AGM”) was 43,899 ounces during 3Q22, down 11.4% from 49,543 ounces produced in 3Q21. The Year‐to‐date production of 136,252 ounces encouraged the company to further upward guidance to 160K to 170K ounces for 2022.
Following continued outperformance of stockpile grades processed and recoveries achieved, production guidance is again being revised upwards to between 160,000 to 170,000 ounces of gold production in 2022 (originally 100,000 to 120,000 ounces and revised upwards to 140,000 to 160,000 ounces in Q2 2022).
At prevailing gold prices as of Q3 2022 and the midpoint of 2022 further revised production guidance (165,000oz), management expects the AGM to generate positive operating cash flows of approximately $90 million (previously $60 million) in 2022. From Press release.
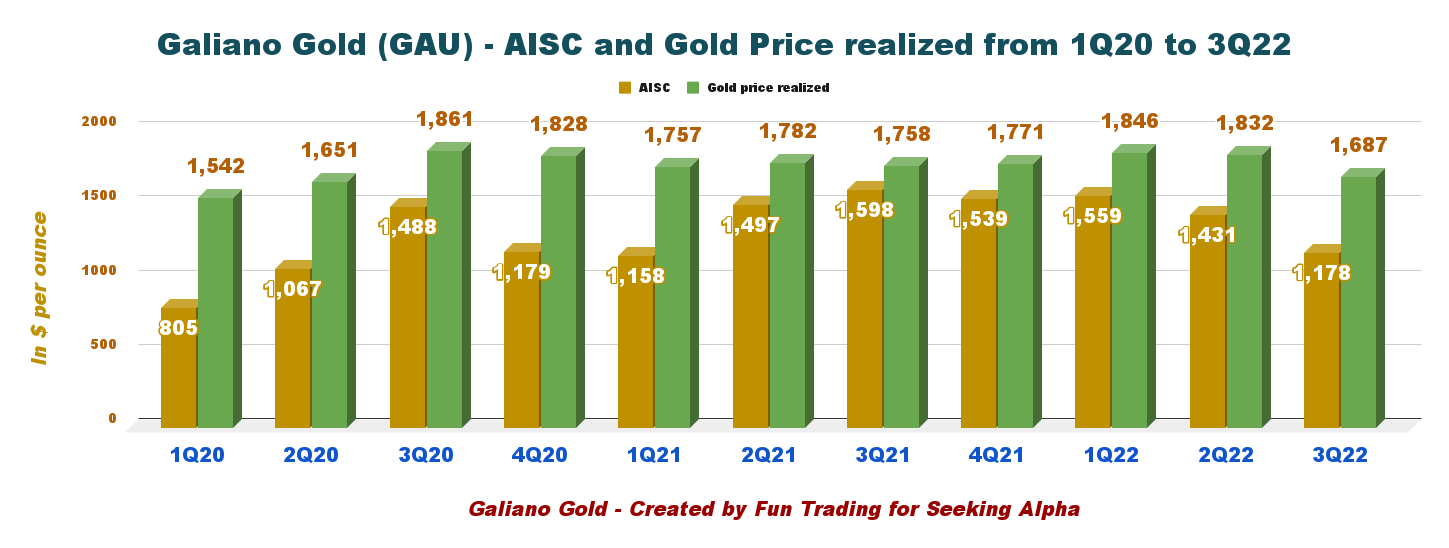
Total cash costs per ounce were $1,001, and all-in-sustaining costs (“AISC”) were $1,178/oz during the quarter.
The company reported a net income of $1.28 million during the quarter.
2 – Stock Performance
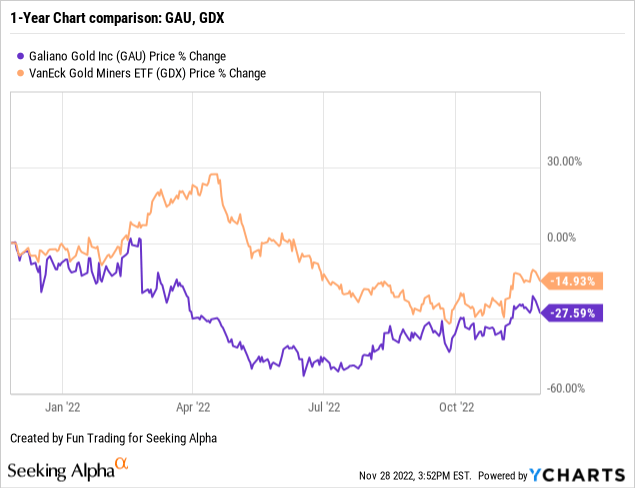
Galiano Gold has significantly underperformed the VanEck Gold Miners ETF (GDX) and is now down 28% on a one-year basis.
3 – Investment Thesis
I believe the sole interest here is to use GAU as a trading tool.
On the positive side, the company revised its 2022 gold production and significantly reduced the quarterly AISC in 3Q22 despite inflationary pressures.
Also, insiders, notably the independent chairman Paul Wright, are buying GAU regularly, which is an encouraging sign.
Finally, Gold fields could acquire Galiano Gold’s 45% stake in the JV after ending its takeover deal with Yamana Gold (AUY) on November 8, 2022.
Thus, I recommend trading LIFO for about 60% of your overall position but keeping a small long-term position for a future acquisition offer in an all-share deal in 2023.
Galiano Gold – 3Q22 Balance Sheet. The Raw Numbers
Note: The Joint Venture is split 50/50 for the 90% economic interest, with Ghana Government holding 10%. Therefore, Galiano Gold owns 45% of the Joint Venture.
| Galiano Gold | 2Q21 | 3Q21 | 4Q21 | 1Q22 | 2Q22 | 3Q22 |
| Total Revenues $ million (100% basis) | 95.20 | 85.28 | 91.08 | 75.53 | 84.89 | 76.91 |
| Quarterly Earnings in $ million | 5.00 | 4.12 | -91.03 | -1.54 | 12.57 | 1.28 |
| EBITDA $ million | 5.06 | 4.17 | -91.01 | -1.49 | 12.61 | 1.32 |
| EPS (diluted) $ per share | 0.02 | 0.02 | -0.41 | -0.01 | 0.06 | 0.01 |
| Operating Cash Flow $ million | -3.13 | -2.84 | -2.29 | -3.17 | 2.57 | 1.54 |
| CapEx in $ million | 0.00 | 0.00 | 0.03 | 0.00 | 0.00 | 0.00 |
| Free Cash Flow in $ million | -3.14 | -2.84 | -2.30 | -3.17 | 2.57 | 1.54 |
| Total cash in $ million (100% basis) | 58.55 | 55.84 | 53.52 | 50.38 | 53.01 | 54.72 |
| Total LT Debt (incl. current) in $ million | 0.00 | 0.00 | 0.00 | 0.00 | 0.00 | 0.00 |
| Shares Outstanding (diluted) in millions | 225.29 | 225.07 | 224.95 | 224.94 | 224.94 | 224.94 |
Source: Company release M&A. Fun Trading files.
* Indicated by the company
Analysis: Revenues, Free Cash Flow, Debt, And Gold Production
1 – Quarterly revenues were $76.91 million in 3Q22 (100% basis)
GAU Quarterly balance sheet history (Fun Trading) Galiano Gold announced that 3Q22 gold revenue was $76.911 million (on a 100% basis) based on 45,482 ounces sold at an average gold realized price of $1,687 per ounce. Net income in 3Q22 was $1.28 million, or 0.01 per diluted share.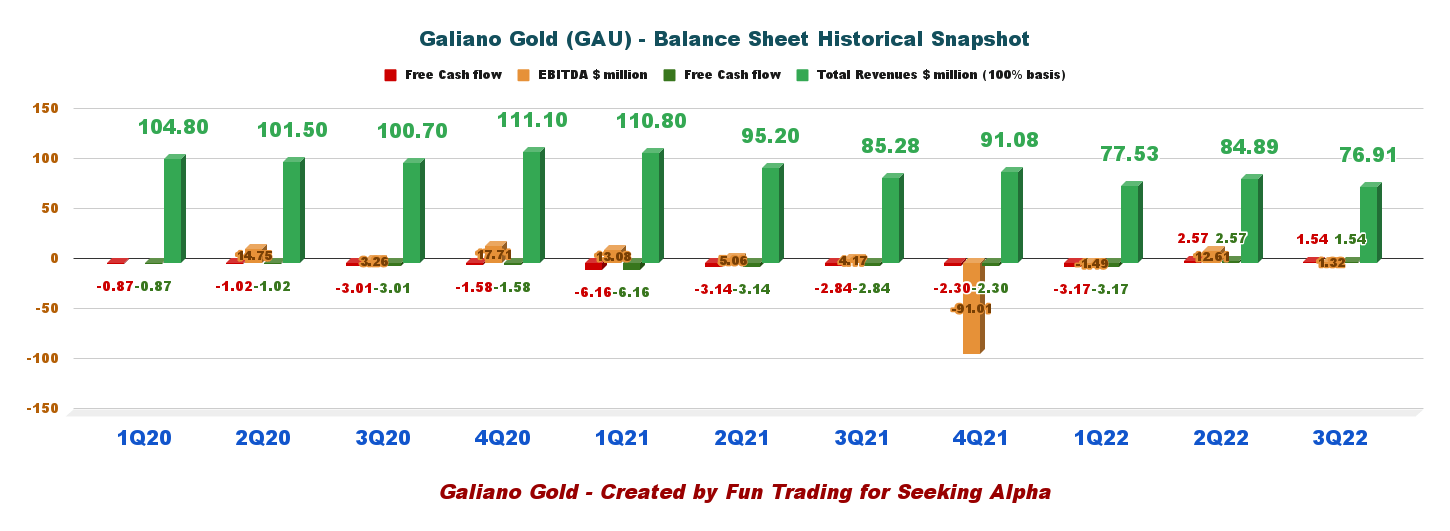
2 – Free Cash Flow was $1.54 Million In 3Q22
Free cash flow is cash flow from operations minus CapEx. Trailing 12-month (TTM) free cash flow was a loss of $1.36 million, with a gain of $1.54 million in 3Q22.
3 – No Debt in 3Q22 and Total Cash of $54.716 Million
GAU Quarterly Total cash history (Fun Trading) The chart above shows that the cash position has increased again this quarter. Galiano had $54.716 million in cash on hand and no debt as of September 30, 2022. In October 2019, the JV entered into a $30.0 million RCF with Rand Merchant Bank. During the period, the maturity date of the RCF was extended to September 30, 2023 (with utilization subject to credit review) and the AGM will pay a facility maintenance fee of 0.70% per annum. As at September 30, 2022, the balance drawn under the RCF was nil (December 31, 2021 – nil).
4 – Quarterly Gold Production Analysis
Galiano Gold reported that gold production at the Asanko gold mine in Ghana was 43,899 ounces during 3Q22 and sold 45,482 ounces. The processing plant achieved a milling throughput of 1.4 Mt of ore at a grade of 1.1g/t and metallurgical recovery averaging 88%. The AGM continued to achieve a significant improvement in recoveries from 1Q22.
During Q3 2022, the AGM processed 1.3 Mt of stockpiled material to supplement mill feed from the Akwasiso pit. Processing cost per tonne for Q3 2022 was $10.45 compared to $9.68 during 3Q21, an increase of 8%.
GAU Quarterly Gold Production history (Fun Trading) GAU Quarterly AISC and Gold price history (Fun Trading)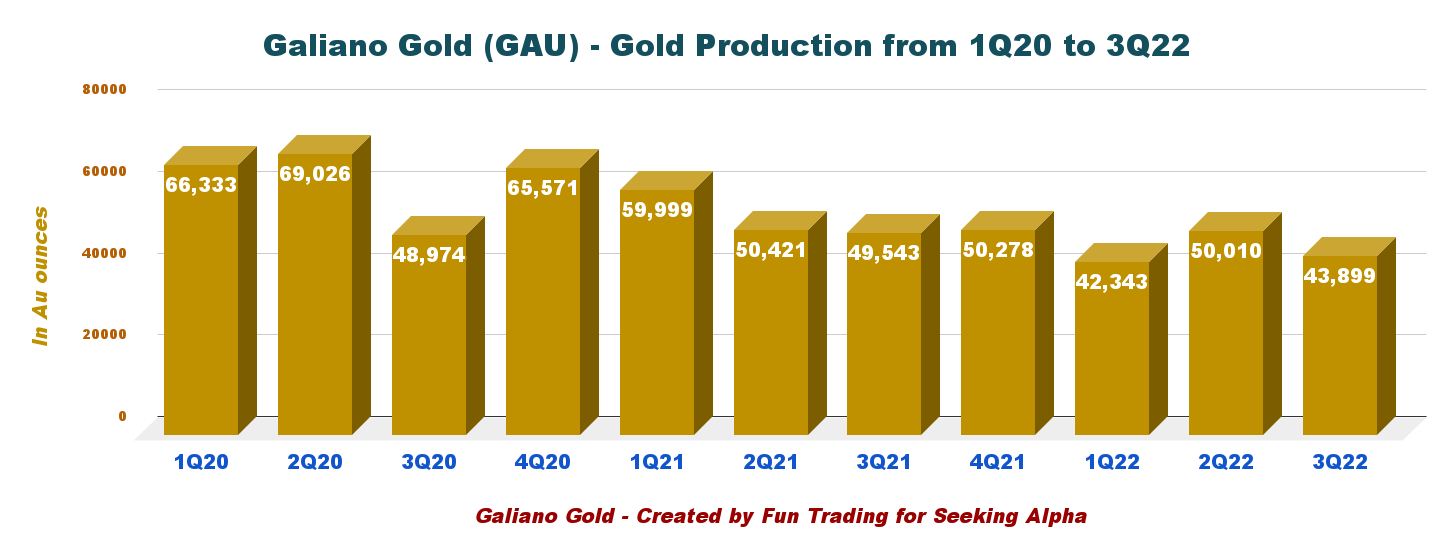
5 – Galiano Gold Provided An Updated AGM Mineral Resources
Mineral resource measured and indicated is now 2.904 Moz.
GAU Mineral resources February Presentation (GAU Prior presentation)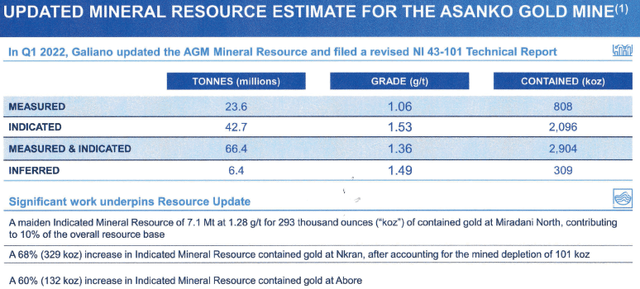
Galiano Gold expects to update the Life of Mine Plan (LOM), Mineral Resource, and Mineral Reserves Technical work in 1Q23.
The company is advancing exploration:
- 36 km of exploration and resource conversion drilling was made at the AGM in 2022
- Advancing Midras through additional drilling and further investigation
- Asumura drilling is expected to commence in Q4 2022
Technical Analysis And Commentary
GAU TA Chart short-term (Fun Trading StockCharts)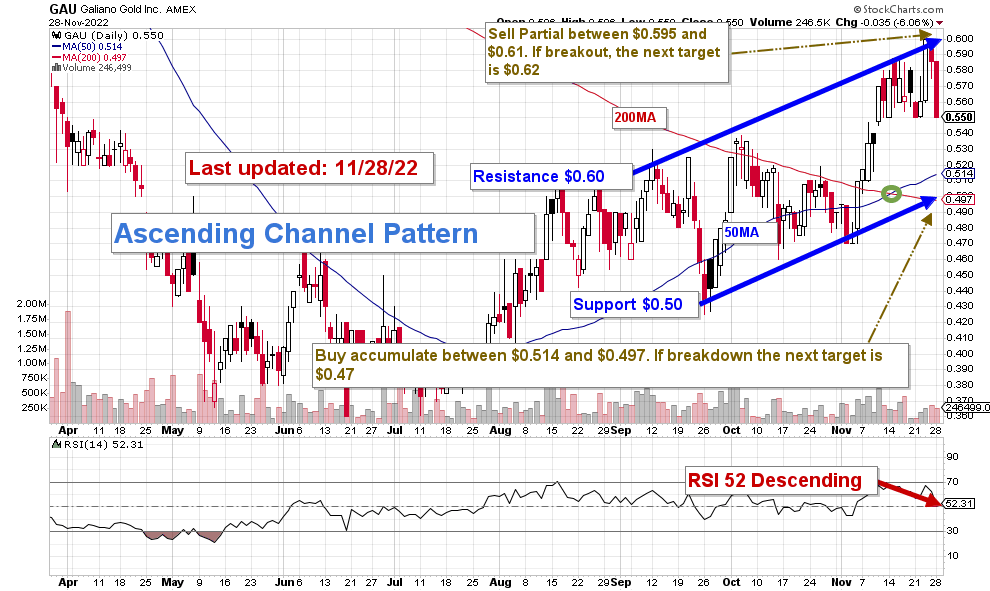
GAU forms an ascending triangle pattern with resistance at $0.60 and support at $0.50. Ascending channel patterns are short-term bullish moving higher within an ascending channel, but these patterns often form within longer-term downtrends as continuation patterns.
The trading strategy is to sell partially between $0.595 and $0.61 with possible upper resistance at $0.62 and buy/accumulate between $0.514 and $0.497 with possible lower support at $0.47, whichever comes first.
Gold may turn bearish if the Fed hikes 75 points on December 14. In this case, GAU may drop as low as $0.47. We still await a 50 or 75 points hike in December and many more hikes in 2023 to fight rampant inflation.
Thus, I recommend trading LIFO for about 60% of your total position and keeping a tiny core long position for a test of $1-$1.50.
Watch the gold price like a hawk.
Warning: The TA chart must be updated frequently to be relevant. It is what I am doing in my stock tracker. The chart above has a possible validity of about a week. Remember, the TA chart is a tool only to help you adopt the right strategy. It is not a way to foresee the future. No one and nothing can.
Author’s note: If you find value in this article and would like to encourage such continued efforts, please click the “Like” button below to vote for support. Thanks.
Be the first to comment