

Talaj/iStock via Getty Images
Guggenheim Strategic Opportunities Fund: An Income Investor’s Friend
I am a big fan of Guggenheim Strategic Opportunities Fund (NYSE:GOF) as a way to add income to any portfolio. Because of its ~13% yield, one can easily create the desired yield by ratcheting up or down exposure to it. The fund’s solid track record of distributions, the high yield, and its fairly predictable trading range make this fund an easy pick for me when building out my income portfolio.
Structure
The first thing to consider is that GOF is a closed-end fund (CEF), not an exchange-traded fund (ETF), and the two are very different. One way they’re different is expenses. CEFs are typically much more expensive. Expensive ETFs are still typically less than 1% in expense ratio, but GOF comes in at a whopping 1.74% as advertised on their website . That does include the interest expense of GOF’s leverage, though. So the actual expense ratio will bounce around based on leverage and rates. The expense ratio before interest is 1.50%, according to Guggenheim. It’s worth noting that the 1.74% figure Guggenheim quotes is from November 2021, before rates went vertical. It’s certainly not cheap, but CEFs tend to be pricey. According to the Fidelity CEF screener, the market median is 1.53%, and CEFs range from 1.1% to 2.7%.
Another way that CEFs differ from ETFs is that CEFs will trade away from their Net Asset Value, or NAV. CEFs IPO with a set number of shares and then trade on the open market going forward. The CEF issuer doesn’t issue new shares, and it doesn’t buy or sell securities based on the demand for the fund itself. This means that a CEF will trade on the open market at a potentially different price than the underlying assets (i.e. NAV). A CEF with market price lower than NAV is considered to be trading at a discount. The converse is true, too: a CEF trading for more than its NAV is trading at a premium. GOF almost always trades at a healthy premium. The current premium as of July 20th (all other numbers unless otherwise noted are from June 30th) is 16.51%. For context, the average premium for the first half of 2022 was 21.08%, but the average premium since the beginning of 2017 is only 12.07% (data from Yahoo Finance Data Tool). I think of the premium like this: the NAV of the fund dropped 20% in the first half, but because the distribution hasn’t budged, the price of the fund actually held up adequately, all things considered, as it only dropped 12.2%.
Usually, a really high premium would scare me off, but I think the story is different here. GOF has shown that it can keep the distribution payment up regardless of the market environment, so people keep buying it, keeping the price up (despite the underperformance of the underlying assets). I’ll talk more about how GOF keeps the distribution up in the next section, but in my opinion, the way to look at good entry points for GOF is not based on its relative premium or discount, but its price relative to its yield. The reason for that should be clear: this is not a capital appreciation vehicle and you shouldn’t look at it as one. The cheaper you can buy that $0.1821 monthly payout, the better.
Price action
Before buying GOF, you should understand that this is a mailbox money fund, not a capital appreciation vehicle. Of course, if you bought at the bottom in 2020 on March 18 at $11.82, you’d have a nice little 18.5% yield and be up 36% to boot. Those opportunities will not come around often; I’d advise against trying to time this or, really, any fund or stock.
The median price for GOF since 2017 is $20.00 (also its IPO price, coincidentally), and its one standard deviation price bounds are $18.40 and $21.60. At today’s closing price of $15.74, it’s 14% below the 68% confidence interval. Everything has been getting hit in 2022, and GOF is not excluded from that. I am a buyer of most of the market at these levels, especially GOF. As I said above, I am just buying that $0.1821 monthly payout cheaper today than I used to.
Even though the price return is poor, the returns on a DRIP basis are pretty competitive: GOF has a total return for 2020 through the first half of 2022 of 19.1%. SPY, for the same period, has a return of 22.6%. For the first half of 2022, those figures are -6.2% and -16.9%, respectively. Not bad, given the marketing environment we’ve all been trading in thus far.
Distribution
A big yield always raises the question of stability. It’s ill-advised to buy something with an eye-popping yield without understanding why it is that high and whether it’s sustainable.
GOF has never lowered its distribution payout, it has paid a distribution every single month since September 2007, and it has raised the distribution three times (last in 2013). GOF’s monthly payout streak is at 178, and that includes all 24 months in 2008 and 2009. At least from a historical perspective, the distribution is rock solid.
Another way to look at a CEF’s distribution sustainability is to look at its NAV vs distribution. You want to see some stability in the NAV after accounting for the distribution payout. During 2017-2021, GOF paid out $10.93 in distributions and had earnings of $8.65, so NAV dropped $2.28. NAV wasn’t enough to cover all of distributions, but it covered most of it. 2022 has been a different story, and I am keeping my eye on the NAV vs payout dynamic, but I am not worried just yet (source: Yahoo Finance and author’s analysis).
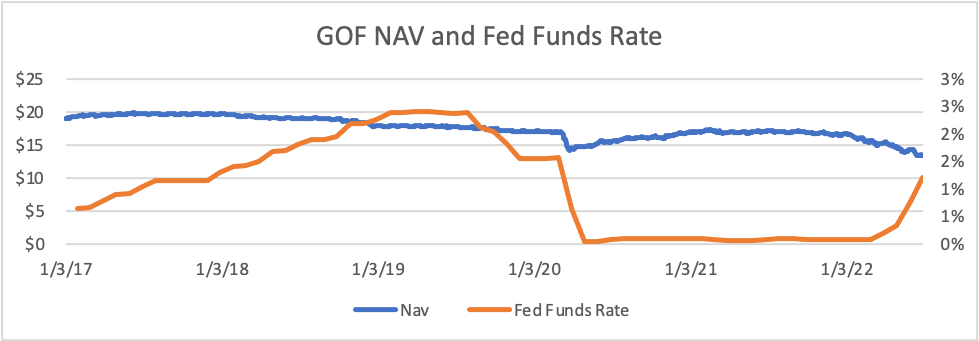
GOF NAV and Price (Yahoo Finance)
Roughly 60% of GOF’s distribution from 2019-2021 was treated as return of capital. This trend appears to be continuing in 2022 (from Guggenheim’s website). The important point is that a fund’s method of paying distributions is not an economic concept, only a taxation one (both earned and unearned distributions can be return of capital). Distributions paid as return of capital lower your tax basis, but they are not considered taxable income the way ordinary dividends are. This defers the year in which taxes are paid on the distribution and potentially lowers taxes to long-term capital gains. For those lucky enough to use this as a main source of income, it is a huge advantage to defer 60% of your income taxes to some unknown future date, potentially after you’ve passed on.
Holdings
You have to be concerned with a debt fund’s interest rate sensitivity, and GOF’s is roughly average for its peer set, at ~3.5 years. GOF’s NAV has correlation to the fed fund’s rate is weakly positively correlated, at 0.21 since the start of 2017.
NAV and Fed Funds Rate Correlation chat (Yahoo Finance and St Louis Fed) GOF NAV vs Fed Funds Rate over time (Yahoo Finance Historical Data and St Louis Fed)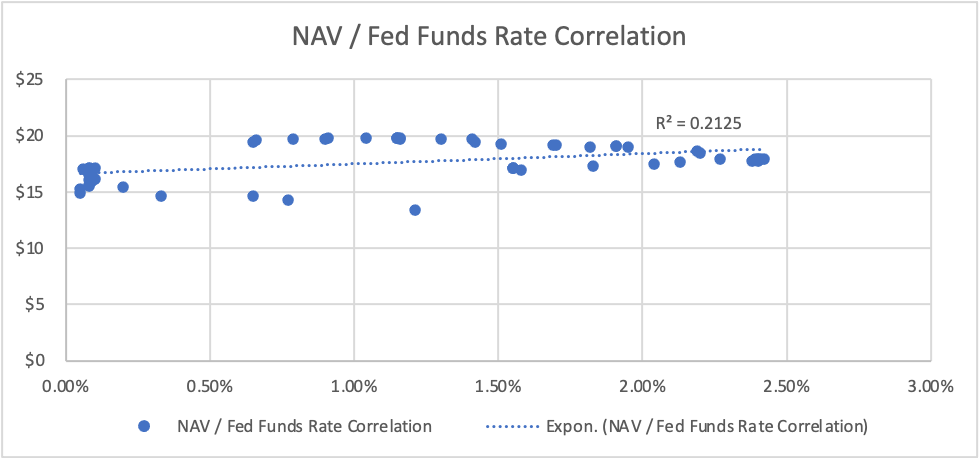
The actual assets in the GOF portfolio are roughly one-third each of high-yield corporate bonds and bank loans, asset-backed securities (13%), and investment-grade corporate bonds (9%). Cash and other types of fixed income securities make up the rest. Current borrowings are 23% of the fund. This data is as of May 31–, 2022.
Really, two things in GOF’s holdings pique my interest. First, high cash holdings (~25%) and leverage (23%). Why is the fund holding so much cash if it’s got basically the same amount in leverage? Dry powder, I assume. Second, the fund has ~65% of its assets in BB to CCC rated companies. You can get this yield without taking some risk, but that is certainly something to consider. It should also be noted that, according to Standard and Poor’s research, a BB-rated company has a <10% chance of default over an eight-year period (all holdings data from Guggenheim).
GOF Holdings (Guggenheim Website)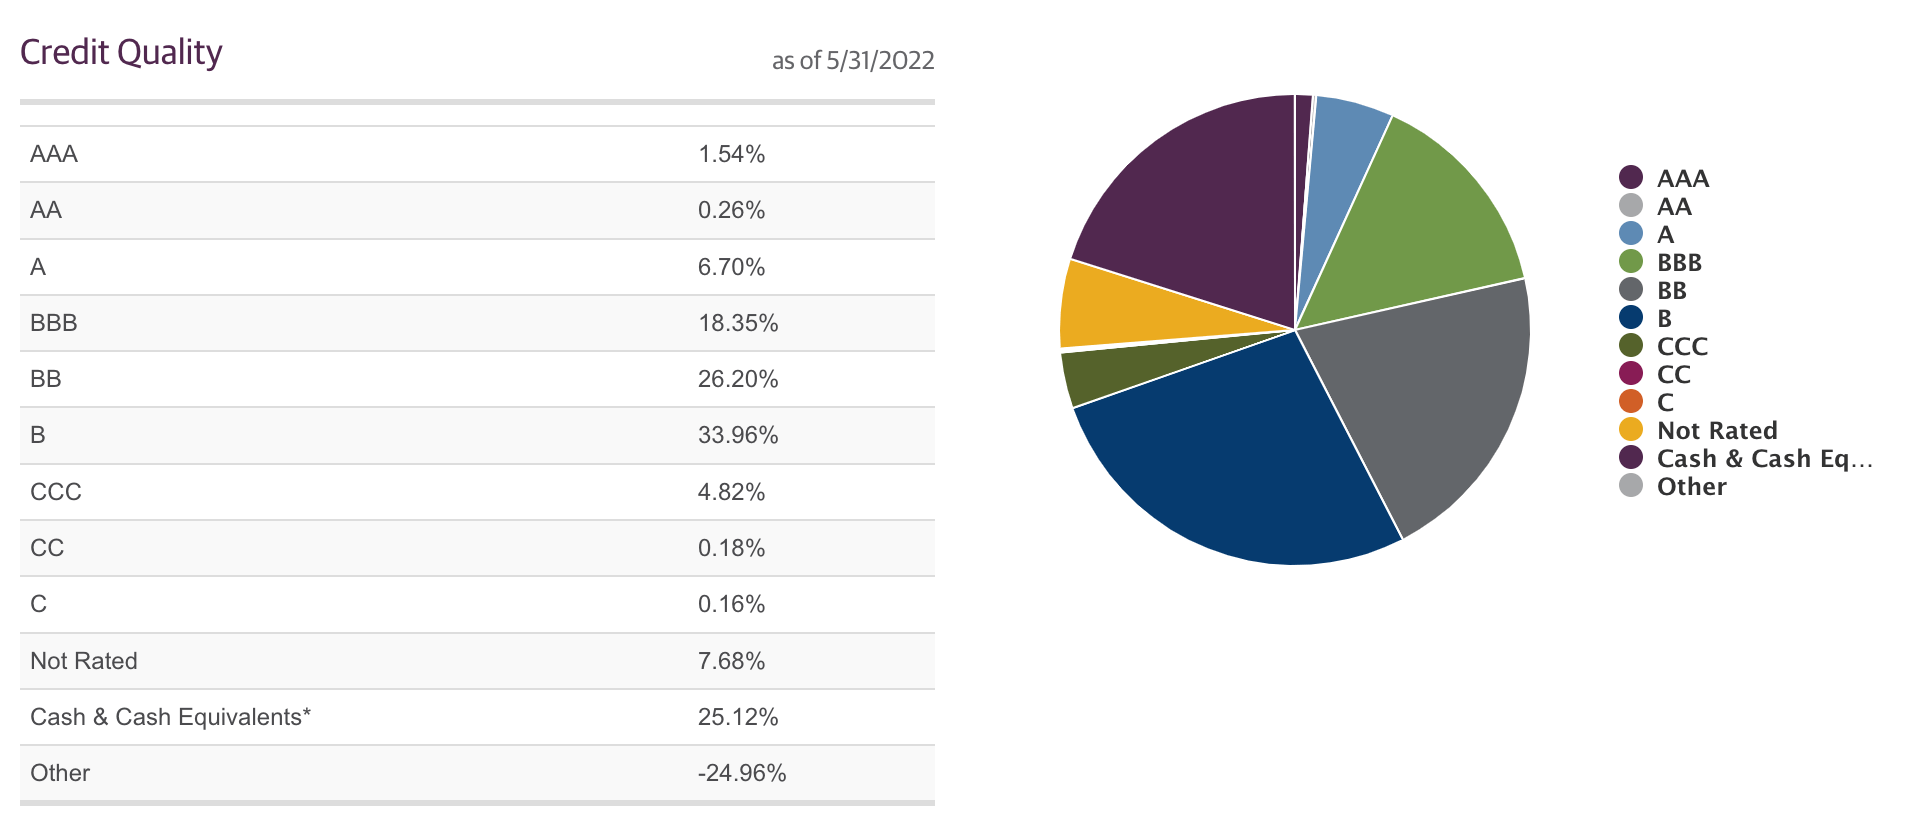
Considerations
GOF is certainly not a one-size-fits-all portfolio. There are risks. The fund depends on its solid distribution to attract investors and thus keep its price up. If the fund is unable to pay even a single month’s distribution, or if it ever lowers the distribution, the price would likely crater. Since GOF always trades at a premium to NAV largely because investors are attracted to the distribution, even one slip up would be costly. You could wipe out years of distribution gains in price if GOF’s management ever lowered or missed a distribution payment. Since distributions are always at management’s discretion, it’s always a possibility, however small that possibility is.
Furthermore, credit spreads have blown out quite a bit this year, with BB spreads going from 2.06% in January to a high of 4.17% on June 30th. This is great from a yield perspective, but junk rates don’t jump like that unless there is some higher probability of default. This is also somewhat of a recession leading indicator.
BBB Credit Spreads (St Louis Fed)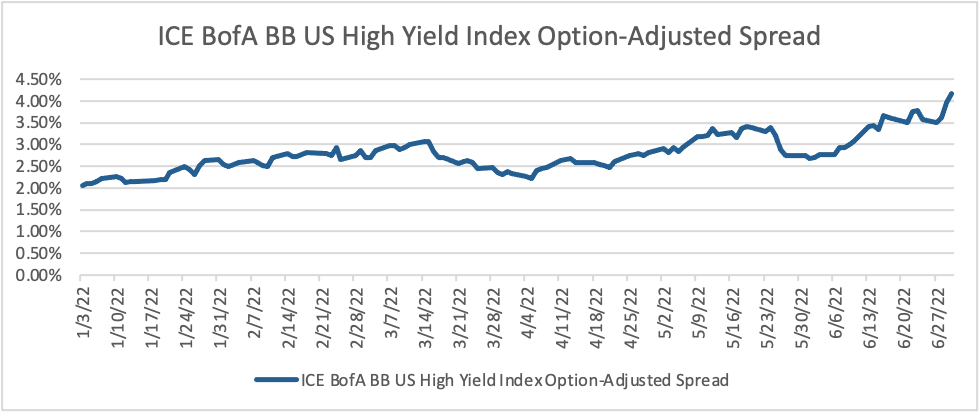
Alternatives and Parting Thoughts
Every investment has alternatives vying for you attention. GOF is not unique in this sense. There are lots of monthly paying, high-distribution funds available. The most obvious ones are the covered call ETFs (QYLD and its sibling funds) or basically anything from Brookfield Asset Management, especially their Real Assets Income Fund, RA. The QYLD family is a great choice for its passive income. It writes monthly at-the-money call options on the Nasdaq. The other funds in that family tweak this strategy slightly. Brookfield Real Assets income fund is basically a real estate fund, but it’s got a great income history.
I own GOF and I think it’s a great way to supplement any portfolio with some income. I advise against owning it without understanding the tax implications and how the NAV and distribution play together. If you’re at a point in your life where you aren’t looking for capital appreciation and just want steady, predictable income, GOF may be just what you need.
Be the first to comment