


AscentXmedia
Summer surge
Stocks appear to have discovered newfound life this summer. After bottoming in mid-June right before the summer solstice, U.S. stocks as measured by the S&P 500 at first grinded back and forth to the upside before surging over the last five trading days. Is the tide finally turning on the 2022 stock market correction?
Fundamental questions
Before going further, it is worthwhile to consider whether anything has fundamentally changed. The answer here is decidedly not.
While second-quarter earnings season is underway, the bulk of the announcements start rolling in next week. Bank earnings have dominated the headlines so far, and the results have been generally mixed.
As for the economic calendar, it was as light as a feather this week. Among the few notable headlines came from the Conference Board Leading Economic Index, which dropped for the fourth consecutive month implying slower growth and rising recession risks. Hardly the stuff to inspire an upside stock market burst.
And with the Fed poised to tack on another 75 basis point interest rate hike next Wednesday, following another month of scorching inflation readings, it’s not as though investors are looking ahead with anticipation to an easier market backdrop going forward.
Given the lack of fundamental substance behind the upside market move particularly over the last week, it is worthwhile to look to the technical to assess how much more gusto is behind the latest stock market surge.
Technically speaking
We will begin by looking at the S&P 500 Index, but in order to better understand the context of the recent rally, we will also examine many of the leading markets closely related to the U.S. large cap stock benchmark for additional clues about what to expect from markets as July draws to a close.
StockCharts.com
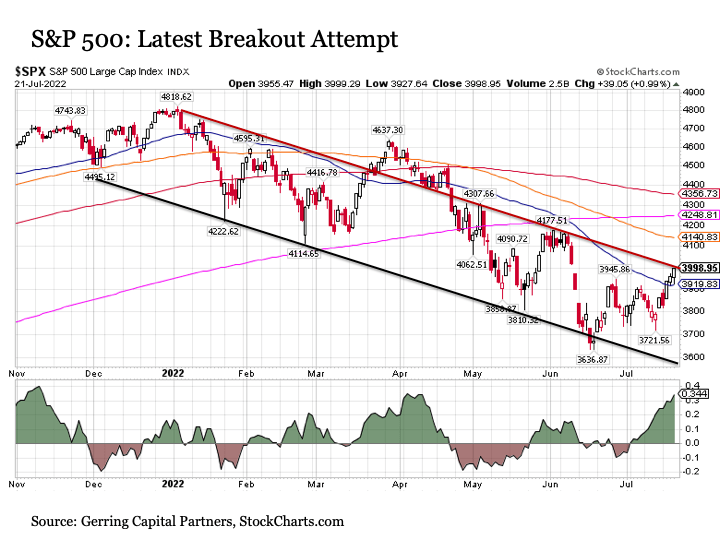
The S&P 500 is mounting another breakout attempt. After trading firmly higher in four out of the last five trading days, it is now pressing against the top end resistance of its downward sloping trading channel that has been in place since the start of the year.
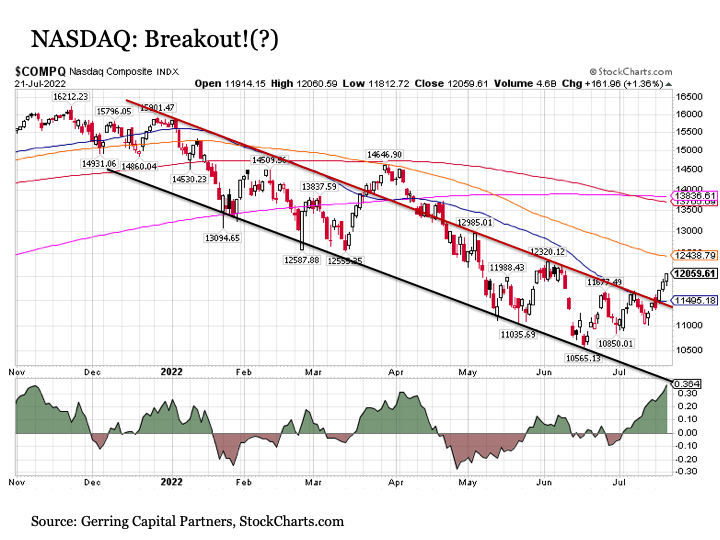
What about the ability of the S&P 500 to break out to the upside? The good news is that tech heavy NASDAQ is providing some encouraging signs.
StockCharts.com
Toiling since before Thanksgiving of last year, the NASDAQ has spent the last three trading days pushing definitively to the upside. In the process, it has advanced solidly above its downward sloping trading channel resistance. Surely the new life pumping into the long resilient but more recently beleaguered tech sector can pull the broader market S&P 500 higher with it.
Color me dubious
Perhaps, but I remain dubious about the sustainability of this latest bounce for both the S&P 500 and the NASDAQ.
First, we’re still caught in an environment of lower highs and lower lows. This pattern must be more definitively broken before we can begin to breathe any sigh of relief that the market bottom is in.
Next, while both the S&P 500 and the NASDAQ have managed to creep their way back above medium-term 50-day moving average resistance (the blue line in the respective charts above), various layers of resistance still loom ahead. This includes the downward sloping 100-day moving average, which batted down the NASDAQ’s breakout attempt back at the end of March.
In addition, even if the NASDAQ and eventually the S&P 500 manage to continue their moves to the upside, this does not mean that they will be out of the woods. For we saw both major market benchmarks spend the better part of a month from late March through mid-April trading above their downward sloping trading channels, only to see these indices eventually descend back into this sliding trading range.
But perhaps the most notable reading suggesting that exhaustion may soon set in on the latest stock market bounce comes from money flow.
Go with the flow
Chaikin Money Flow is a technical analysis reading that measures the amount of money flow volume over a pre-determined time period. In the case of the charts in this article, the time period under consideration is the last 20 trading days and is shown by the charts below containing the “green mountains” showing buying pressure and “red valleys” showing selling pressure.
What stands out in the charts for the S&P 500 and NASDAQ above is that the current buying pressure is notably strong for both indices at present (green mountains are currently big). This sounds decidedly positive for both indices, and buying pressure is certainly a good thing, but we must also consider the absolute level of buying pressure. Why? Because if buying pressure is already extremely strong or at a height that represents peak levels, it becomes increasingly difficult to muster out even more buying pressure than the already high amount in today’s market.
One has to look no further than the last big green mountain before today’s in both charts above. These occurred in early April just as both indices were topping out and rolling back over to the downside. In short, the strong buying pressure eventually became exhausted, and sellers increasingly moved in. Such is another downside risk confronting investors today.
Flowing downstream
The technical challenges discussed above are not limited to the headline benchmarks. For as we look underneath the market surface, we see these characteristics are even more pronounced.
StockCharts.com
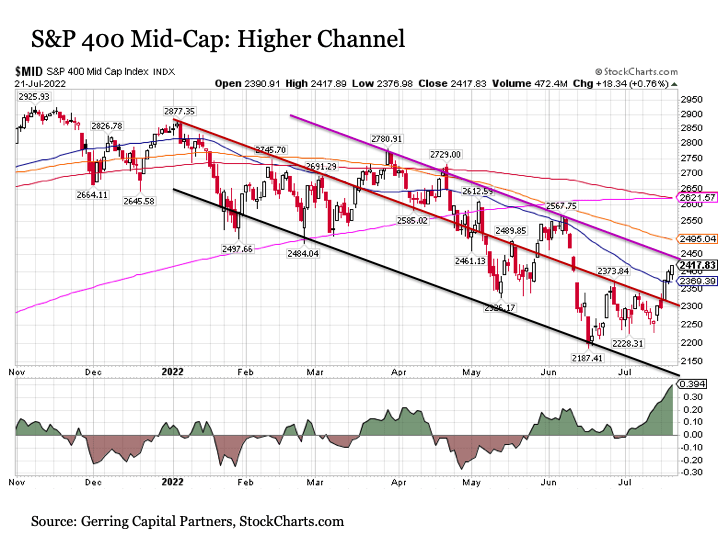
Consider the S&P 400 Mid-Cap Index. Over the last five trading days, mid-caps have burst to the upside into the higher half of its downward sloping trading channel dating back to the start of the year. The index is quickly approaching the top of this channel where it has already failed three times previously since late March. In the process, money flow has surged far beyond previous peaks to levels that we have not seen in more than three years. Thus, it may be difficult for mid-caps to maintain this magnitude of buying pressure to continue its move higher much further from here.
StockCharts.com
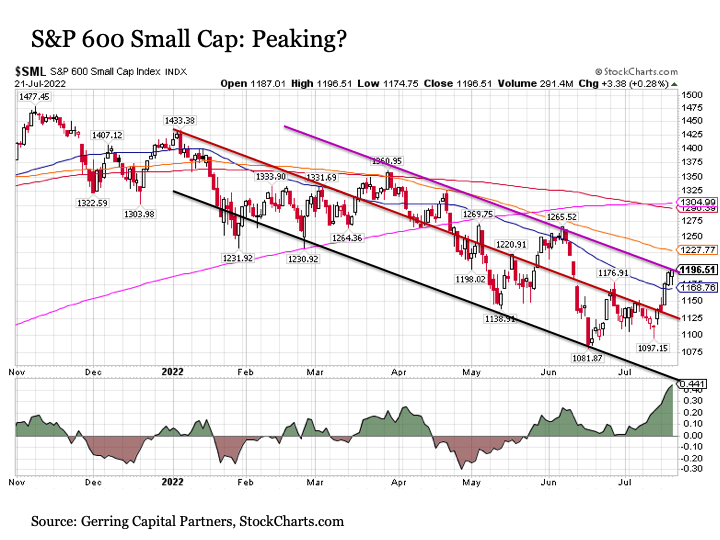
The S&P 600 Small Cap Index paints a similar picture to mid-caps. About the only difference is that small caps may have already hit their ceiling.
StockCharts.com
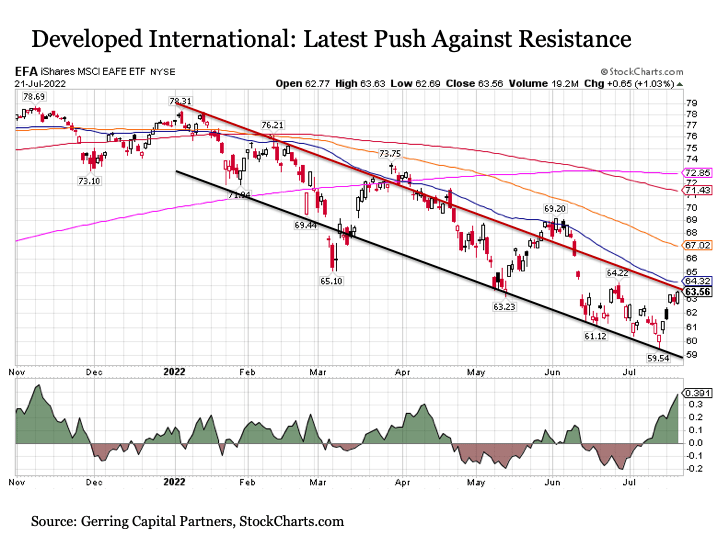
Let’s continue our look downstream by turning our attention overseas. We’ve seen a similar surge in money flow in developed international markets as measured by the MSCI EAFE Index. And while we have arrived at the top end of the downward sloping trading range, we are still operating at lower highs coming off of lower lows with no upside breakout appearing imminent.
StockCharts.com
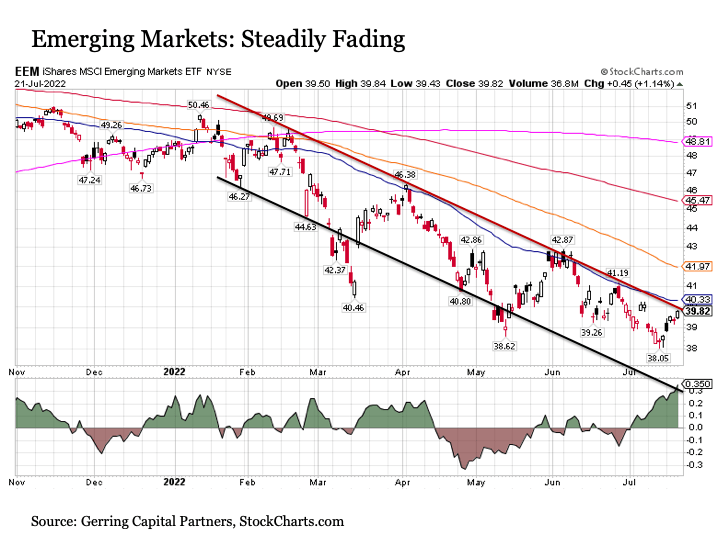
As for emerging market stocks as measured by the MSCI Emerging Market Index, the view is even more unexciting. This more speculative area of the global stock market entered into a steeper downward sloping trading channel this year, and the surge in money flow has only lifted emerging market stocks barely above levels that represents fresh new lows over the past two months.
Bottom line
The recent surge in stock prices is certainly an encouraging development, but it should be looked upon with a measure of caution. Not only is the recent advance lacking any meaningful fundamental or economic backing, but the technicals suggest that further upside could be challenging to come by in the weeks ahead. Not only are many of the major market benchmarks surging head first into key resistance levels, but the recently high levels of buying pressure suggest that exhaustion may soon descend upon the recent rally.
At a minimum, we should prepare for a period of consolidation across the major market averages through the rest of July. Perhaps more likely, investors should brace for the next leg lower in the weeks ahead as robust buying pressure gives way and stock index continue their latest move back to the bottom end of their respective downward sloping trading channels.
Instead of focusing on the major market indices, investors continue to be better served to concentrate the stock segment within a broad asset allocation strategy toward more targeted sector and industry themes that are still performing well amid the broader market downtrend. This includes pharmaceuticals, food, military defense, and energy among others.
Be the first to comment