

PhonlamaiPhoto/iStock via Getty Images
Investment Thesis
From the Portfolio Manager’s desk
Here at HB Insights we continue adding to our basket of med-tech stocks, filled with wonderful, selective opportunities with asymmetrical risk/reward. Globus Medical, Inc. (NYSE:NYSE:GMED) is a position we’ve been consistently active on sine FY20 in our equity risk both on the strategic and tactical side. GMED is well positioned to deliver tremendous EPS upside over the coming 3-quarters in my opinion, as it accelerates growth in its robotics and international markets. I’ve initiated a buy at $73 [Exhibit 1], and once this is [hopefully] filled, am seeking ~50% return with price targets of $86 and then $106. You can see additional charts guiding these price targets in Appendices 1 and 2.
[Note: to see our previous publications on GMED, click these links:
1. August, 2020
4. June, 2022
Exhibit 1. Seeking to size up at $73. If price action treads that way I’m confident we’ll be filled at $73-$74, and I’ll be seeking 50% upside to a second price target of $106.
Note: Log scale shown (Data: Updata)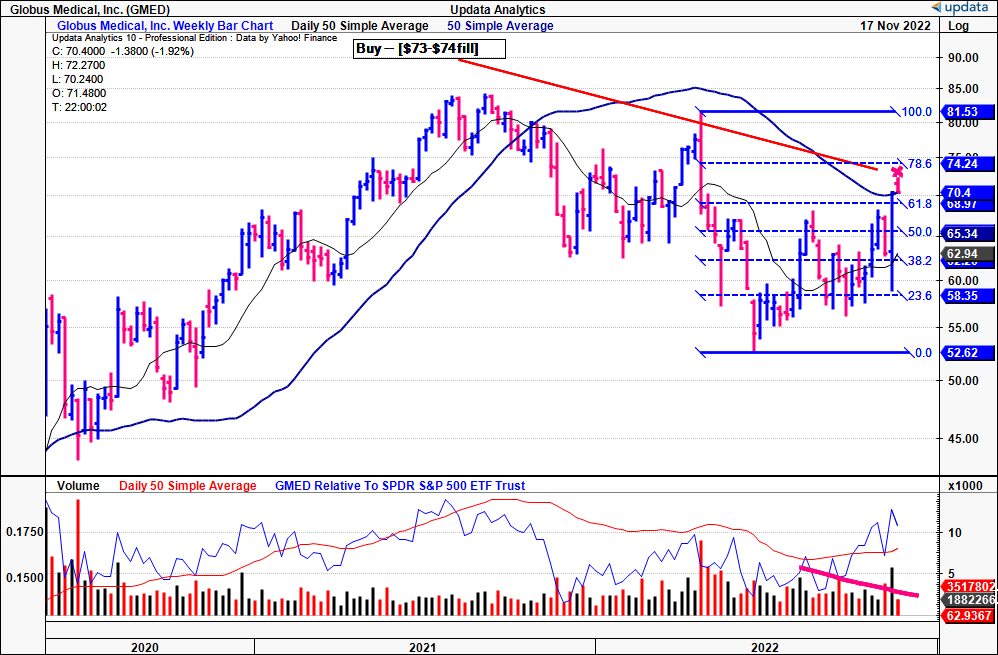
Investment conclusion
As a reminder our thesis looks heavily at the US and ex-US market opportunities for GMED. The North American Spinal Implants market was recently valued at $7.7Bn in FY22 and is estimated to grow at CAGR 5.3% into FY27, in-line with estimates of CAGR 5.5% for the global market. The company expects to benefit from this market growth, and normalize to pre-pandemic growth ranges.
Recall, GMED was growing at a consistent 9-10% at the top-line before the pandemic. Management guide 7% in FY22 revenue growth to $1.025Bn. Looking ahead, however, GMED has various growth drivers in place, including robotic pull-through, strength across the broad portfolio – especially trauma, Excelsius 3D in US Spine, and its deeper penetration of international markets. Hence, it sees a return to the 9% growth range from FY23, and average YoY EPS upside of 117% over the coming 3 quarters. This is an above-market growth rate that implies GMED can capture additional market share. This confirms our buy thesis.
Q3 earnings illustrative of growth expectations
It was a strong top-line quarter for GMED with a healthy growth route noted across its product portfolio. Net sales growth of 11% YoY came in at $254mm and pulled down to GAAP earnings of $0.48 per share, up from $0.47 the year prior. Noteworthy, GMED confirm that revenue distribution toward the ExcelsiusGPS and 3D platforms continues to track well.
Management successfully kept a lid on cost inflation with quarterly operating margin of 23% [flat YoY] as OpEx climbed to $128mm from $117.8mm the year prior. With top-line growth normalizing towards pre-pandemic ranges, management retained FY22 sales guidance of $1.025Bn, 7% from FY21. It revised FY22 EPS estimates down however from $2.10 to $2.03 after a $0.07 adjustment for FX/tax headwinds.
Looking deeper at segment takeouts, key highlights for me were the following:
(1). US Spine growth was the standout during the quarter with 9% growth on Q3 FY21. The division has grown revenue by 26% over the trailing 12 months. Upsides were noted across the entire product mix with confirmed growth in expandables’, cervical and lateral implants, biologics, 3D printed implants and pedicle screws. The growth was underscored by strong pull-through from its robotics segment.
Key to GMED’s operating leverage in robotics is that it realizes an uptick in surgical volume with each respective robotic placement, once it is placed. I’ve confirmed robotic procedures grew 48% YoY to ~40,000 procedures performed to date. Management say the pipeline for both robots and imaging systems is strong for Q4, confirming our thesis.
(2). GMED continues to penetrate international markets. Its ex-US spinal implant division saw record turnover and clipped a 25% YoY gain. Strength was seen in large markets, with ≥40% growth in its UK, Aus, Brazil and Indian segments. Total ex-US revenue grew to 14.6% of turnover in Q3, up from 13.7% the year prior.
Exhibit 2. GMED continues to deepen penetration in its international markets – 17.7% YoY growth, 14.6% of turnover.
Data: GMED Q3 FY22 10-Q, pp. 24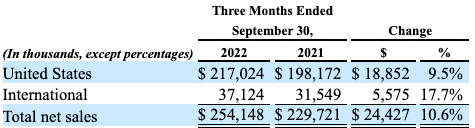
(3). Trauma was a divisional highlight and, along with ex-US spinal, delivered a record quarter with 83% upside on Q3 last year. It also grew 20% from Q2 FY22, underpinned by GMED’s expanded salesforce headcount. This resulted in strong uptake and double-digit growth across all of the division’s 14 revenue streams.
Additional catalysts for price change
We project strong earnings upside for GMED over the coming quarters. This is driven by growth in its robotics segment and penetration of its international spinal markets. As seen in Exhibit 3, we project tremendous EPS upside of 278% YoY in the coming quarter. From there, c.42% YoY growth in FY22 and Q1 FY23 respectively.
The market has yet to fully discount this upside in GMED’s share price in my opinion. Recent price action therefore leads me to believe the market will rate the stock higher over the coming 3-quarters. I’ll be aiming to capture all of the upside drift from each earnings announcement should this be the case.
Exhibit 3. GMED forward estimates FY22-FY24. We see tremendous EPS upside versus consensus in the coming 3 quarters
Data: HB Insights Estimates
Question is what other evidence [other than these raw fundamentals] exists to suggest GMED will extend its latest rally? First, net fund exposure has increased substantially over the past 6-months to date [Exhibit 4]. Net accumulation increased by a positive c.650mm shares, measured by net ownership of GMED shares [derivatives not included].
I like to see institutional buying volume prior to, or at the beginning of a stock’s upside move. To me this is good evidence of the same.
Exhibit 4. GMED net accumulation increase from 6-months to date. Fund managers accumulating shares along with upward price action
Data: Refinitiv Eikon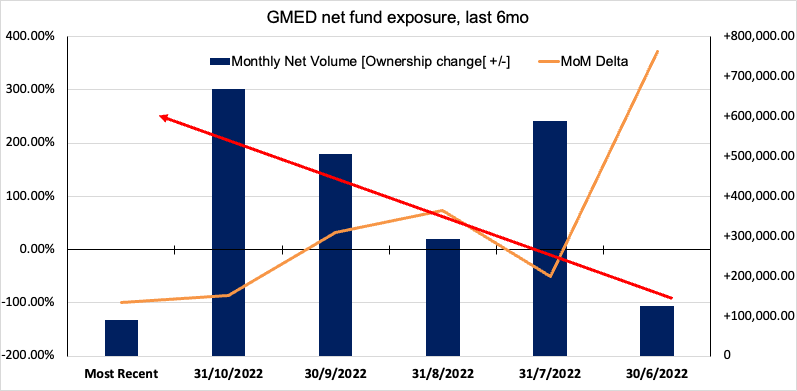
We can see further evidence of this buying activity below. In particular, the volume reversal and breakout above the volume 50DMA last week was key. Shares subsequently closed above their 50DMA at the 250DMA line. GMED has traded above the 50DMA for the last 3 weeks, whilst its relative strength rating creeps up.
It has now broken out to the upside above its previous double-top, as seen below – a good sign. This kind of support demonstrates to me the kind of buying volume and price momentum needed to see the stock rate higher.
Exhibit 5. After finding support at the 50DMA, we’ve seen volume breakout above its 50DMA with shares following suit. We’ve now broken above previous double-top with strong buying support.
Note: Log scale shown (Data: Updata)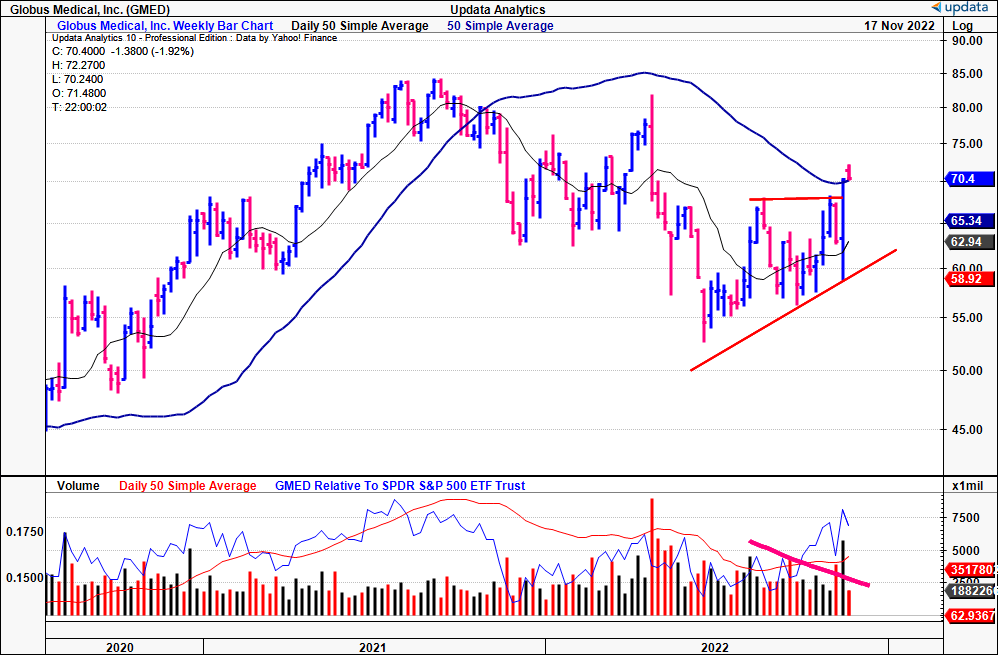
Valuation and conclusion
Consensus has valued GMED at 37x forward GAAP P/E and 34x non-GAAP earnings, slightly ahead of its 5-year average. Rolling our FY22 EPS estimates forward, I believe GMED should trade up at 45.7x forward earnings [well-above historical averages].
The FY22 S&P 500 forward P/E estimate is 18.18x, therefore I expect GMED to outpace the benchmark by a factor of 2.5x. Applying the 45.7x multiple to our EPS number of $1.89 derives a price target of $86.40. This is well supported with technical price studies, as seen in Appendix 2.
Looking ahead, applying the 45.7x forward earnings to our FY23 EPS estimates values GMED at $106. Given the robust data around each of these targets, I am more confident in using these estimates.
I therefore am setting our next price objectives at $86 [Price target 1] followed by $106 [Price target 2] if successful.
Exhibit 6. Fair P/E 45.7x FY22 EPS Est. = $86.40
Note: Fair forward price-earnings multiple calculated as 1/fair cost of equity. This is known as the ‘steady state’ P/E. For more and literature see: [M. Mauboussin, D. Callahan, (2014): What Does a Price-Earnings Multiple Mean?; An Analytical Bridge between P/Es and Solid Economics, Credit Suisse Global Financial Strategies, January 29 2014]. (Data: HB Insights Estimates)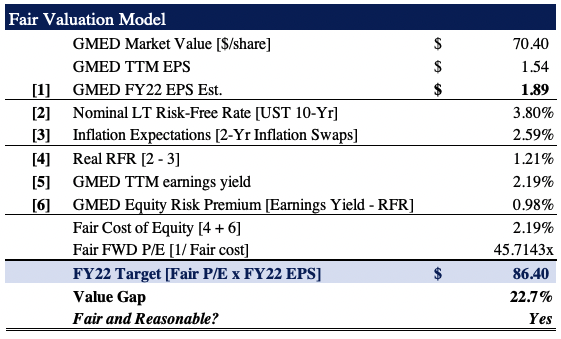
Exhibit 7. Fair P/E 45.7x FY23 EPS Est. = $106.
Note: As above (Data: HB Insights estimates)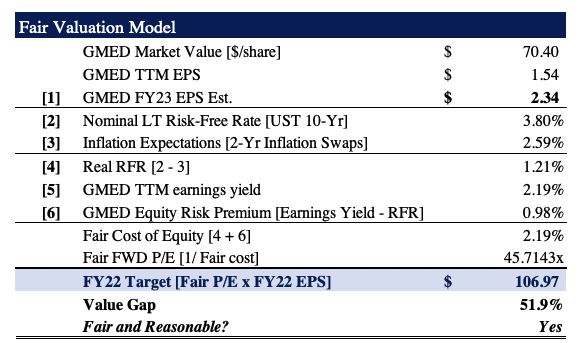
Net-net I continue to rate GMED a buy, and I am eyeing price objectives of $86, $106 for the coming 3-6 months. This is after sizing up our position with a buy order at a $73-$74 fill. Here I am seeking 52% upside to the $106 price target. Key risks are a slowdown in the US Spinal market, the recent surge in Covid-19 cases impacting surgical turnover, reduced capital budgeting from hospitals, and key macroeconomic risks such as rising policy rates and cost inflation. All of these factors have the ability to reduce the EPS upside we have forecasted for GMED. Rate buy.
Appendix 1. Daily point and figure – next upside target to $73, corroborates entry point at that mark.
Data: Updata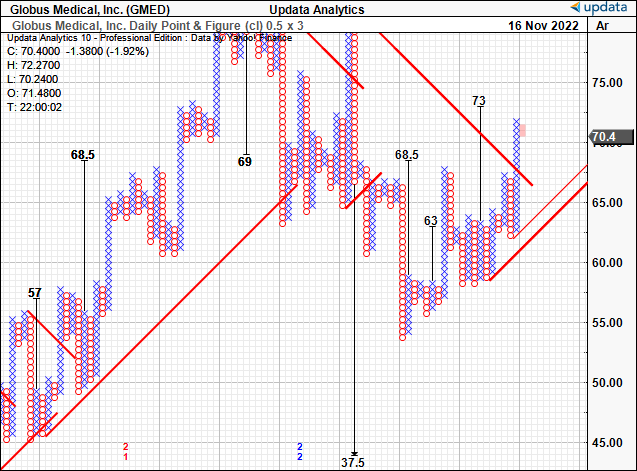
Appendix 2. Weekly [long-term] price objective to $84 – corroborates fundamental price objectives.
Data: Updata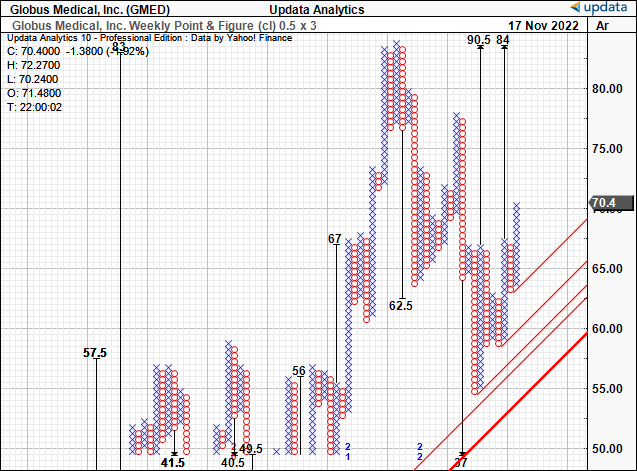
Be the first to comment