

Ninoon
Introduction
Global Medical REIT (NYSE:GMRE) is a real estate investment trust that owns a portfolio of medical office buildings and small-to medium sized healthcare facilities located in secondary markets and suburbs of primary markets that provide services needed for an aging population such as cardiovascular treatment, rehabilitation, eye surgery, gastroenterology, oncology treatment and orthopedics. The company believes these facilities and markets are typically overlooked by larger REITs in the sector.
The company is trading at a deep discount to NAV (net asset value), or theoretical liquidation value, and provides a relatively safe dividend yield of 10.8% at the current price.
Despite improvement in the underlying business, the stock is down 56.3% YTD, previously trading at a peak of $18.51 in January 2022.
Ycharts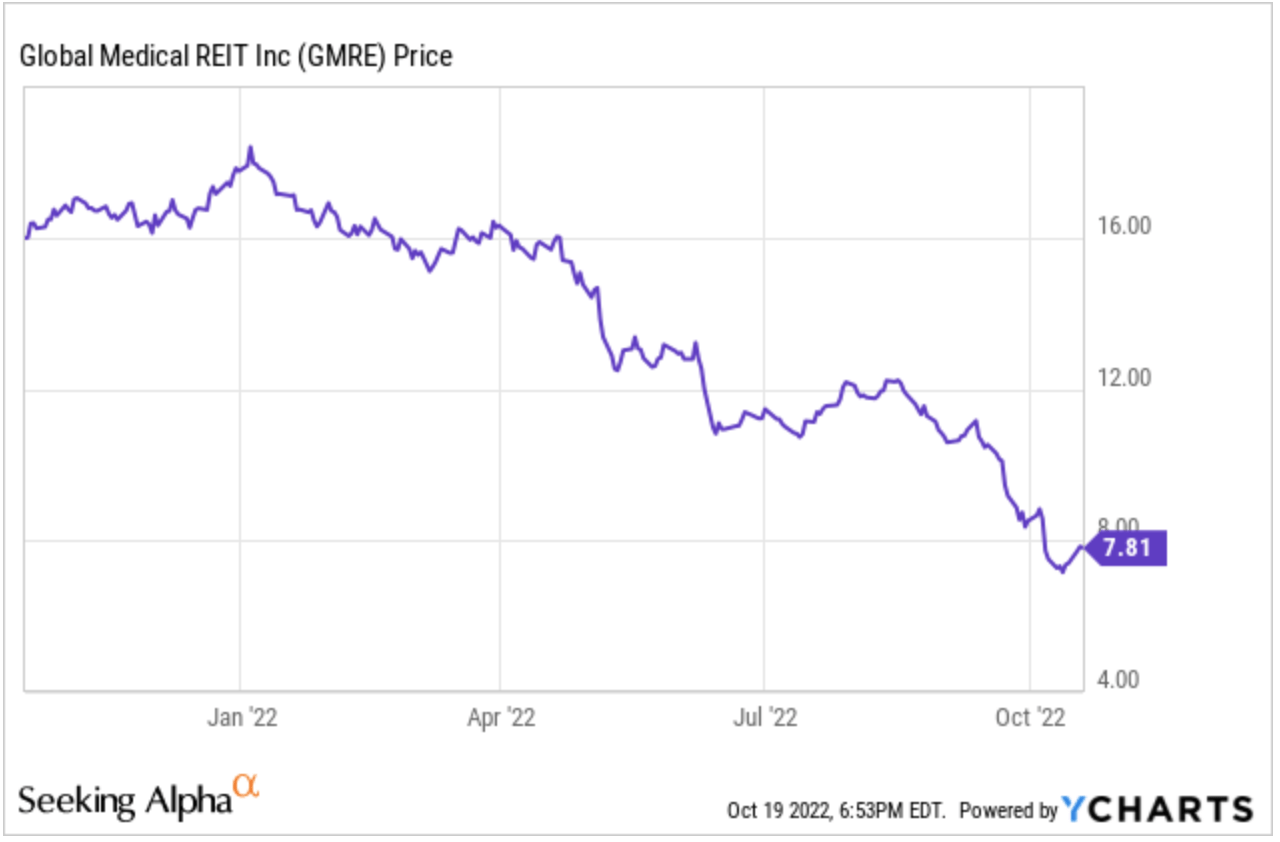
The stock is down substantially with no impairment to the actual business, with FFO (Funds from Operations) continuing to grow year-over-year.
Strong FFO Growth & Business Resilience
GMRE has been rapidly growing earnings since 2017, with an FFO CAGR of 20.8% and AFFO CAGR of 14.7% over the time period.
| 2017 | 2018 | 2019 | 2020 | 2021 | 2022 Q1 Annualized |
2022 Q2 Annualized |
CAGR | |
| FFO | $0.41 | $0.78 | $0.75 | $0.56 | $0.90 | $0.92 | $0.96 | 20.8% |
| AFFO | $0.54 | $0.76 | $0.75 | $0.88 | $0.95 | $0.96 | $1.00 | 14.7% |
| Dividend | $0.80 | $0.80 | $0.80 | $0.80 | $0.82 | $0.84 | $0.84 | 1.1% |
GMRE’s FFO and AFFO growth record is a testament to the resilience of its business. The dividend has been stable, with no dividend cut even through COVID, when many REITs were slashing their dividends. The 10.8% dividend is also sufficiently covered by FFO, with an FFO yield of 12.3% and AFFO yield of 12.8%, so I have confidence that the dividend will continue to be paid out regardless of the stock price.
5x Rent Coverage Ratio Indicating Extremely Strong Tenant Quality & Business Performance
A key metric for assessing tenant quality is rent coverage ratio, also known as EBITDAR (Earnings before interest, tax, depreciation, amortization, and rent) coverage ratio. A rent coverage ratio of 1x indicates that a tenant is funneling 100% of its site-level earnings into rent, meaning that they are just staying afloat and making the rent payments. A 2-3x rent coverage ratio is considered a very healthy coverage ratio, indicating that tenants are making 2-3x the rent.
GMRE 2022 Investor Presentation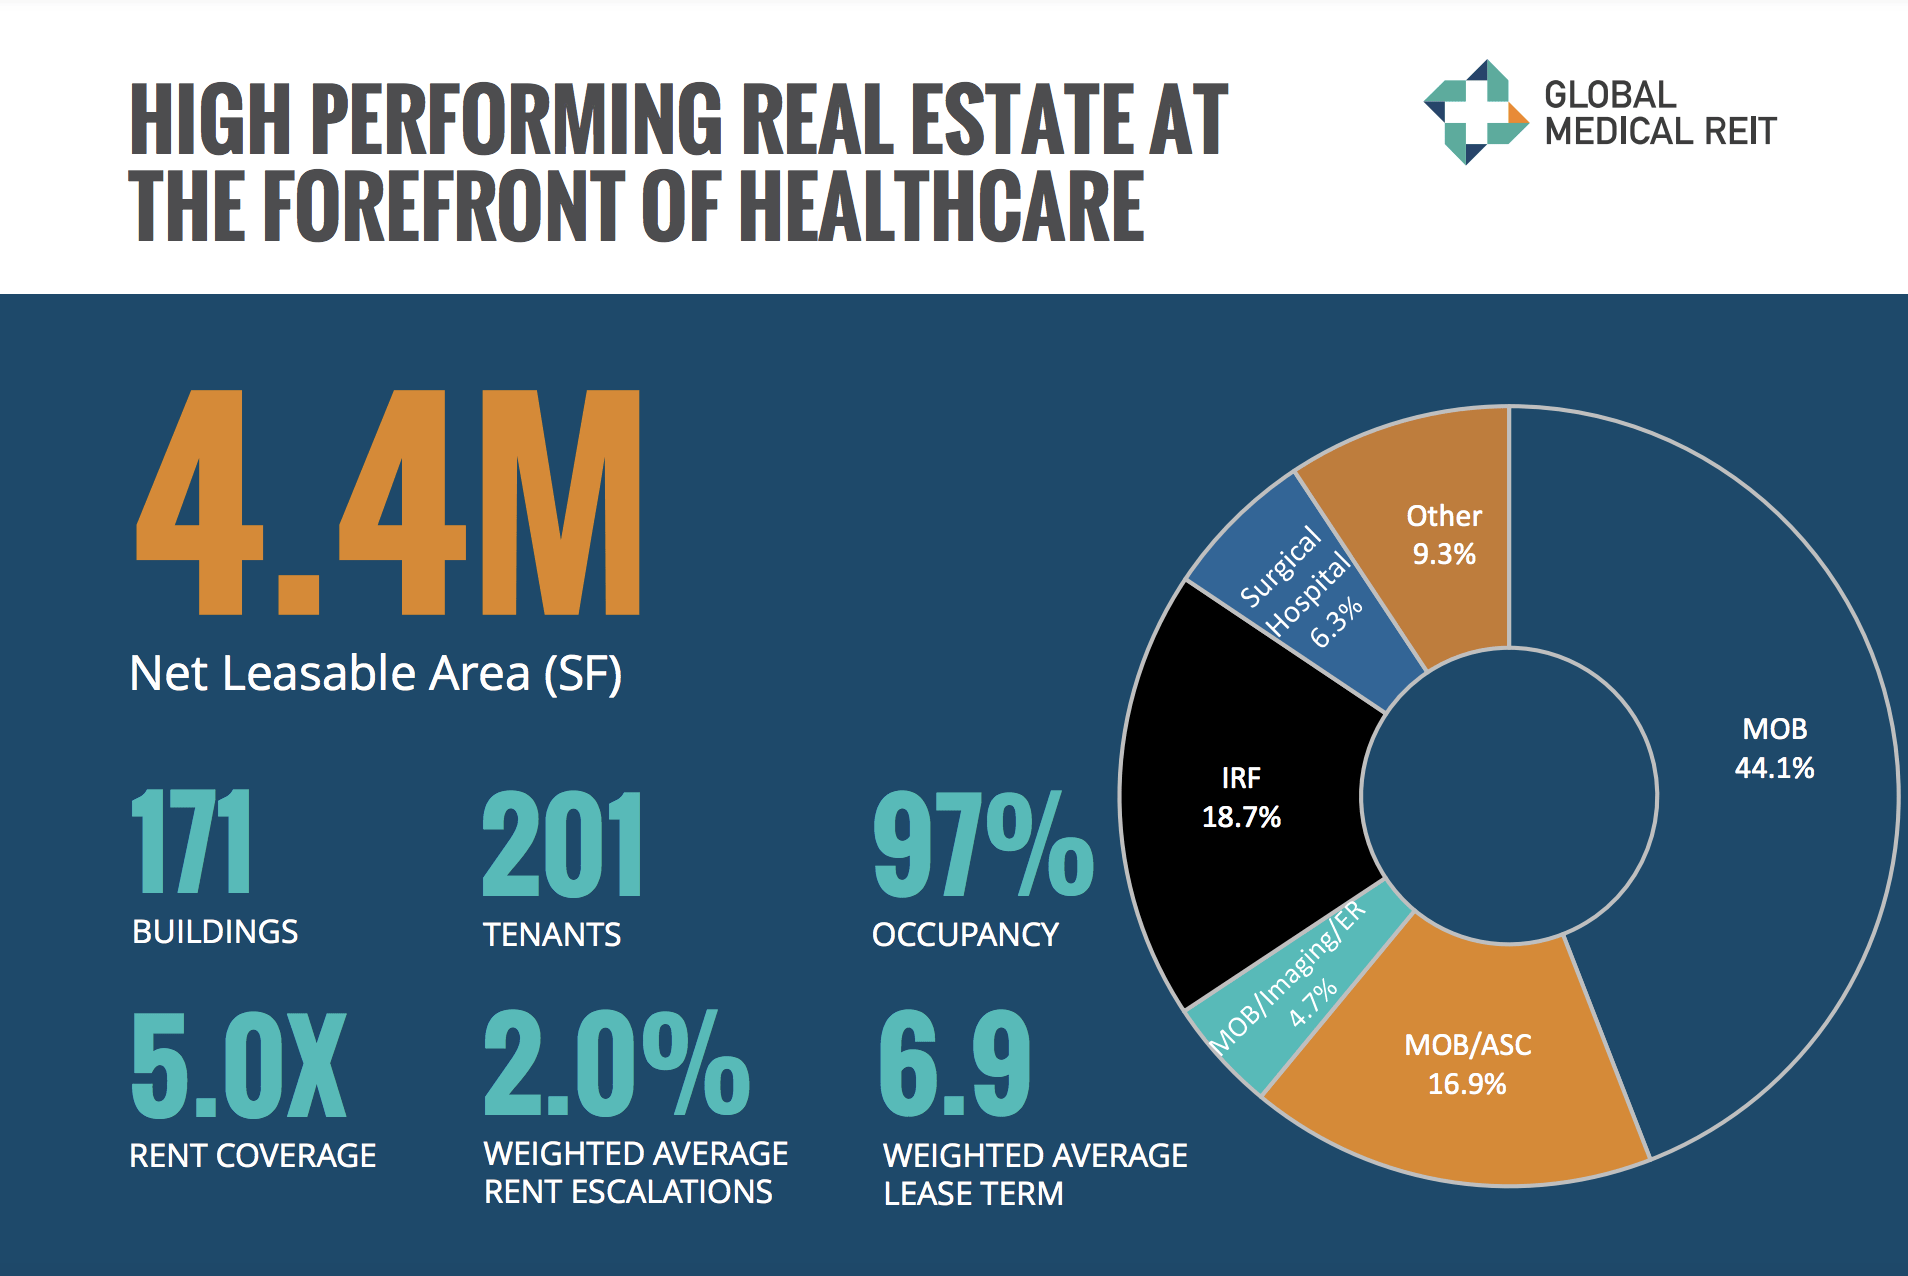
Meanwhile, GMRE tenants have an extremely strong rent coverage ratio of 5x. This means that GMRE tenants are unlikely to default on rent payments and will likely choose to renew their leases upon expiration due to the profitability of their locations. This also provides GMRE with strong negotiating leverage over its tenants when it comes time to renegotiate leases
Diversified Tenant Base
Medical Properties Trust Inc, a peer of GMRE, is also down substantially this year largely due to concerns about the financial health of its largest tenant, Steward Health Care. MPW is suffering from an unhealthy tenant concentration, with Steward Health Care accounting for 27.8% of its ABR (Annualized Base Rent).
GMRE does not suffer from this same tenant concentration risk, with its largest tenant Kindred Healthcare Inc. comprising of 7.2% of ABR, and its top 3 tenants making up a smaller percentage of ABR (19.4%) than MPW’s exposure to its biggest tenant (27.8%).
GMRE 10-K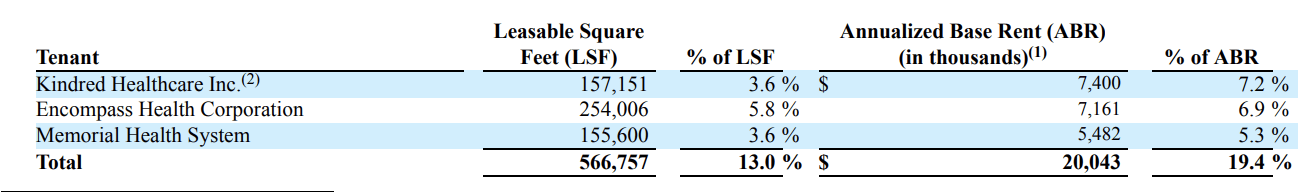
This tenant diversification limits GMRE’s exposure to future financial struggles from any one particular tenant.
Net Asset Valuation
Analyst Connor Siversky from Berenberg mentioned consensus NAV estimates of “right around $15 a share” on the Q2 2022 earnings call before asking about the possibility of a share buyback program.
GMRE does not report a direct property-level net operating income (NOI) figure for us to calculate real estate asset value, so we will have to back into it.
2022 Q2 10-Q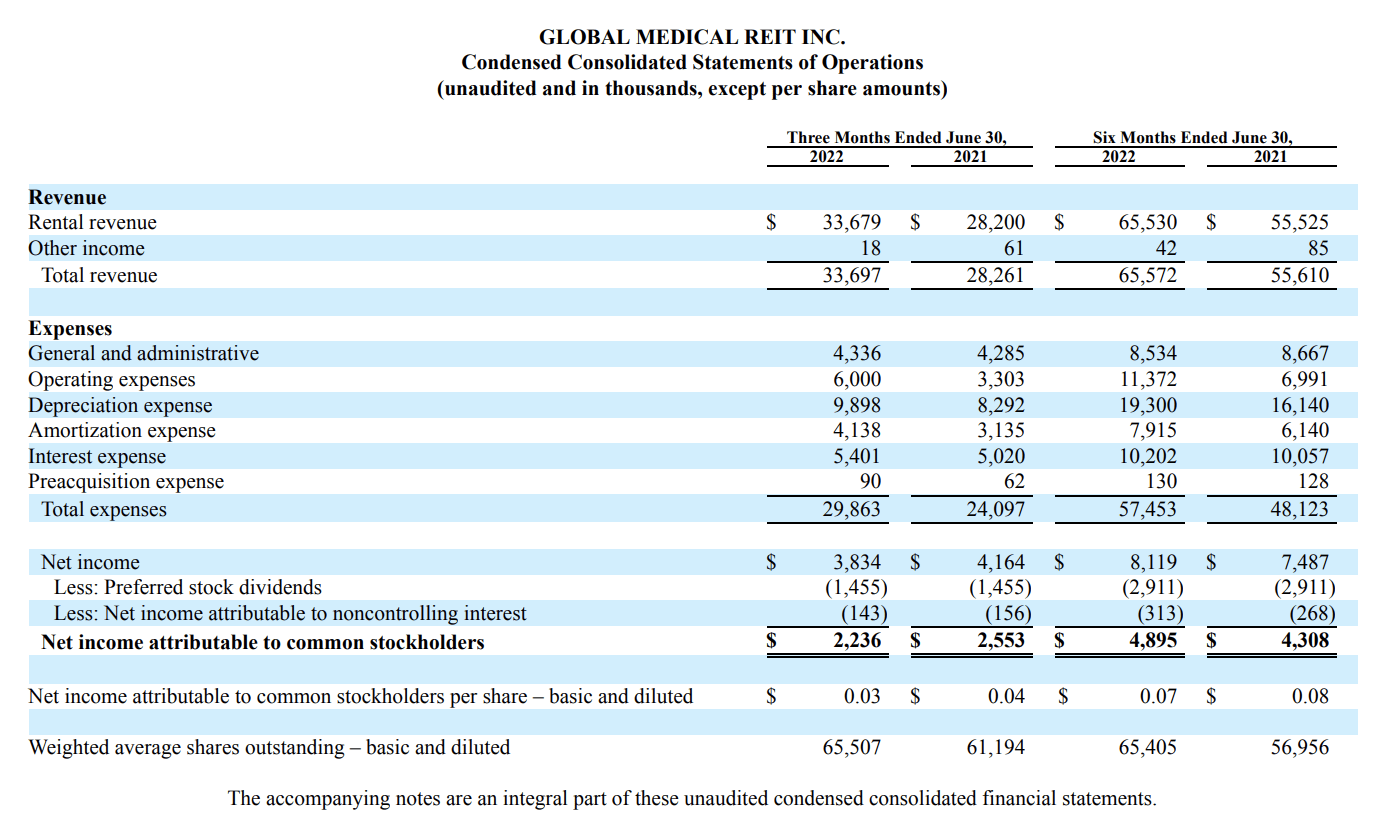
GMRE reported $65.53M in rental revenue for H1 2022, or an annualized $131.06M in rental revenue, and $11.37M in operating expenses for 2021, or annualized $22.74M in operating expenses. This leaves an annualized net operating income of $108.32M.
The company has historically done acquisitions in the 6-7.5% cap rate range. Applying a 7.0% cap rate to the portfolio’s net operating income yields a real estate asset value of $1.463B. Adding other tangible assets, subtracting liabilities of $708.2M and preferred equity of $75M results in Net Asset Value of $827.8M or $10.96 of NAV per share. Breakdown of net asset value is below.
| Net Operating Income | $108.32M |
| Real Estate Value at 7.0% cap rate | $1.547B |
| Cash and cash equivalents | $5.9M |
| Accounts Receivable | $33.8M |
| Total Asset Value | $1.587B |
| Liabilities | $708.2M |
| Preferred Equity at Par Value | $75M |
| NAV | $764.23M |
| NAV per share | $10.96 |
With net asset value at $10.96 a share, the stock is trading at a 29% discount to NAV, implying 41% upside to NAV. While investors wait to achieve 41% upside, they will get paid a 10.8% annualized dividend for their time.
Sensitivity Analysis
REIT valuation is highly sensitive to movement in market cap rates. Based on an NOI of $108.3M, it appears that the aforementioned consensus NAV of $15 is based on a sub 6% cap rate, which I believe to be generous given the current rising rate conditions.
| Total Asset Value | NAV | NAV per share | |
| 6% cap rate | $1.845B | $1.022B | $14.66 |
| 6.5% cap rate | $1.706B | $883.3M | $12.67 |
| 7% cap rate | $1.587B | $764.2M | $10.96 |
| 7.5% | $1.484B | $661.1M | $9.48 |
| 8% | $1.394B | $570.8M | $8.19 |
There is a built in margin of safety; investors at the current price of $7.77 would still be purchasing below NAV even if market cap rates on the portfolio rise to 8%.
Risk: Floating Rate Debt
As reported in the most recent Q2 10-Q, management is expecting an increase in interest expense in the amount of $2.6M with an assumption of a 100 basis point increase in term SOFR.
Due to this interest rate environment, term SOFR, which, beginning on August 1, 2022, is the reference rate for our floating rate debt, is currently expected to increase to approximately 3.30% by the end of 2022 (based on the term SOFR forward curve as of August 1, 2022), over 100 basis points (1.00%) from its current level. Based on our floating rate debt balance as of June 30, 2022, a 100 basis point increase in term SOFR would have caused our annual interest expense to increase by approximately $2.6 million.
This rising rate impact would hit FFO and AFFO, with an impact on FFO and AFFO of about 3.7 cents a share per 100 basis point increase.
Even if the Fed were to raise rates an additional 400 basis points, AFFO would only go down 15 cents from interest rate impact to $0.85, leaving the $0.84 in annual dividends covered.
Risk 2: Potential Stagnant Growth Moving Forward
The capital strategy playbook for acquisition heavy REITs is to issue equity at prices above NAV, and use proceeds to acquire assets. GMRE is an acquisition heavy REIT that is targeting $200M in acquisitions for 2022. The company has been executing on this strategy successfully. However, if the price of the stock continues to trade below NAV for a prolonged period of time, then the company will be unable to grow FFO and AFFO at the same rate as they did in previous years. FFO and AFFO growth would then be limited to rent growth, with 2% average rent escalators built into their leases.
A Final Word
I hope to continue providing my investment ideas to Seeking Alpha readers, including more opportunities in companies trading below liquidation value. Best of luck in your investing endeavors.
Be the first to comment