


CentralITAlliance/iStock via Getty Images
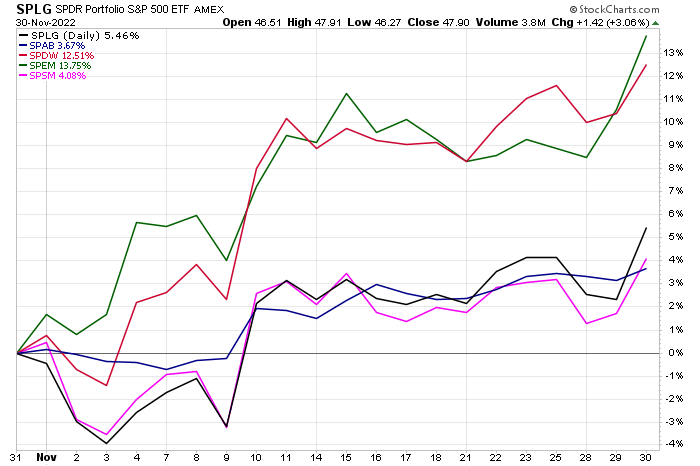
Stocks surged to close out November. The S&P 500 climbed 5.5% while small caps finished higher by 4.1%. Meanwhile, the domestic bond market rallied amid lower interest rates. The SPDR Aggregate Bond ETF (SPAB) was up more than 3% when including dividends.
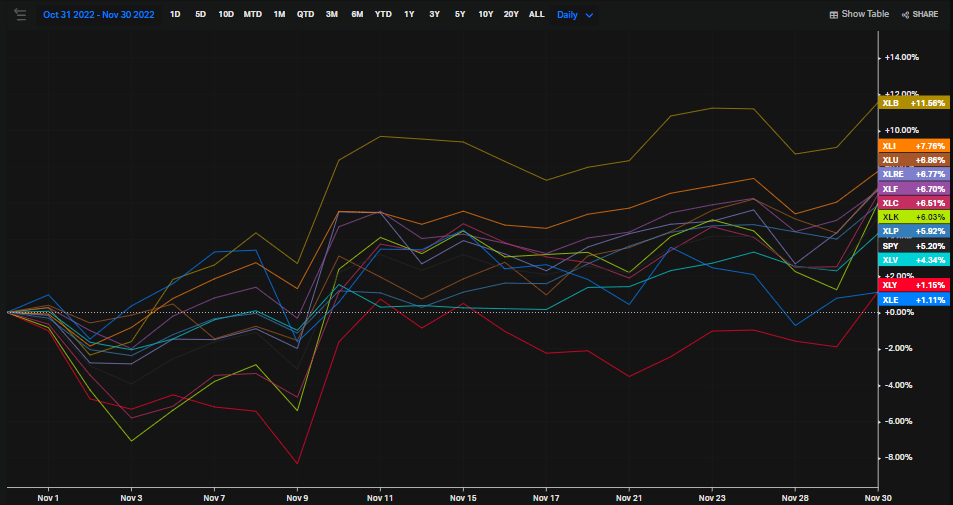
The star of the month was overseas shares. The foreign developed markets ETF had one of its best months on record with a climb of nearly 13%. Emerging markets fared even better – jumping 14% after a dismal October. Let’s take a closer look at ex-US developed markets – an often overlooked niche.
International Stocks Outperform US Equities In November
Stockcharts.com
According to SSGA Funds, the SPDR Portfolio Developed World ex-US ETF (NYSEARCA:SPDW) is a low-cost fund that seeks to offer broad exposure to developed international equities outside the United States. It’s an effective and efficient way to access foreign stocks outside of emerging markets at a low cost with high liquidity.
SPDW’s annual expense ratio is just 0.04% – below many of its competing ex-US index funds. Moreover, its 30-day median bid/ask spread is only 0.03% with an average daily volume of more than 400,000 shares. With its inception more than 15 years ago, the portfolio features a 3–5-year EPS growth rate of 8.9%, per SSGA Funds and a forward price-to-earnings ratio well under that of the S&P 500 at 11.8. The ETF pays a 3.9% dividend yield and its largest position, Nestle S.A. is only 1.5% of the portfolio.
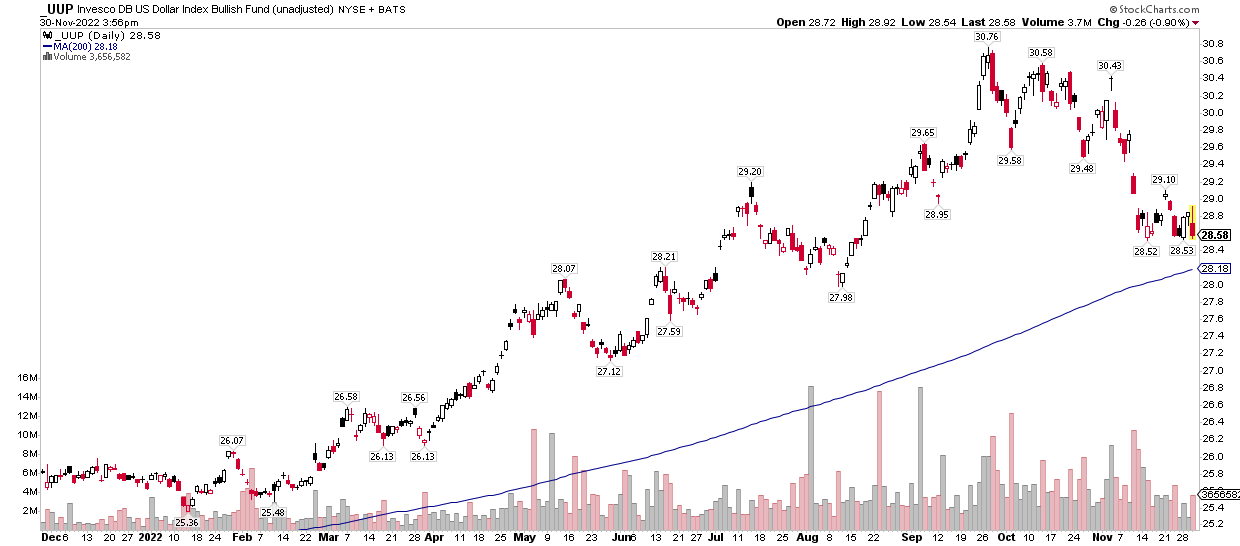
Driving ex-US outperformance was a move lower in the US dollar. The Invesco DB US Dollar Index ETF (UUP) rose to almost $31 at its peak more than two months ago, but it has since fallen back near its rising 200-day moving average – a 7% retreat and flat from early July.
US Dollar 1-Year Chart: A Material Drawdown, Testing Its 200-dma
Stockcharts.com
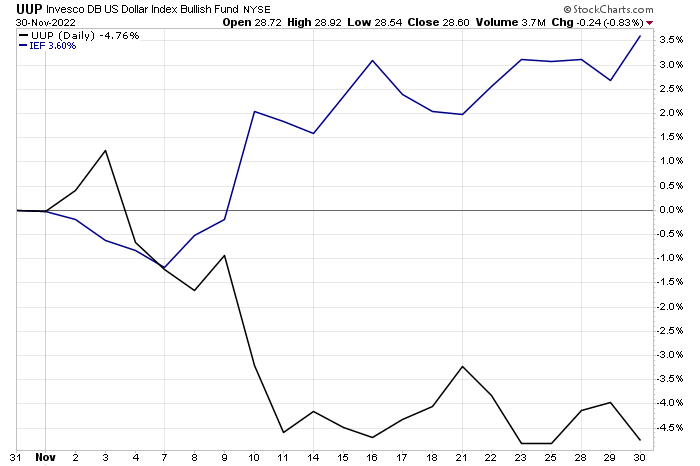
One cannot help but notice the correlation between the greenback and what’s happening with interest rates. While the dollar was down 4% in November, intermediate-term Treasuries rose 3% for the month, capped with a solid gain on Wednesday following Fed Chair Powell’s not-so-hawkish statements at an event in the afternoon.
Summing Up November: Dollar Down, Treasuries Rally
Stockcharts.com
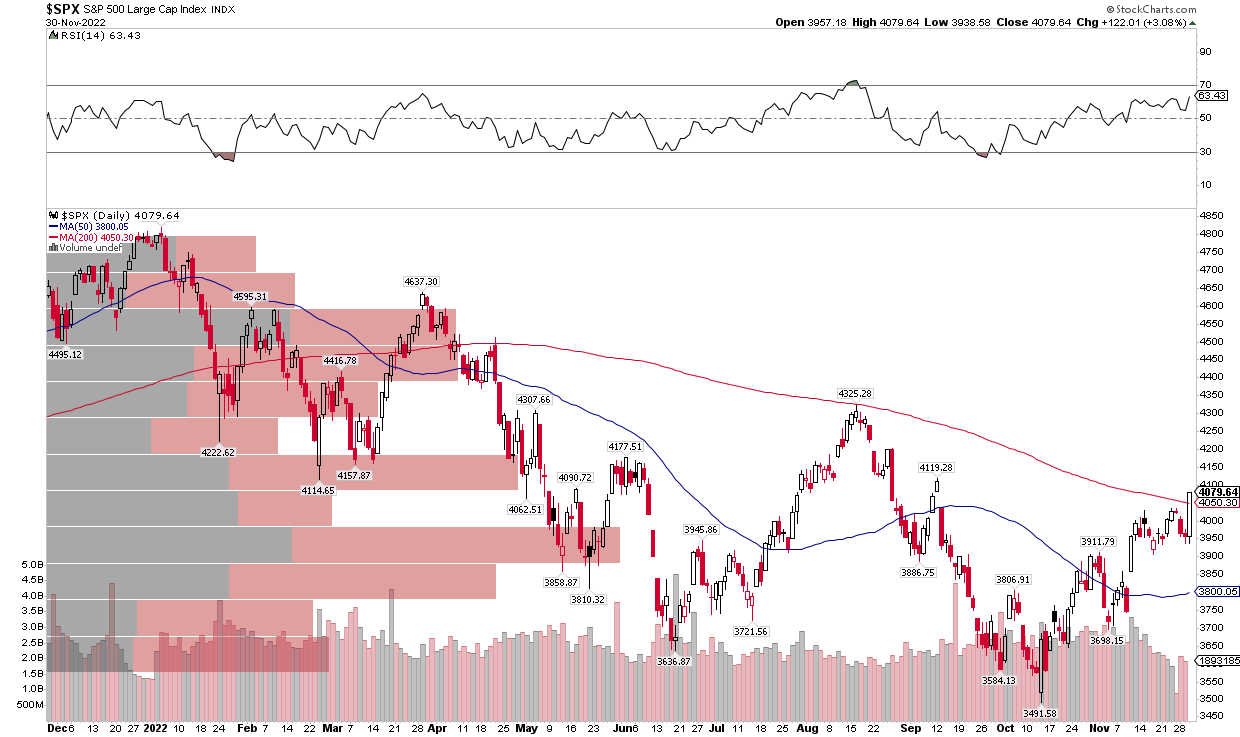
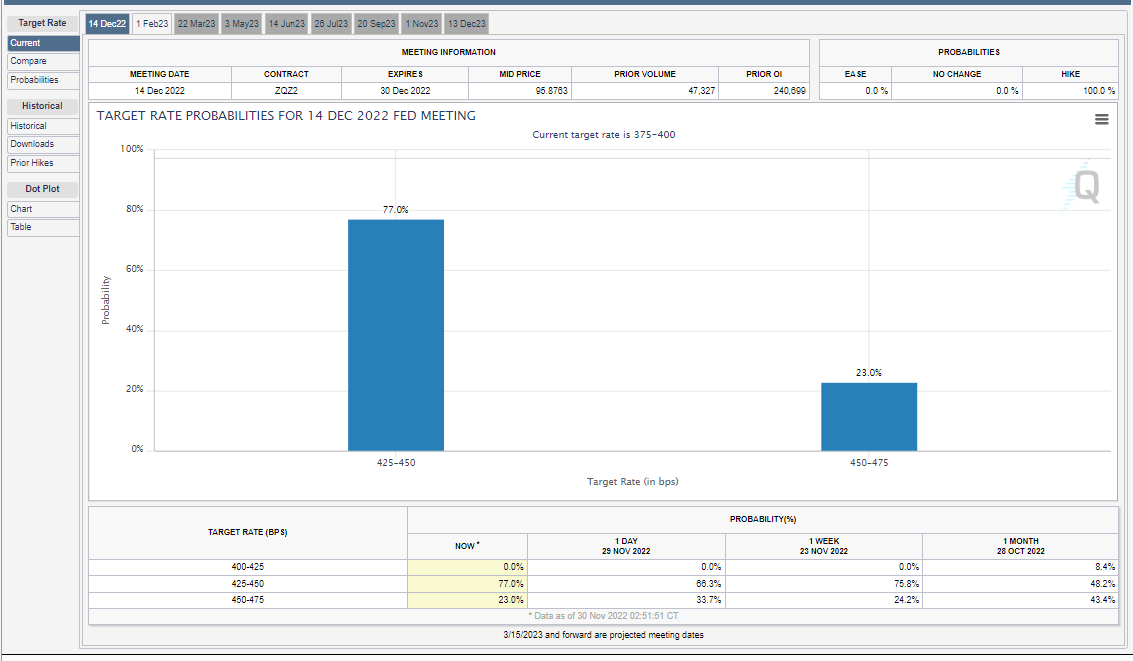
The S&P 500 soared more than 3% on the final day of the month, moving above its falling 200-day moving average for the first time since early April on a closing basis. Traders now see just a 23% chance of a fifth-straight 75 basis point rate hike in two weeks at the next Fed meeting.
S&P 500: Above Its 200-DMA For The First Time Since April
Stockcharts.com
Fed Funds Futures: Odds Of A Half-Percentage Point Hike Climb
CME Group
Sector wise, Industrials led the way last month with a 12% gain while Consumer Discretionary and Energy were just fractionally up.
November Sector Returns: Materials Lead
Koyfin
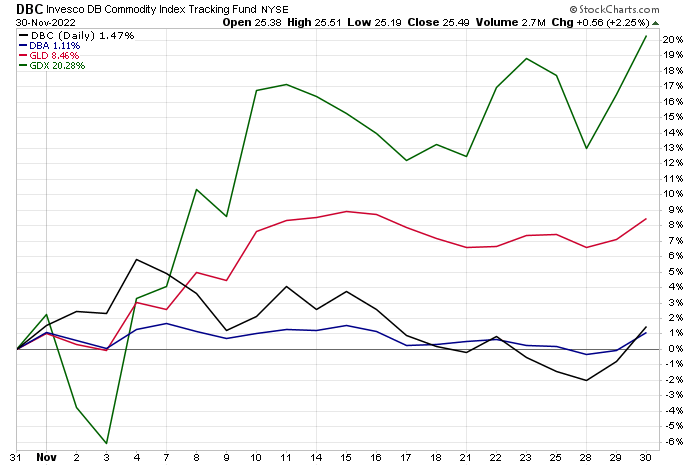
Commodities, meanwhile, had a decent November with the Invesco DB Commodity Index Tracking Fund (DBC) up 1.5% while ags were higher by just 1.1%. Oil was negative on the year at one point in the month. Shining was gold with the major gold ETF (GLD) up 8.5%. Shares of gold mining companies shot higher by more than 20% after struggling for much of 2022.
Commodities Corner: DBC Up, But Gold’s The Real Winner
Stockcharts.com
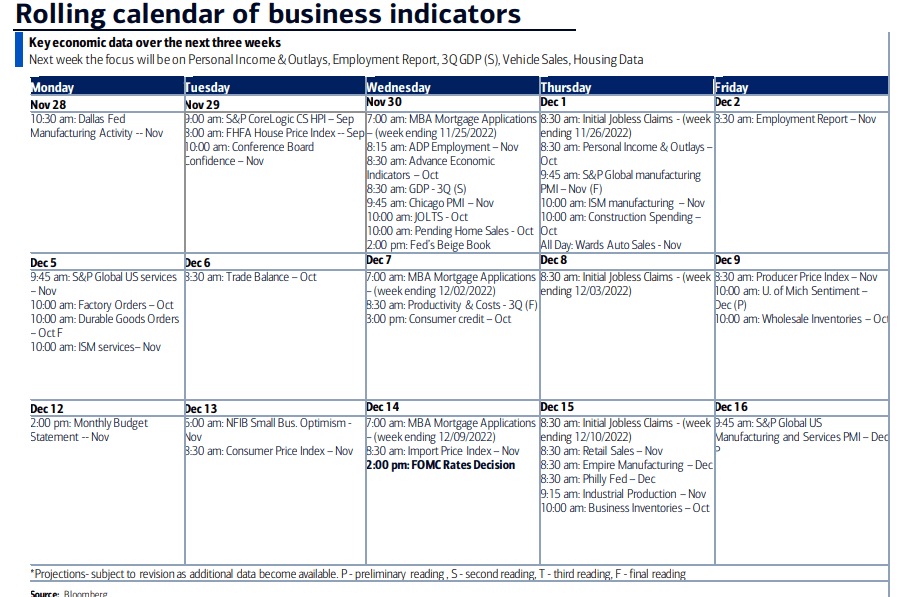
Across the economy, the October payrolls report verified near economists’ expectations while the CPI data for October was much softer than what was expected. Equities and fixed income rose big following that inflation report. All eyes now turn to this Friday’s November jobs figures and the Dec. 13 CPI report. The final Fed gathering of the year then takes place on Dec. 14.
Calendar of Key Events and Data: ISM, NFP, CPI, Fed
BofA Global Research
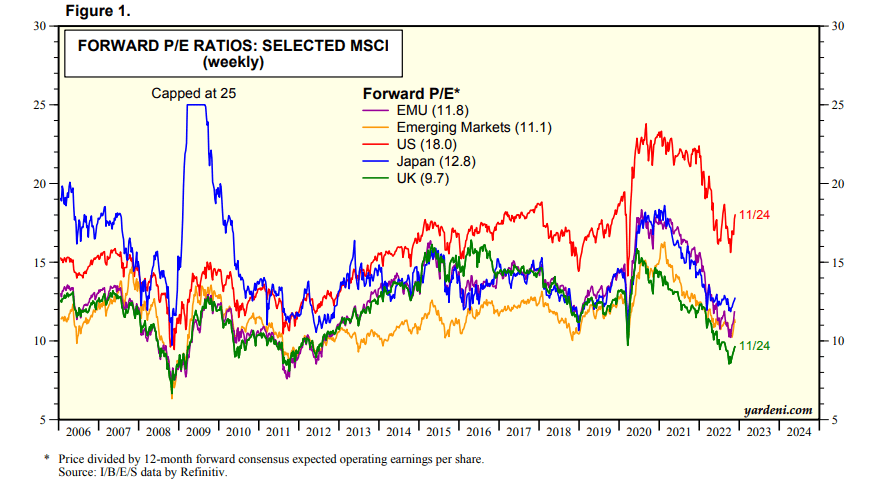
Finally, let’s look at equity valuations. While December is historically a bullish month, with the S&P 500 at 4077, it trades nearly 19 times next year’s earnings estimates following a strong finish to November. That’s a pricey level considering earnings are expected to decline next year. Value is seen overseas, though.
Global Forward P/E Ratios: US Looks Expensive
Yardeni
Be the first to comment