

adventtr
Thesis
This article is triggered by the following chart. The chart shows the dollar index going off a cliff today. To wit, it shows the dollar index literally going off a cliff from the 111 level the previous day to a bottom of around 108.4 (a drop of 2.5%). And my immediate gut feeling is that what I was seeing must be a data glitch because a daily fluctuation for a major currency at this magnitude is really rare.
It did not take too much digging to convince myself that it was not a glitch. The nose-diving of the dollar index was due to the fact that the latest CPI data showed inflation moderated to 7.7% in October, milder than expected (in a range of 8.0% to 8.2%). The core CPI also cooled to 6.3% YOY, compared to the prior expected 6.6%. Now I expect the muted CPI would provide the Fed room for smaller hikes in the future. As a result, I expect the dollar strengthening to halt or even reverse, which would in turn directly benefit precious metals.
And this leads me to the main thesis of this article. In the remainder of this article, I will use the SPDR Gold Trust ETF (NYSEARCA:GLD) and iShares Silver Trust ETF (NYSEARCA:SLV) to further illustrate the above dynamics together with a few other reasons to consider gold and silver for your portfolio now. These additional reasons include the low/negative correlation between GLD and SLV relative to all other asset classes, including bonds, stocks, and even REITs and cash. And particularly for silver, the current gold-silver price ratio offers an extremely favorable setup for a silver-gold trade.
Source: investing.com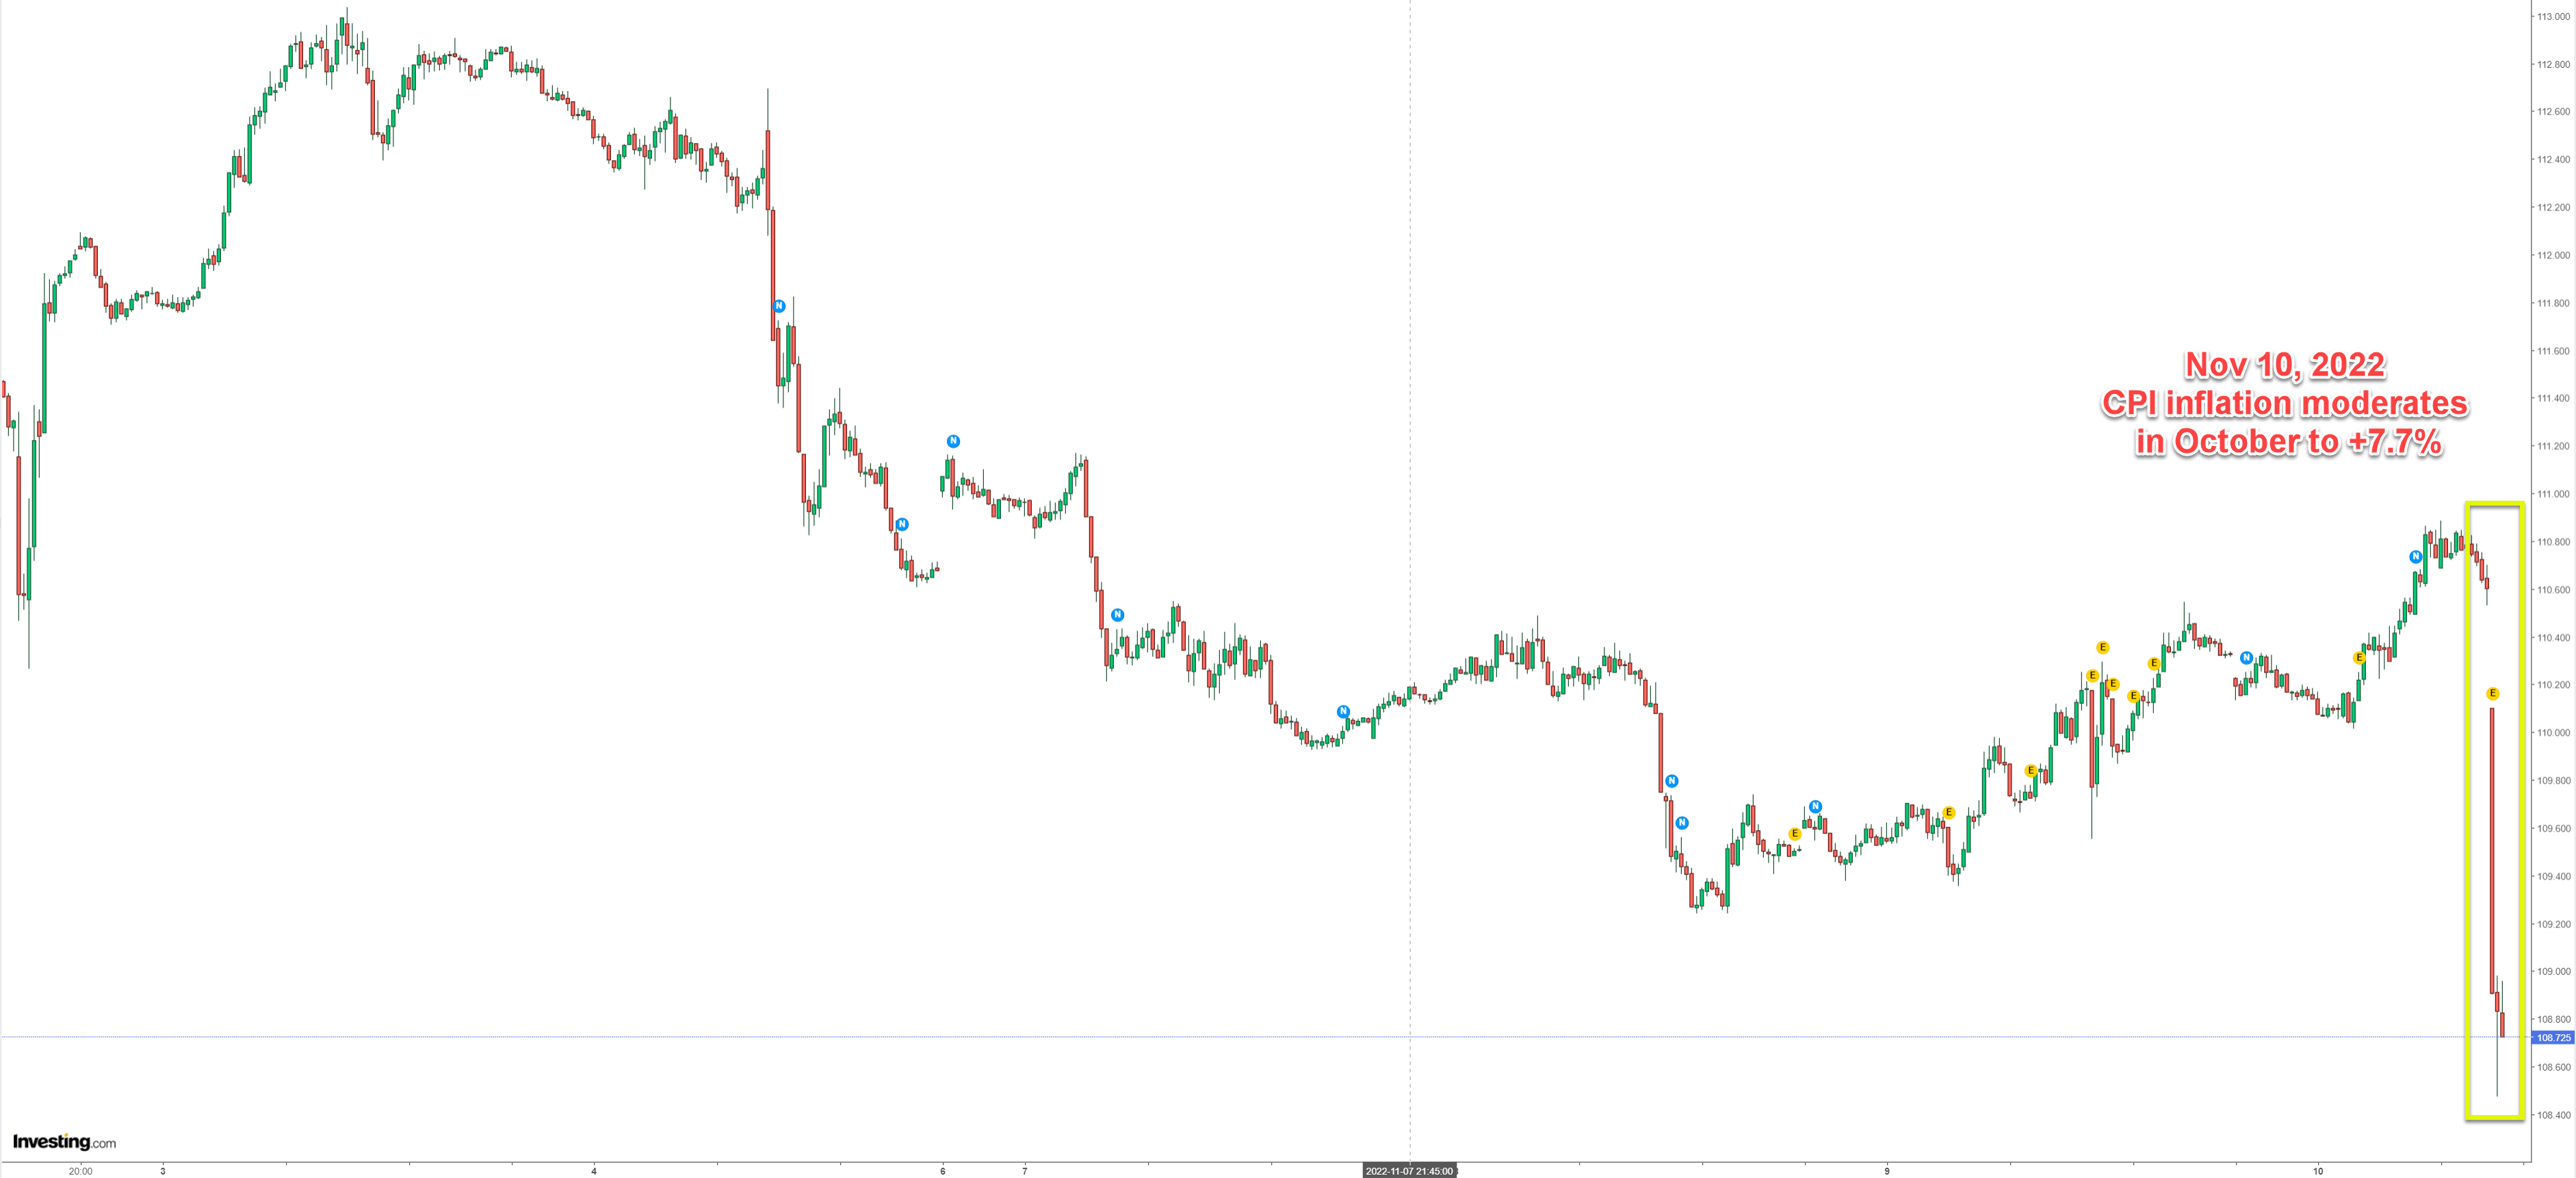
GLD and SLV: Basic information
Let’s start with a quick introduction to these funds in case some readers are new to them. The GLD and SLV are probably the most popular gold and silver ETFs, respectively. GLD is indexed to the LBMA gold price. It is the largest gold ETF fund to my knowledge with an AUM of $48.5B. SLV is indexed to the LBMA silver price, and it has a sizable AUM of $9.26B as seen.
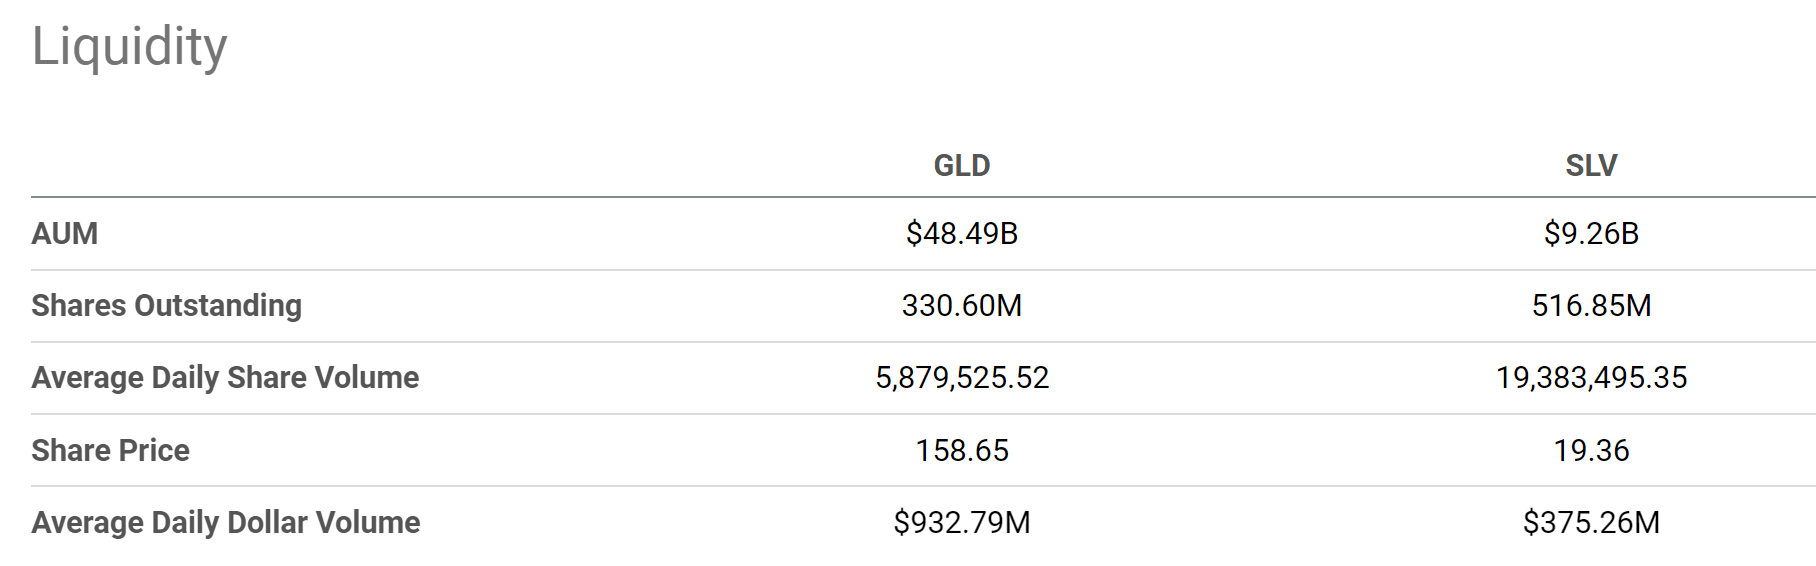
Note that GLD charges a slightly lower expense ratio of 0.4% compared to SLV’s 0.5%. Due to its larger size, GLD also offers better tradability than SLV. To wit, GLD provides an average daily volume of around $1 billion, almost 3x higher than SLV.
Source: Seeking Alpha data Source: Seeking Alpha data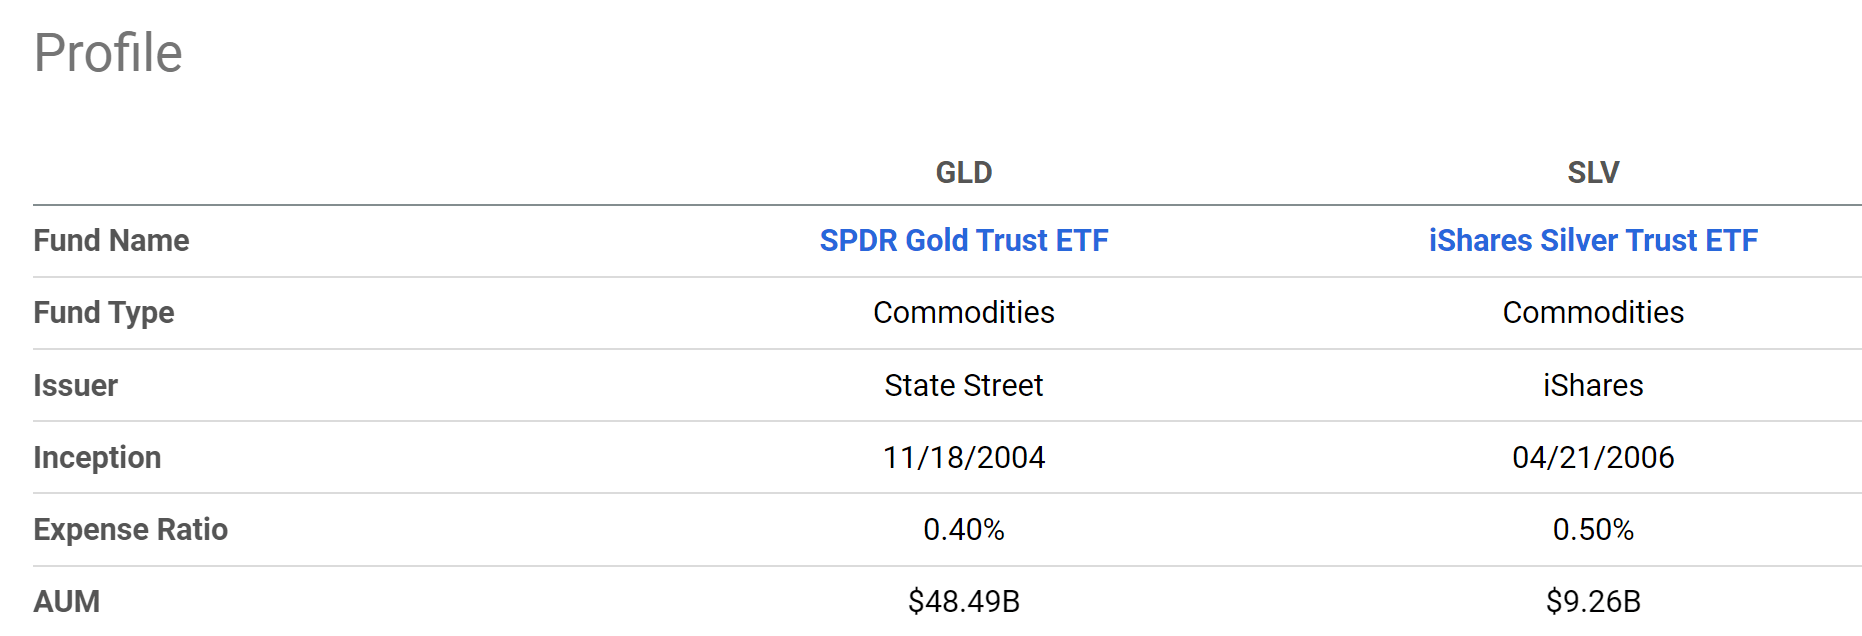
Reason 1: Dollar strengthening coming to an end
After the above quick intro, now let’s get back to the key consideration that triggered this article: the dollar index (“DI”). As aforementioned, the DI nosed dived today to as low as 108.4 and currently hovers around 108.8 as of this writing.
To provide a broader context, the next chart shows the DI in the past 4 decades. as you can see from the following chart, the DI reached a peak level of around 114 back in September 2022 at the height of the inflation concerns. The last time the DI reached 114 needs to date back all the way to 2002, about 20 years ago. The DI at that time is a whopping 26% above its 90 levels at the beginning of 2022. And as detailed in my earlier article:
A strengthened dollar index pressure silver and gold prices in two ways. First, as aforementioned, since both SLV and GLD are priced in dollars, the strengthened dollar directly and negatively impacted their prices. Secondly, as the dollar strengthens, it becomes a more attractive asset itself (for example, yields from short-term treasury notes are higher). As a result, investors would be more attracted to the dollar and less attracted to other assets including SLV and GLD.
Now, looking ahead, I see the DI strengthening is coming to an end and is about to reverse course now, at least for two reasons. The first reason is the muted CPI data that I mentioned earlier. And second, my view is that treasury rates (both short-term rates like the 1-year rates, and also long-term rates like 10+ years) have already reached their target ranges (around 4%). If the DI keeps decreasing, as it did today, GLD and SLV prices are poised to rebound because of these considerations.
Source: investing.com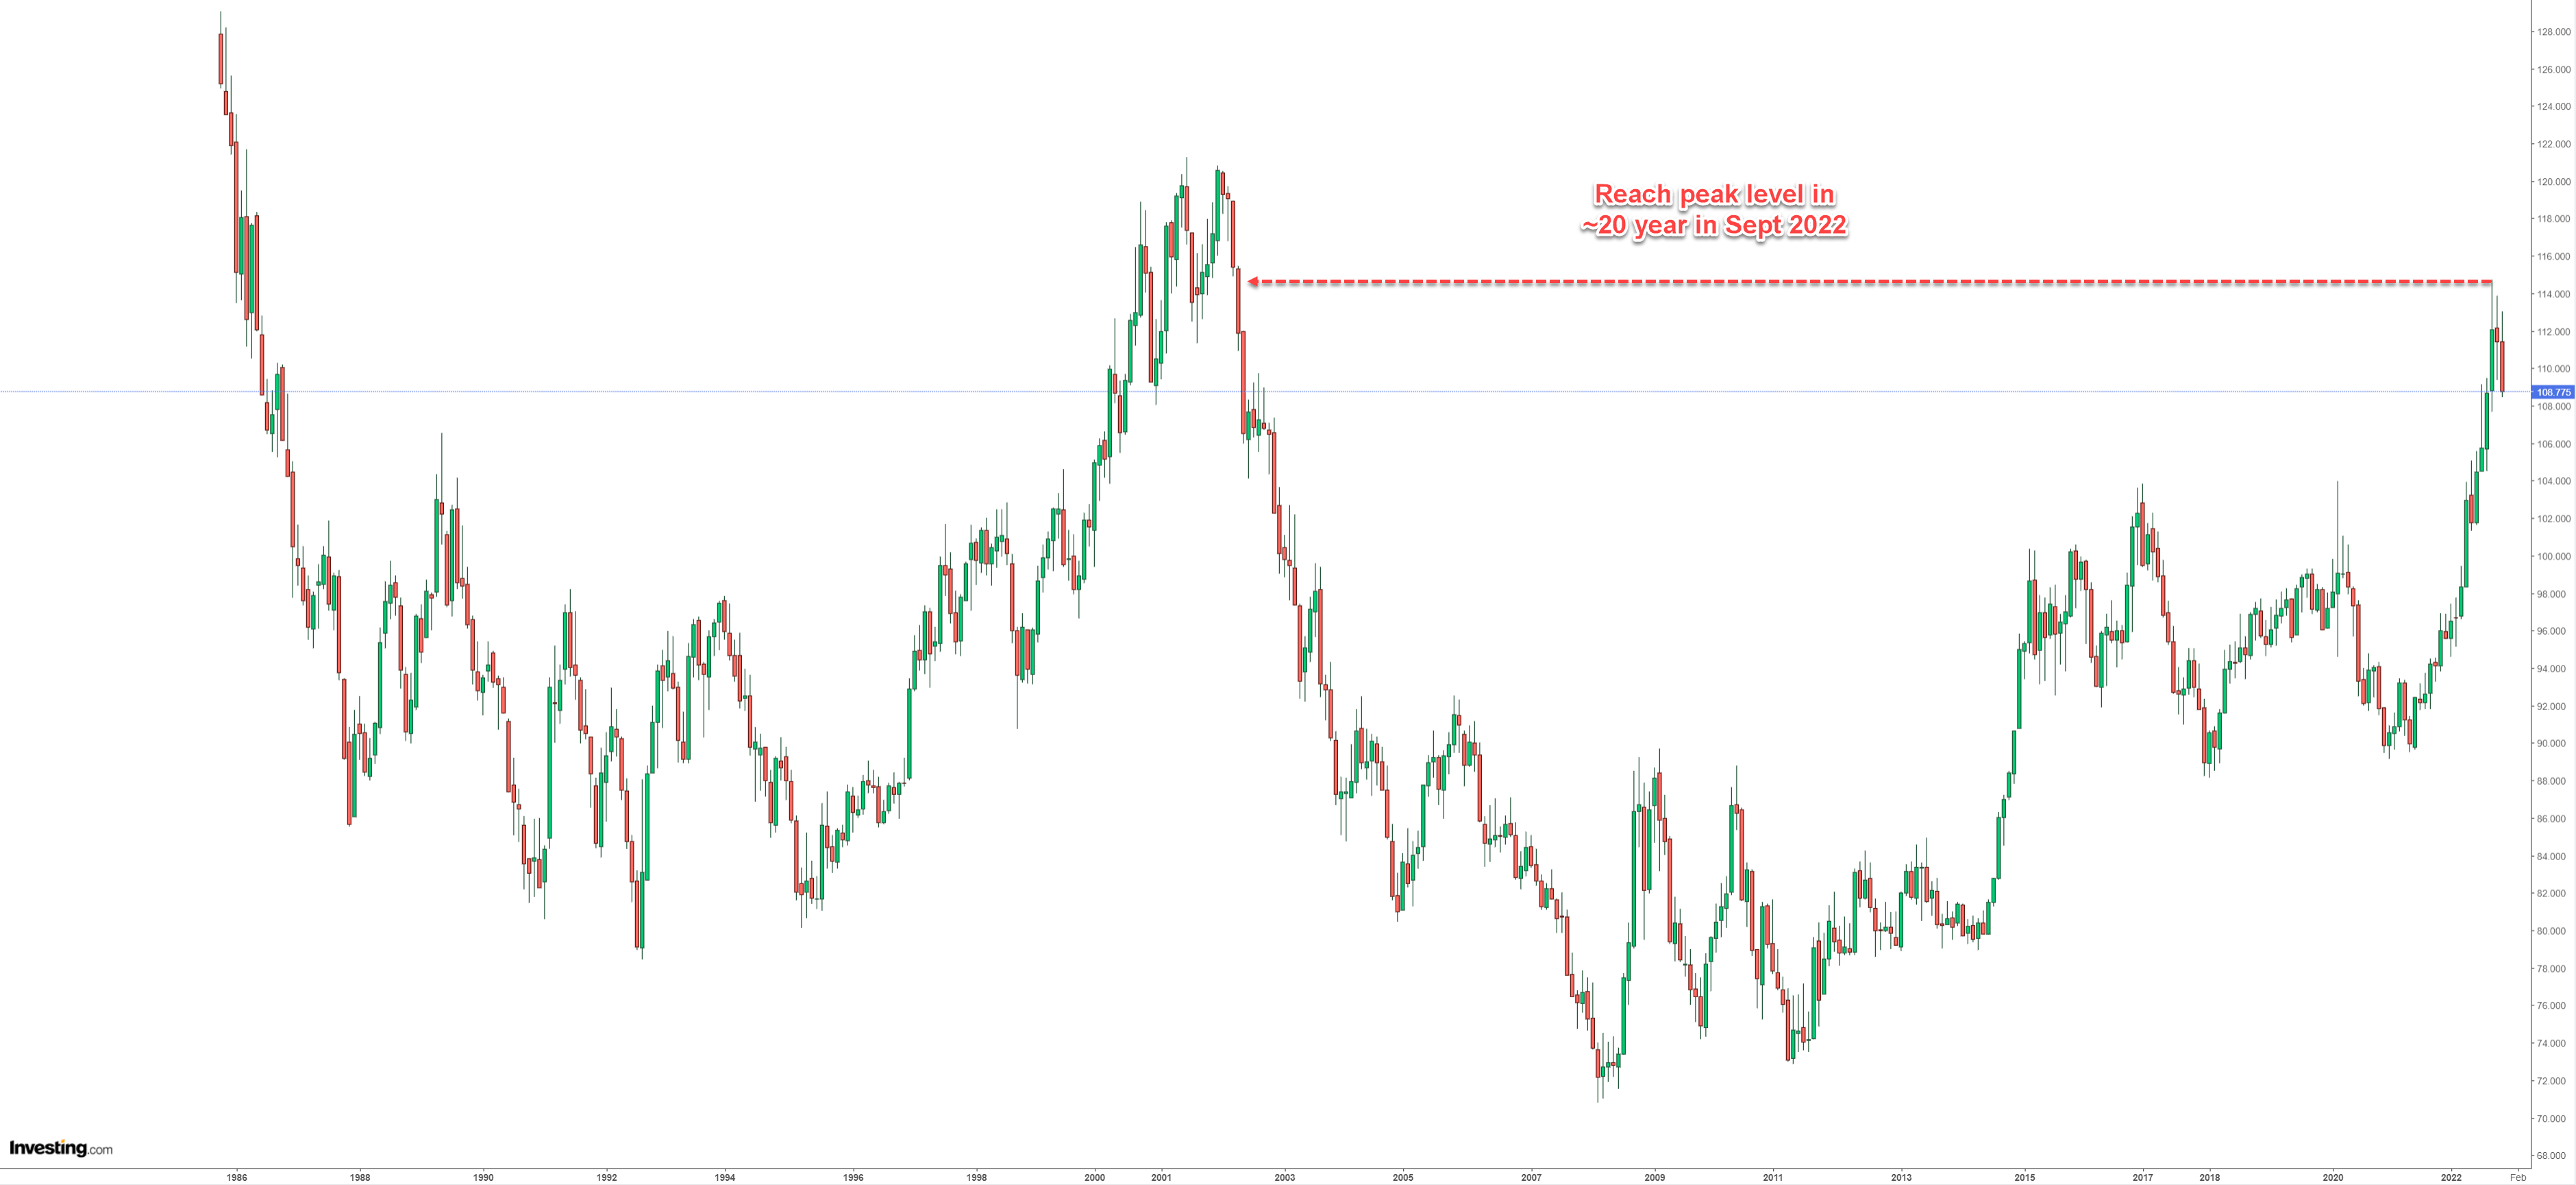
Reason 2: Excellent diversifier relative to all other assets classes
Besides a favorable prospect for short-term price appreciation due to the reasons analyzed above, both GLD and SLV are also superb diversifies in the long-term.
As you can see from the following chart, they feature low or negative correlation relative to all asset classes, ranging from bonds, equity, and even REITs and cash. To wit, for GLD, its correlation coefficient is only 0.07 relative to the overall equity market, 0.25 relative to long-term treasury bonds, 0.11 relative to REITs, and only 0.03 relative to cash. For SLV, its correlation coefficient is 0.27 relative to the overall equity market, 0.02 relative to long-term treasury bonds, 0.21 relative to REITs, and negative 0.03 relative to cash.
Source: Portfolio Visualizer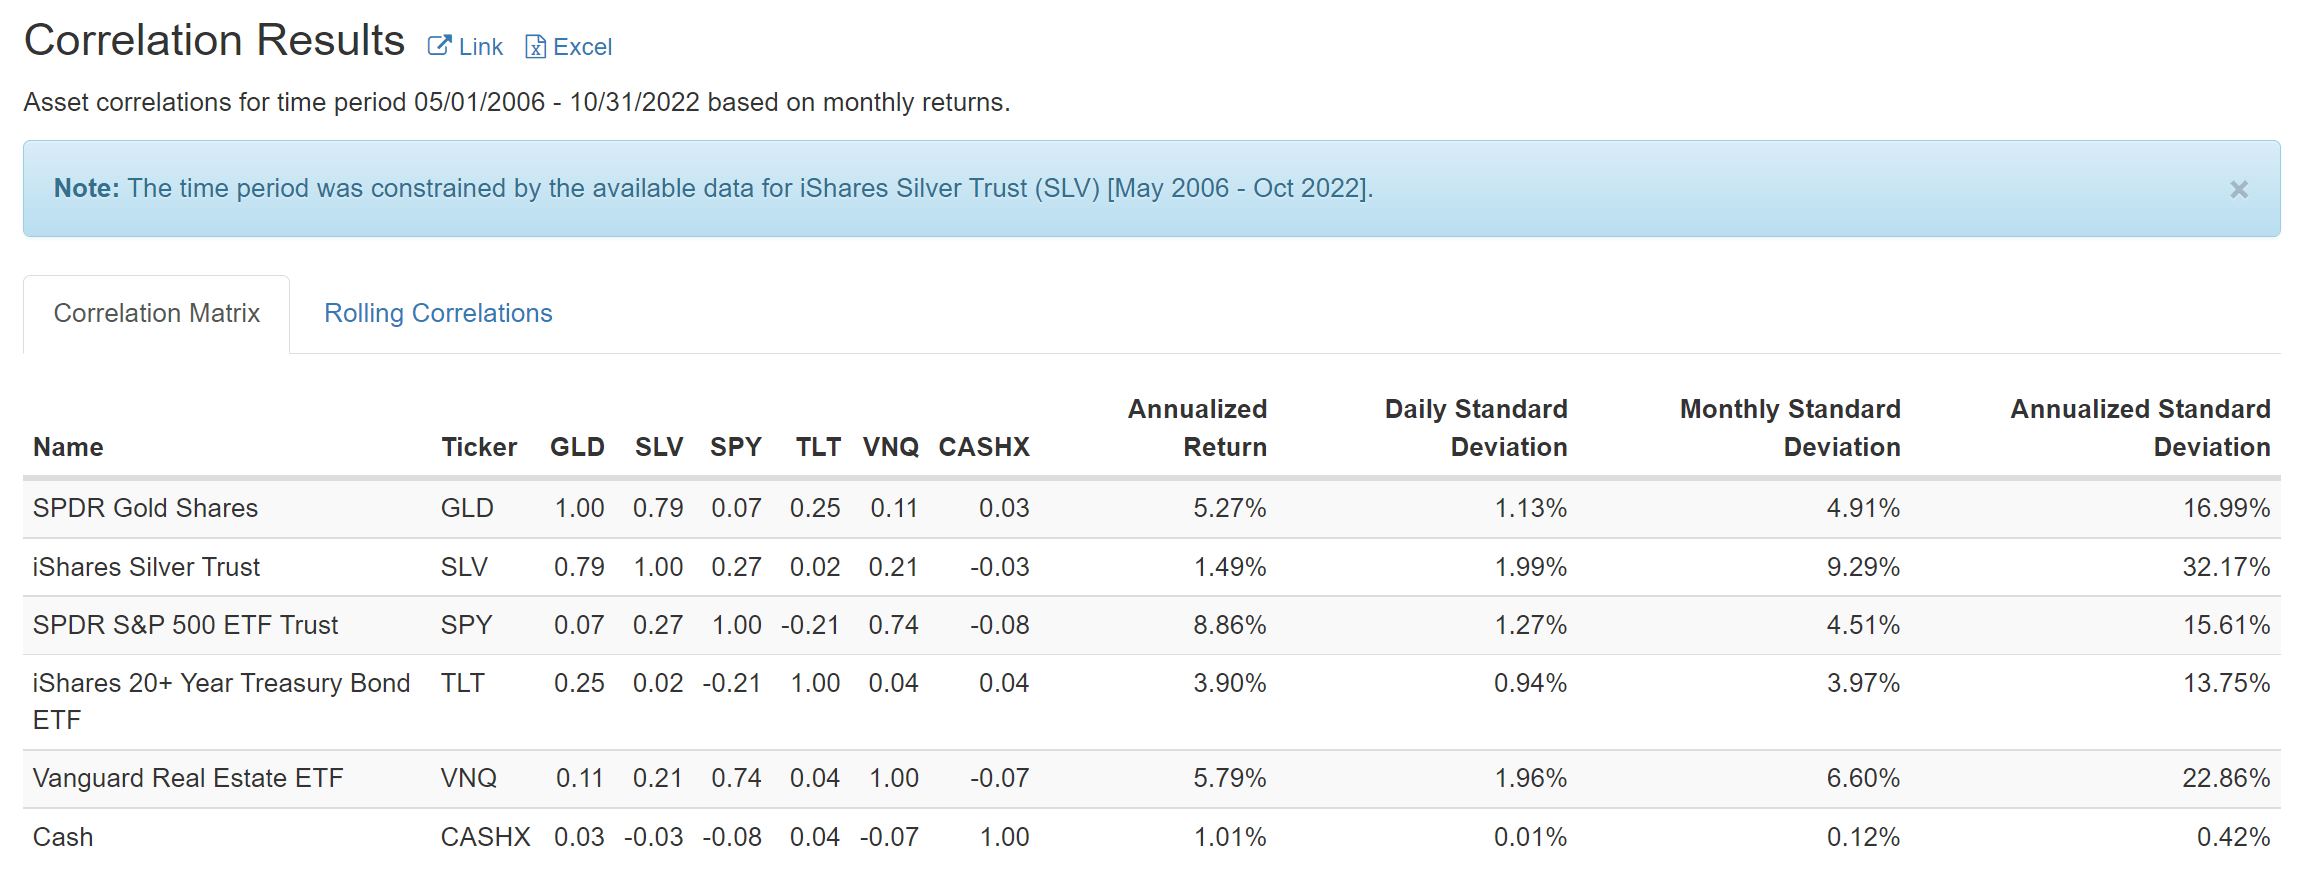
Reason 3: Silver-gold trade at most attractive levels
For readers new to the concept, the silver-gold trade refers to a strategy in that you sell a certain amount of gold to buy silver when you think the silver price is more attractive relative to the gold price, and vice versa. And the key metric to evaluate which metal’s price is more attractive involves the gold-silver price ratio (aka mint ratio, MR).
The chart below shows the MR in the past since 1980. As seen, the MR has been range-bound most of the time between ~30 and ~90. Its long-term mean is about 60. Currently, the MR is ~84.4, quite close to the upper limit of 90, and above the historical mean of 60 by about a whopping 40%.
The current MR is even more appealing when you consider the geometric average (aka logarithm average). The long-term mean of ~60 mentioned above is the so-called arithmetic mean, and the arithmetic mean begins to lose meaning when the ratio fluctuates in a large range. And an MR fluctuation of 3x (between 30 and 90) is large enough to cause this issue and it is best to consider the geometric mean in this case. To wit, the geometric MR is about 52 (estimated by multiplying 30 and 90 and then by taking the square root of the product). The MR of 84.4 is 62% above the geometric mean, indicating an even more attractive silver pricing relative to gold than the arithmetic mean suggests.
We started a silver-gold trade in our account in 2018 when the MR pushed past 85. As you can see, since then, the ratio surged to 100+ in 2020 (during which our trade lost money and we accumulated more silver). The MR then came back to a bottom near 63 in 2021 and our gains were more than enough to offset the losses between 2018 and 2020.
Source: Author based on Seeking Alpha data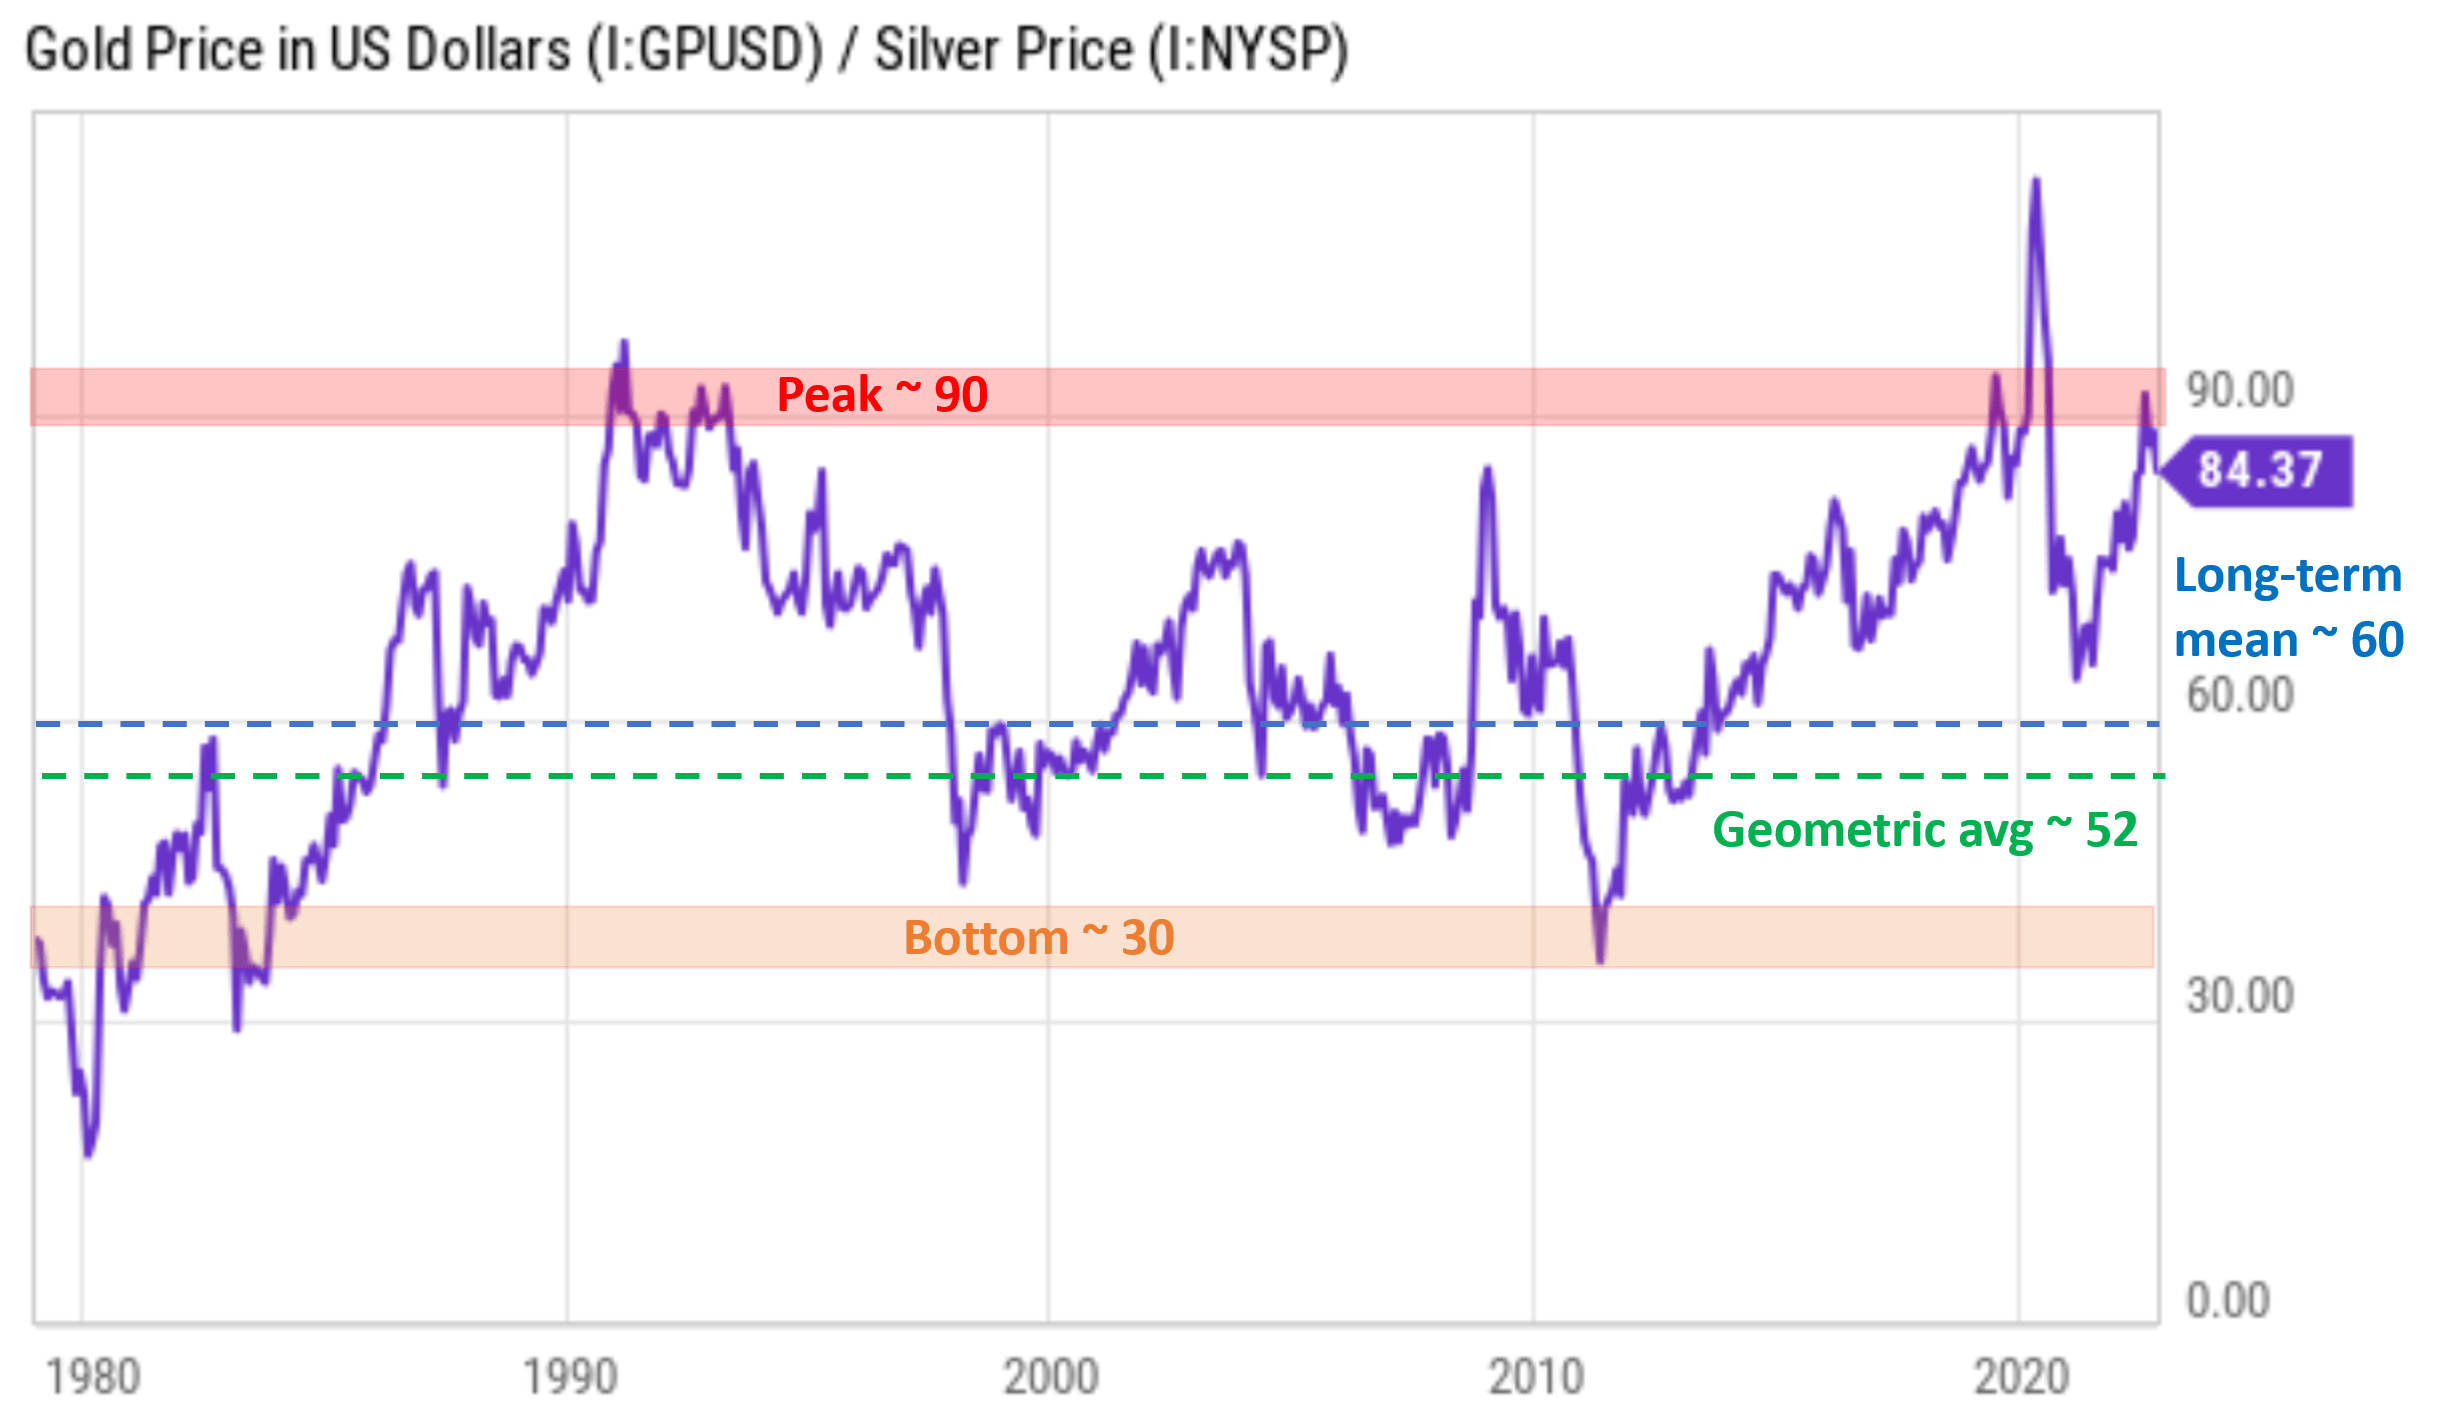
Risks and final thoughts
Investing in GLD and SLV, or precious metals in general, entails a few key risks. First, capital gains are taxed at a higher bracket. Investment in a gold and silver ETF that is backed by physical bullion (and both GLD and SLV are) is treated as ownership of physical gold or silver. And the capital gains are taxed at the maximum tax rate of 28% or 29.6% rate as collectibles instead of the normal capital gain tax rates. Secondly, both SLV and GLD charge relatively high expense ratios (0.5% and 0.4%, respectively if you recall). We ourselves hold Aberdeen Standard Physical Silver Shares ETF (SIVR) for our silver exposure, and we hold iShares Gold Trust ETF (IAU) for our gold exposure. They are smaller funds compared to SLV and GLD, respectively. But they charge lower fees of 0.3% and 0.25%, respectively. We are not active traders, and we only update our positions on a monthly basis. Hence, the lower fees can benefit us more than the trading spreads can hurt us.
To conclude, now is an excellent time to consider adding gold and silver to your portfolio. And both the GLD and SLV EFT provides two convenient vehicles to gain exposure. There are at least three reasons supporting a bull case for gold and silver under current conditions. First, there are strong signs indicating that DI strengthening is coming to an end, such as the lower-than-expected CPI data and treasury rates approaching their long-term targets. Second, in addition to near-term price appreciation potential, both GLD and SLV are also superb diversifies in the long term. And finally, the current MR offers an extremely attractive setup to start a gold-silver trade. The MR ratio is at 84.4, close to the upper bound of 90. We are holding silver at our ceiling level (at a 4:1 ratio relative to gold) as a result. We will monitor the MR closely and provide updates when we adjust our allocations.
Be the first to comment