

Andrii Yalanskyi/iStock via Getty Images
There are only two Farmland REITs, and they are still very small, but together they have outperformed the REIT average thus far this year, losing just -0.21%, compared to the equity REIT index of -15.40%.
Hoya Capital Income Builder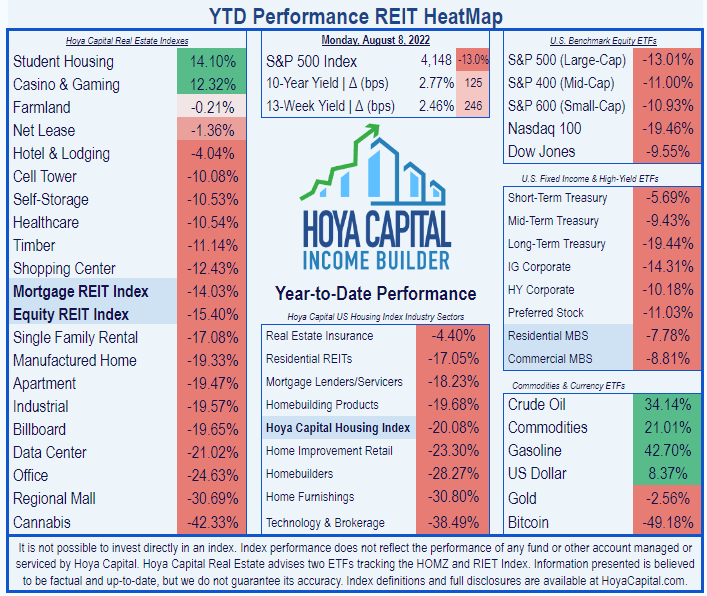
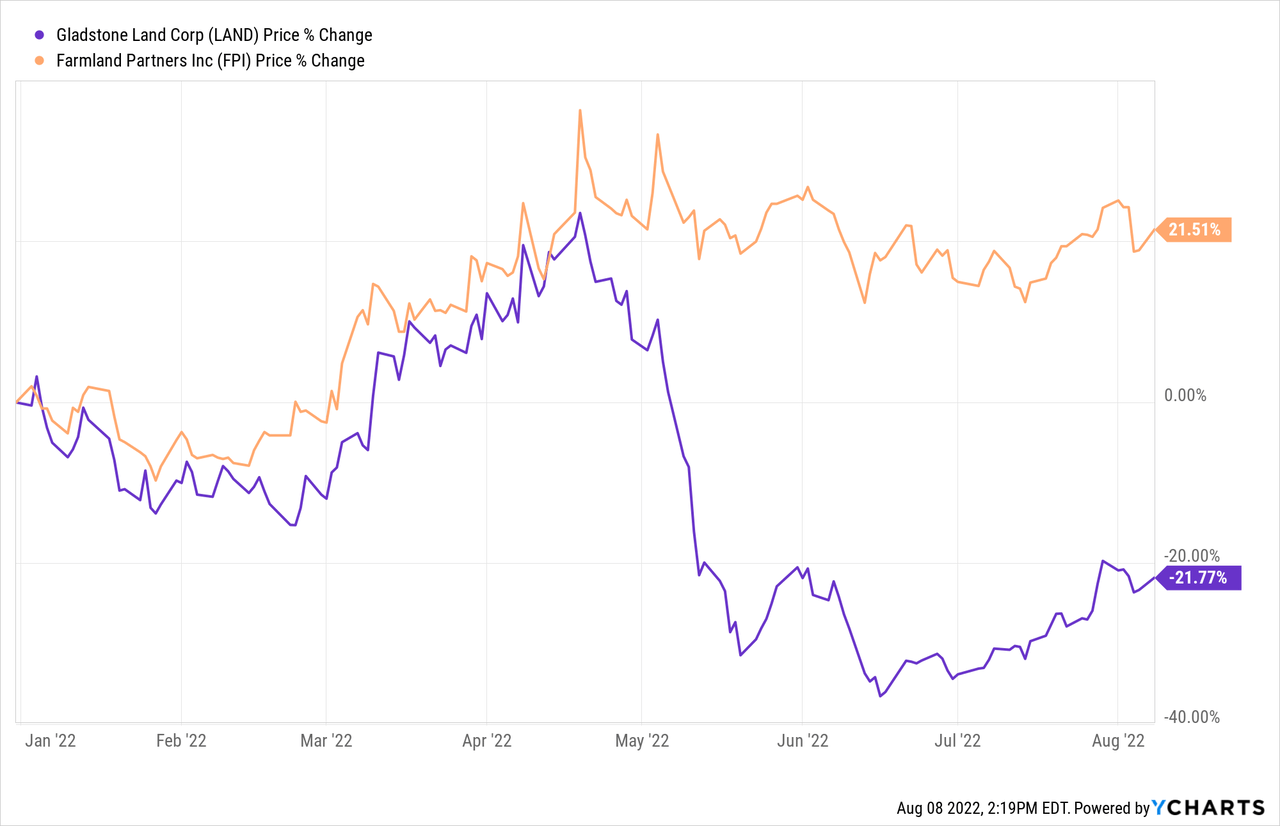
However, Gladstone (NASDAQ:LAND) has badly lagged its farmland REIT competitor Farmland Partners (FPI). FPI has been a stellar investment, with a total return of +21.51% YTD (year to date), compared to Gladstone Land, their mirror image at -21.77%.
What makes Gladstone tick, and what does the future hold for this small-cap REIT? This article examines growth, balance sheet, dividend, and valuation metrics, to shed light on the path ahead.
Meet the company
Gladstone Land
Founded in 1997, Gladstone Land went public as a REIT in 2012. David Gladstone has been chairman and CEO since the company’s inception. LAND buys well-watered, high-value farmland, typically fruit and vegetable producers, orchards, and vineyards, and leases the land to corporate and independent farmers on a triple-net basis. It is the modern version of sharecropping. Sellers can opt to receive shares of LAND instead of cash as payment.
Leases range from 3 to 15 years, with options to extend. The weighted average remaining lease term is 6.5 years. Lease expirations average about 7.5% of annual base lease revenue per year for the next 5 years.
Company investor presentation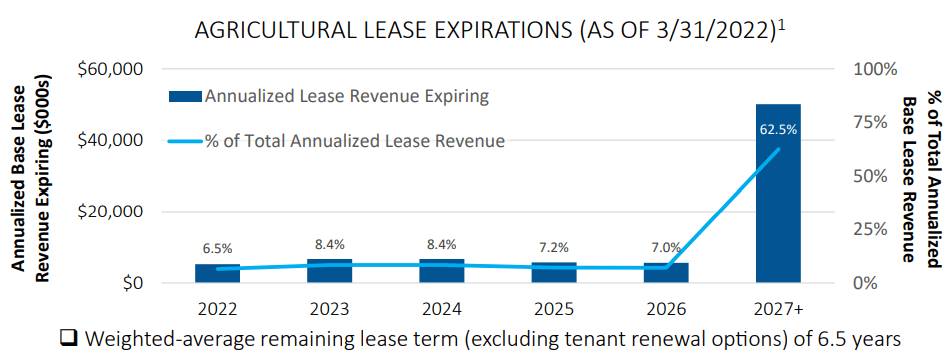
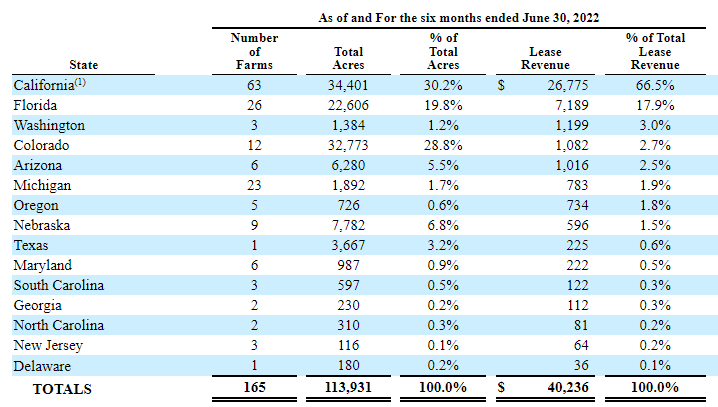
Gladstone currently owns 162 farms totaling 113,000 acres, spread across 15 U.S. states. The average farm size is just shy of 700 acres, and the portfolio is leased to 86 different tenants, with occupancy of 100%. States where Gladstone has corporate offices are shown in blue on the map below. Farm clusters are shown as yellow stars.
Company investor presentation Geographic Distribution of LAND Assets (Company 10-Q)
Gladstone focuses on farmland growing fresh produce (e.g., fruits and vegetables) and certain permanent crops (e.g., blueberries and nuts), because they expect such lands to deliver:
- higher profitability and rental income,
- lower price volatility,
- lower government dependency, and
- lower storage costs.
Also, such ground is typically closer to major urban populations, enhancing development possibilities.
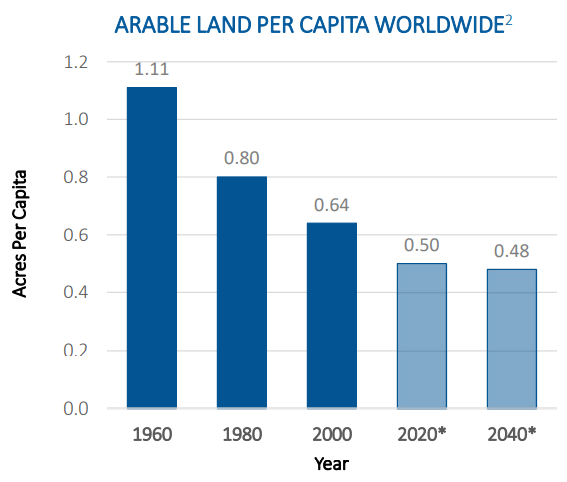
Farmland investment makes sense at the most fundamental possible level, as the world population continues to grow, and the supply of arable land continues to shrink.
Company investor presentation Company investor presentation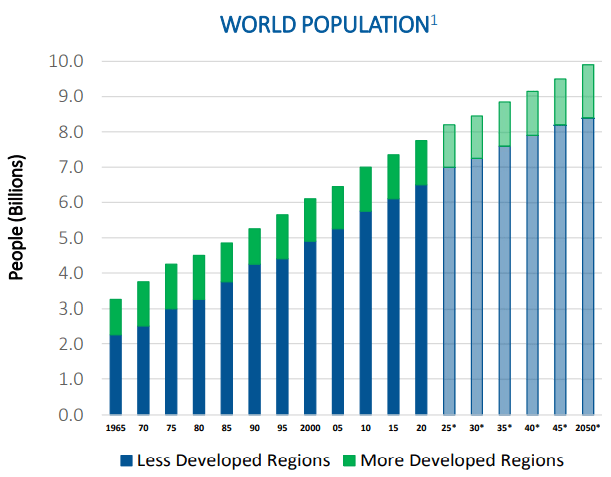
Though more volatile than bonds, farmland investing is less volatile than stocks, as measured by the S&P 500, or REITs, according to NCREIF (the National Council of Real Estate Investment Fiduciaries).
Company investor presentation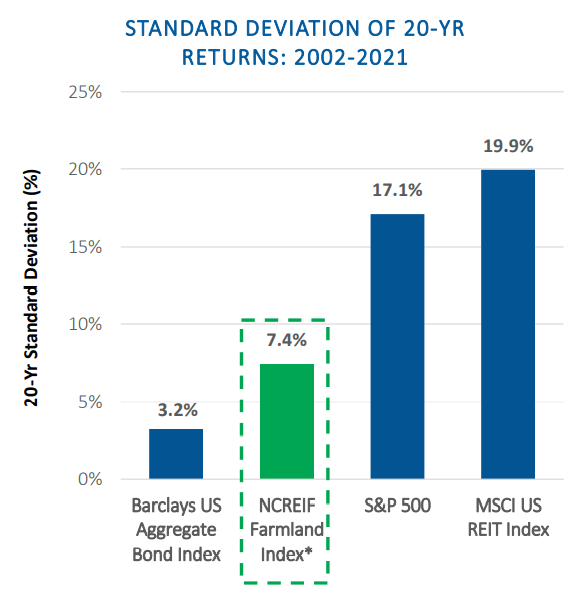
Although Gladstone is a Farmland REIT, farmland bears a near-zero correlation with equity REITs over the past 20 years, according to the Center for Farmland Research. However, while farmland itself may be low in volatility, stock in Gladstone Land is not. The historic volatility of LAND stock according to TD Ameritrade is 41.2%, almost double that of the average REIT (24.3)%.
Farmland is an asset class of its own, with very low correlations to stocks, bonds, and gold.
Company investment presentation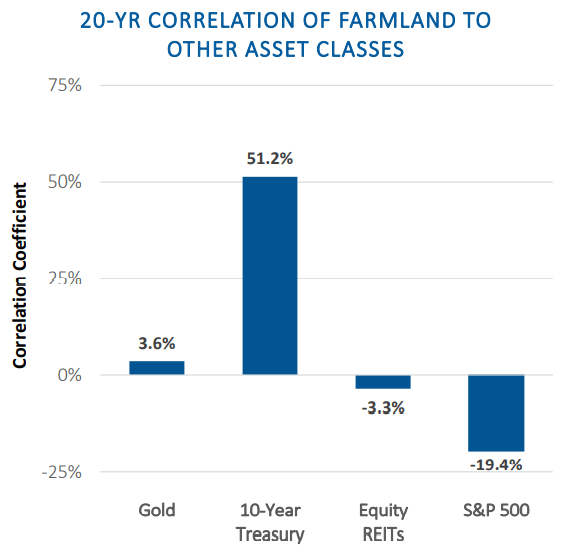
With just 164 farms thus far, LAND has barely scratched the total farmland market, as there are about 3,000 top-tier farms in vegetables and produce, and 6,625 top-tier farms in permanent crops, according to the U.S. Department of Agriculture. Thus Gladstone’s market penetration is only about 1.7%.
Company investment presentation
Of the estimated $2.7 trillion worth of U.S. farmland, about 6 out of every 7 acres are still in the hands of families, but 40% of the land is farmed by tenants.
Company investor presentation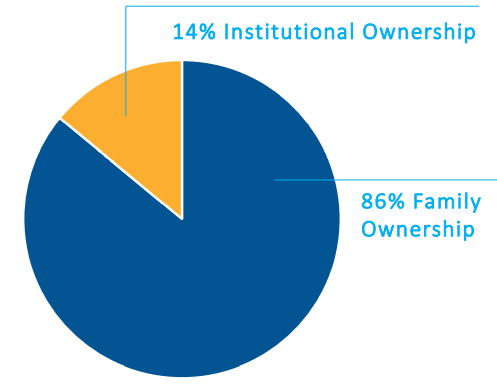
However, tellingly, farming is an old man’s game at this point. The average farmer is 58 years old, and over 60% of farmers are over 55.
Farmland devoted to fresh produce provides a measure of inflation protection and pricing power, as the annual CPI (Consumer Price Index) of fresh fruits and vegetables has risen faster over the past 40 years than the overall CPI or the CPI for food and beverages as a whole, according to the Bureau of Labor Statistics.
Company investor presentation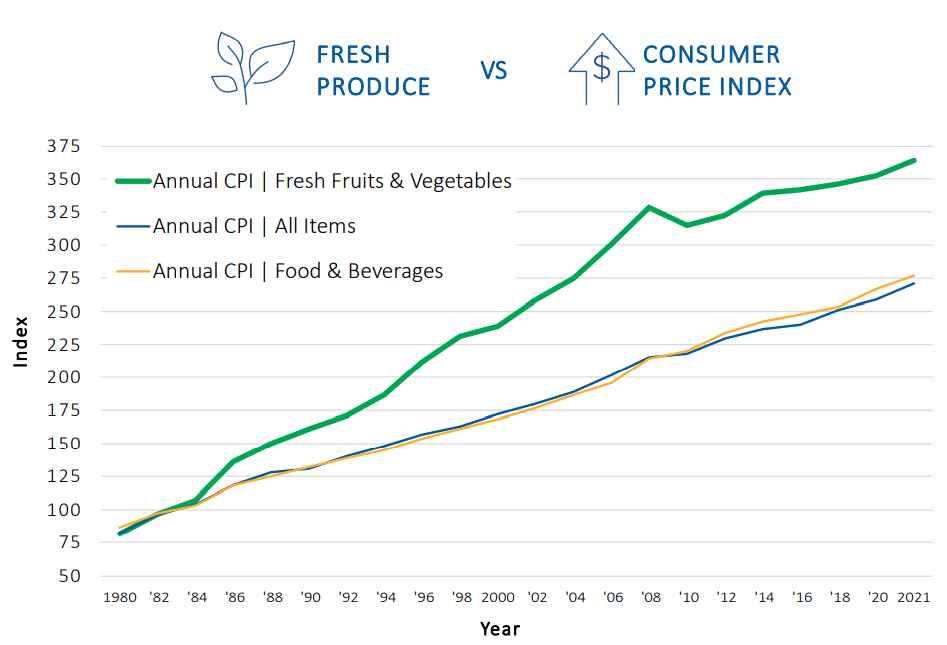
Since Q1 earnings were announced, Gladstone has acquired:
- a 1,374-acre olive orchard in California at a cost of $24.5 million, and leased it back for 15-years on a triple-net basis to California Olive Ranch, reported to be the largest miller of olives for extra virgin olive oil in the U.S., and
- 1,300 acres of farmland in Washington and Oregon, for approximately $37.3 million, from Horizon Vineyards, an affiliate of Resource Land.
Quarterly results
Here are the highlights for Q2 2022, according to the company’s 10-Q :
- Total operating revenue of $20.3 million, up 20% YoY (year-over-year)
- 1H 2022 operating revenue of $40.2 million, up 22.2% YoY
- Total operating expenses of $12.2 million, up 28% YoY
- 34.5 million shares outstanding, up 17.6% YoY
- NOI (net operating income) of $8.1 million, up 9.9% YoY
- Net income of just $613 thousand, up from (-$531 thousand) YoY
- TCFO of $19.4 million, up 14.1 % YoY
- FFO of $48.2 million, up 24.6% YoY
- FFO per share of $0.14, up one penny (7.7%) YoY
- Estimated NAV per share of $15.60
Growth metrics
Here are the 3-year growth figures for FFO (funds from operations), TCFO (total cash from operations), and market cap.
| Metric | 2019 | 2020 | 2021 | 2022* | 3-year CAGR |
| FFO (millions) | $10.41 | $14.49 | $21.01 | $22.82 | — |
| FFO Growth % | – | 39.2 | 45.0 | 8.6 | 29.90% |
| FFO per share | $0.54 | $0.65 | $0.69 | $0.66 | — |
| FFO per share growth % | — | 20.4 | 6.2 | (-4.4) | 6.92% |
| TCFO (millions) | $21.37 | $25.00 | $32.38 | $38.71 | — |
| TCFO Growth % | — | 17.0 | 29.5 | 19.5 | 21.90% |
| Market Cap (billions) | $0.27 | $0.38 | $1.15 | $0.89 | — |
| Market Cap Growth % | — | 40.7 | 202.6 | (-22.6) | 48.82% |
* Estimated, based on figures for H1 2022
Source: TD Ameritrade, CompaniesMarketCap.com, and author calculations
Prior to this year, LAND’s 3-year growth in FFO, TCFO, and market cap were utterly jaw-dropping, but FFO/share growth, while strong, has not been in the same category. This means the company is issuing an unusually large number of new shares every year. Share count has increased by 17.6% over the past 12 months alone. As we will see below, when we look at Valuation Metrics, they have every incentive to continue doing that.
While cash flow continues to grow at a healthy pace, this year’s FFO growth has slowed considerably, and FFO/share and market cap are in danger of taking a step backward.
Despite its meteoric growth in market share, LAND is still a small-cap, yet to cross the $1.4 billion threshold where it reaches escape velocity. Though too small to qualify as a FROG, Gladstone Land is definitely a Tadpole with legs.
Meanwhile, here is how the stock price has done over the past 3 twelve-month periods, compared to the REIT average as represented by the Vanguard Real Estate ETF (VNQ).
| Metric | 2019 | 2020 | 2021 | 2022 | 3-yr CAGR |
| LAND share price Aug. 8 | $11.68 | $16.50 | $23.78 | $26.43 | — |
| LAND share price Gain % | — | 41.3 | 44.1 | 11.1 | 31.29% |
| VNQ share price Aug. 8 | $90.96 | $82.39 | $106.91 | $98.20 | — |
| VNQ share price Gain % | — | (-9.4) | 29.8 | (-8.1) | 2.59% |
Source: MarketWatch.com and author calculations
LAND shares have sold off sharply since April. From a high of $42.10 on April 20, the price plunged to $21.23 on June 16. That’s a loss of (-49.6)% in under two months, from which shares have only slightly recovered.
Seeking Alpha Premium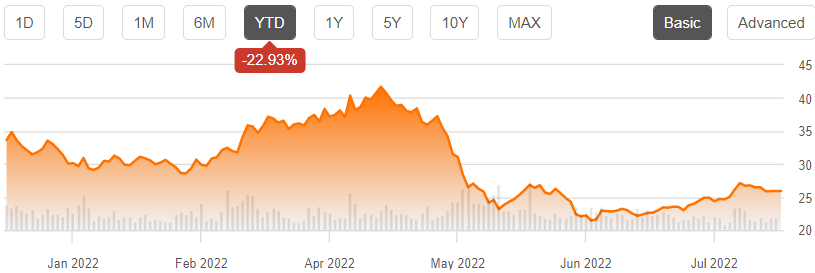
Despite the sharp sell-off, LAND has easily outpaced the VNQ in each of the past 3 years, and has rewarded investors with an annual average of 31.29% share price growth, compared to just 2.59% for the VNQ.
In its 10 years in operation, LAND has grown its holdings approximately 20-fold.
Company investor presentation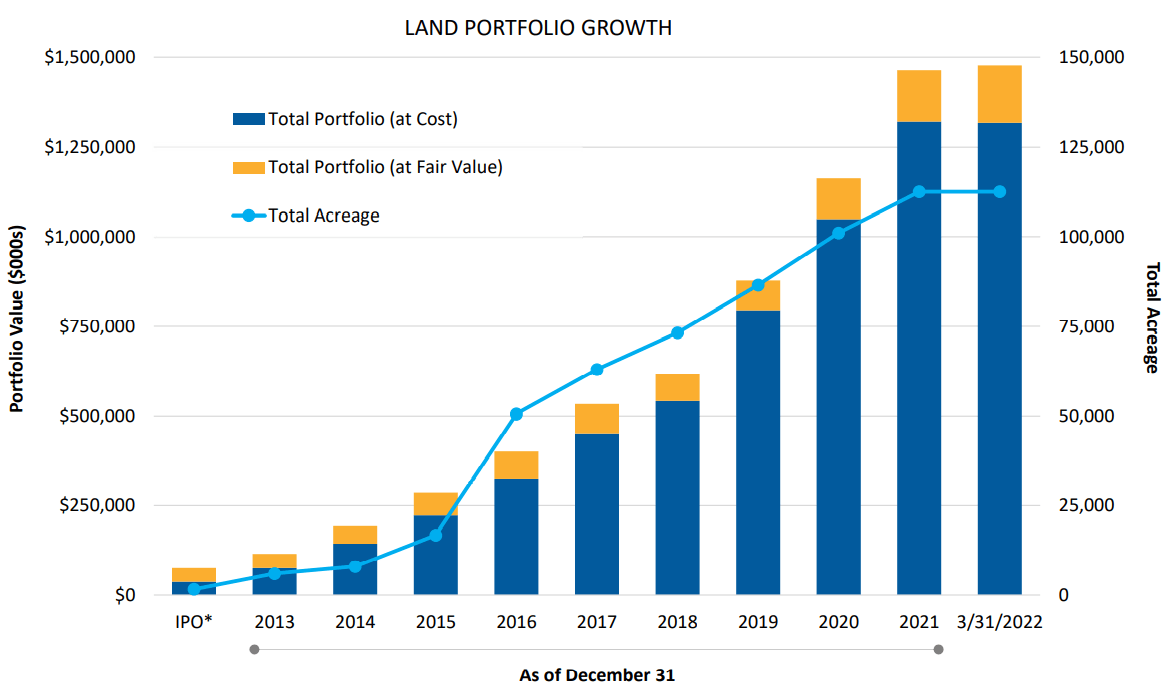
The company’s return on equity has been just 0.79% over the past 12 months, however, even while assets have grown 22.15%.
Balance sheet metrics
Here are the key balance sheet metrics.
| Company | Liquidity Ratio | Debt Ratio | Debt/EBITDA | Bond Rating |
| LAND | 1.86 | 33% | N/A | — |
Source: Hoya Capital Income Builder, TD Ameritrade, and author calculations
Gladstone Land has an abysmal 10 times more long debt than EBITDA (1088%), according to Seeking Alpha Premium, so it will be hard for them to make their debt payments without issuing more shares, restricting the dividend, or selling assets.
Debt maturities are in their favor in the short run, however. Only an average of about 5% of Gladstone’s debt comes due each year for the next 5 years.
Company investor presentation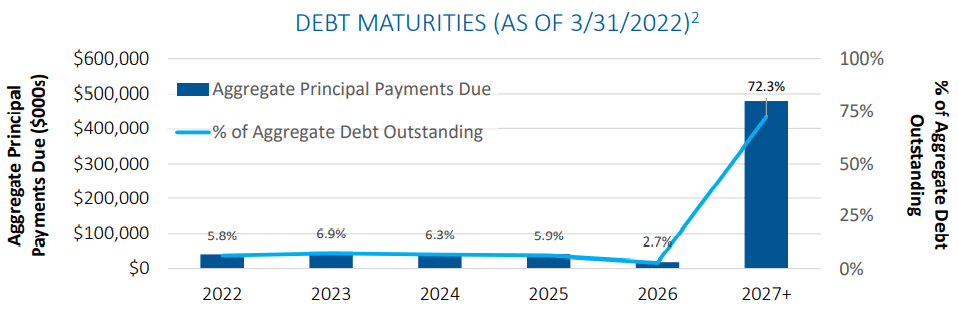
Gladstone’s notes and bonds have a weighted-average term to maturity of 9.7 years. All of its debt is held at fixed rates, with a weighted-average remaining term of 5.4 years, and a weighted-average interest rate of 3.25%.
The company’s capital structure consists mainly of 56.9% common equity, 27.7% fixed-rate debt, and 12.6% preferred equity. The remaining 2.8% is term preferred stock. Gladstone Land was holding $48.4 million in cash as of June 30.
Company investor presentation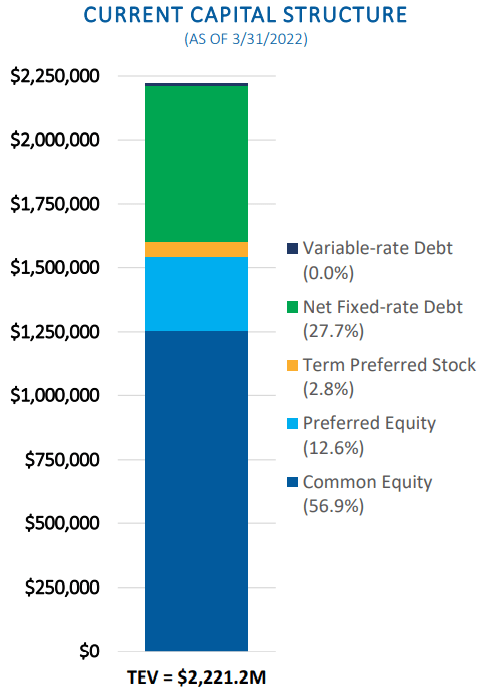
Dividend metrics
Farmland REITs are low-yielding, and they do not make up for it with dividend growth, which is also below REIT average. Despite being low-yielding, LAND’s dividend is barely safe at D+. This is definitely not an income play.
| Company | Div. Yield | 3-yr Div. Growth | Div. Score | Payout | Div. Safety |
| LAND | 2.07% | 1.1% | 2.12 | 70% | D+ |
Source: Hoya Capital Income Builder, TD Ameritrade, Seeking Alpha Premium
Dividend Score projects the Yield three years from now, on shares bought today, assuming the Dividend Growth rate remains unchanged.
Valuation metrics
LAND’s price/FFO is stratospheric at 36.2. Shares trade at a premium of 42.1% to NAV. Both these metrics are anathema to value investors, but the premium to NAV allows the company to issue shares accretively, and this is important, as they face challenges covering their debt in the coming years.
| Company | Div. Score | Price/FFO ’22 | Premium to NAV |
| LAND | 2.12 | 36.2 | 42.1% |
Source: Hoya Capital Income Builder, TD Ameritrade, and author calculations
What could go wrong?
Due to the continued rise in global temperatures, droughts, fires, and extreme weather events like catastrophic floods could threaten the tenant farmers’ ability to pay the rent.
Tenant farmers have no incentive to let land lie fallow, so there is an elevated risk of overfarming.
The advanced age of the average farmer makes health problems more likely, which in turn raises the risk of rent defaults.
Rising interest rates could make acquisitions more costly and pressure market caps.
Continued issuance of larger-than-usual numbers of shares could dilute shareholder value and suppress share prices.
Investor’s bottom line
With their debt starting to outrun their earnings, LAND depends more and more on accretive share issuance to fuel growth and pay off debts. As long as shares are trading well above NAV, this strategy is likely to work.
LAND is purely a growth play, as the Yield is low and the price is high, and growth has gone out of style, thanks to the stampede to Yield caused by record inflation. The sharp sell-off since the April high of $42.10 has made shares more attractive, but still very expensive. Meantime, price has crossed above the 15-day moving average, which has in turn crossed above the 50-day, which opens the door to a speculative buy for short-term investors.
If you already have shares, there is no compelling reason to sell. I personally don’t wish to get in on the corporatizing of the American farm, and the gradual transformation of family farmers into sharecroppers, so I am going to pass on this company. I rate Gladstone Land a Hold.
Seeking Alpha Premium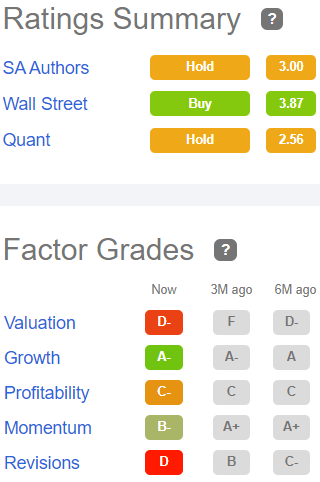
The Seeking Alpha Quant ratings and authors tend to agree with me on this one, and so do The Street, Ford Equity Research, Zacks, and TipRanks. However, 3 of the 8 Wall Street analysts covering the company maintain a Strong Buy recommendation. The average price target of all eight analysts is $31.71, implying upside over 20%.
Be the first to comment