

RiverNorthPhotography
Earnings of Glacier Bancorp, Inc. (NYSE:GBCI) will likely dip this year due to a fall in mortgage banking income. On the other hand, below-average loan growth will support earnings. Overall, I’m expecting Glacier Bancorp to report earnings of $2.64 per share for 2023, down by 3.5% year-over-year. Compared to my last report, I’ve slashed my earnings estimate as I’ve reduced my margin and mortgage banking income estimate. The year-end target price suggests a high upside from the current market price. However, the company’s risk level is above average. Therefore, I’m maintaining a hold rating on Glacier Bancorp.
Revising Downwards the Mortgage Banking Income Estimate
In my last report on Glacier Bancorp, which was released after the third quarter’s results, I said that mortgage banking income (also called gains on the sale of mortgage loans) couldn’t possibly fall any lower as it was already so low. I was wrong. Glacier Bancorp reported mortgage banking income of $2.175 million in the last quarter of 2022, representing just 0.9% of total revenues.
SEC Filings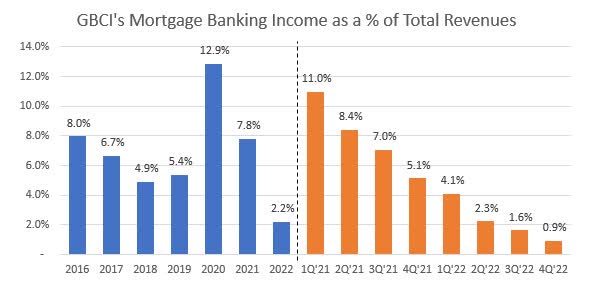
To be on the safe side, I’m now assuming zero mortgage banking income for 2023. Meanwhile, I’m expecting fee income to rise at a normal rate. Overall, I’m expecting total non-interest income to dip by 5% to $114 million in 2023. My updated estimate is a bit below my previous estimate of $124 million for 2023.
Reducing the Margin Estimate
The net interest margin disappointed me by declining by four basis points in the fourth quarter of 2022. During the second and third quarters of last year, the margin had increased by a cumulative 14 basis points as interest rates rose.
The margin will likely remain stable in 2023 despite the rate hikes in the first quarter and anticipated rate hikes in the second quarter of the year. This is because the asset yields and funding costs almost move in tandem when interest rates change. The results of the management’s rate simulation model given in the 10-K filing show that a 200-basis points hike in rates has a small impact on net interest income over two years.
2022 10-K Filing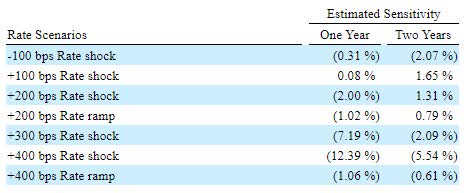
Overall, I’m expecting the margin to increase by just four basis points in 2023. Compared to my last report on the company, I’ve reduced my margin estimate mostly due to the fourth quarter’s poor performance.
Loan Growth to Remain at a Decent Level Despite Deceleration
As expected, the loan portfolio grew by 2.7% in the fourth quarter of 2022, taking the full-year earnings to 13.6%. For 2023, I’m expecting the growth to dip to the lowest level in the last five years. This is because interest rates are at the highest level that they’ve been in more than a decade.
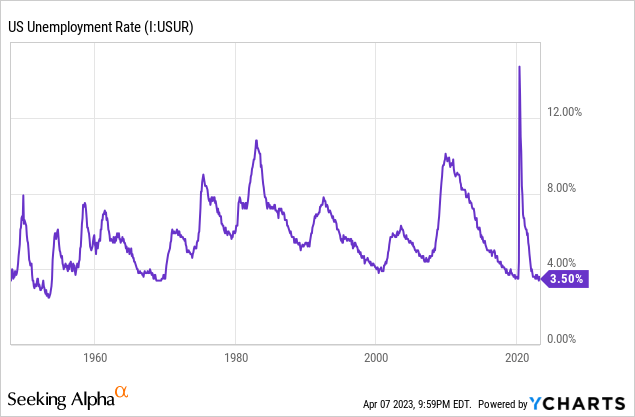
Despite the slowdown, loan growth will likely remain at a decent level this year. This is because of strong labor markets, which indicate robust business activity. Glacier Bancorp operates across several states in the Rocky Mountain area; therefore, the national unemployment rate is a good proxy for unemployment in Glacier’s markets. As shown below, the unemployment rate is currently near record lows. However, the Federal Reserve is projecting the unemployment rate to rise to 4.5% this year.
Considering these factors, I’m expecting the loan portfolio to grow by 10% in 2023. I’m expecting the deposit book to also grow in line with loans this year after declining last year. The management mentioned in the conference call that it will offer competitive rates to retain deposits this year, which is why I’m expecting deposit growth to match loan growth. The following table shows my balance sheet estimates.
| Financial Position | FY18 | FY19 | FY20 | FY21 | FY22 | FY23E |
| Net Loans | 8,156 | 9,388 | 10,964 | 13,259 | 15,065 | 16,628 |
| Growth of Net Loans | 26.5% | 15.1% | 16.8% | 20.9% | 13.6% | 10.4% |
| Other Earning Assets | 2,980 | 3,001 | 5,934 | 10,670 | 9,136 | 9,321 |
| Deposits | 9,494 | 10,776 | 14,798 | 21,337 | 20,607 | 22,746 |
| Borrowings and Sub-Debt | 989 | 777 | 1,178 | 1,198 | 2,956 | 3,016 |
| Common equity | 1,516 | 1,961 | 2,307 | 3,178 | 2,843 | 2,878 |
| Book Value per Share ($) | 18.1 | 22.2 | 24.3 | 28.7 | 25.7 | 26.0 |
| Tangible BVPS ($) | 14.0 | 16.3 | 18.3 | 19.3 | 16.4 | 16.7 |
| Source: SEC Filings, Author’s Estimates(In USD million unless otherwise specified) | ||||||
Reducing the Earnings Estimate
The anticipated fall in non-interest income will drag earnings this year. Further, inflation will drive up operating expenses, which will hurt the bottom line. On the other hand, the anticipated loan growth will support earnings. Overall, I’m expecting Glacier Bancorp to report earnings of $2.64 per share for 2023, down 3.5% year-over-year. The following table shows my income statement estimates.
| Income Statement | FY18 | FY19 | FY20 | FY21 | FY22 | FY23E |
| Net interest income | 433 | 503 | 600 | 663 | 788 | 845 |
| Provision for loan losses | 10 | 0 | 40 | 23 | 20 | 26 |
| Non-interest income | 119 | 131 | 173 | 145 | 121 | 114 |
| Non-interest expense | 320 | 375 | 405 | 435 | 519 | 572 |
| Net income – Common Sh. | 182 | 211 | 266 | 285 | 303 | 293 |
| EPS – Diluted ($) | 2.17 | 2.38 | 2.81 | 2.86 | 2.74 | 2.64 |
| Source: SEC Filings, Author’s Estimates(In USD million unless otherwise specified) | ||||||
In my last report, I estimated earnings of $3.08 per share for 2023. I’ve slashed my earnings estimate as I’ve reduced my margin and mortgage banking income estimates.
Risk Level is Above Average
Glacier’s balance sheet was unfavorably positioned for the rising rate environment at the beginning of last year. It had a very large available-for-sale (“AFS”) securities portfolio at the end of December 2021, which made up 38% of total earning assets. As a result, the company racked up large unrealized mark-to-market losses as interest rates rose.
To mitigate this risk, the company transferred around $2.2 billion worth of securities from the AFS classification to held-to-maturity last year, as mentioned in the 10-K filing. These transferred securities carried unrealized losses totaling $55.7 million. The remaining unrealized losses on AFS securities at the end of 2022 totaled $623.9 million, which is as large as 22% of total equity or twice as big as the net income for last year. I believe all of these losses will start to reverse next year when rates start declining.
Another reason for concern is that a sizable portion of the deposit book is uninsured. Uninsured deposits totaled $6.2 billion at the end of December 2022, representing 30% of total deposits.
Other than the unrealized losses and uninsured deposits, Glacier Bancorp’s riskiness is normal. The company does not operate in areas that are risky and speculative, like cryptocurrencies and venture capital. Further, around 74% of the loan portfolio is backed by real estate.
Overall, I believe Glacier’s risk level is currently above average. As a result, there is a chance that the stock will continue to trade at a discount to its fair value. The stock price has already plunged by 10% since March 8, when Silvergate Capital (SI) collapsed and triggered panic across the banking sector.
Maintaining a Hold Rating
Given the earnings outlook, I’m expecting Glacier Bancorp to maintain its quarterly dividend at $0.33 per share, and its special dividend at $0.10 per share in 2023. This dividend estimate implies a dividend yield of 3.5% and a payout ratio of 54%. The last five-year average payout ratio is 51%; therefore, I don’t think there is much threat of a dividend cut.
I’m using the historical price-to-tangible book (“P/TB”) and price-to-earnings (“P/E”) multiples to value Glacier Bancorp. The stock has traded at an average P/TB ratio of 2.66x in the past, as shown below.
| FY19 | FY20 | FY21 | FY22 | Average | |
| T. Book Value per Share ($) | 16.3 | 18.3 | 19.3 | 16.4 | |
| Average Market Price ($) | 41.5 | 37.9 | 55.4 | 51.4 | |
| Historical P/TB | 2.55x | 2.07x | 2.87x | 3.14x | 2.66x |
| Source: Company Financials, Yahoo Finance, Author’s Estimates | |||||
Multiplying the average P/TB multiple with the forecast tangible book value per share of $16.7 gives a target price of $44.4 for the end of 2023. This price target implies a 10.2% upside from the April 6 closing price. The following table shows the sensitivity of the target price to the P/TB ratio.
| P/TB Multiple | 2.46x | 2.56x | 2.66x | 2.76x | 2.86x |
| TBVPS – Dec 2023 ($) | 16.7 | 16.7 | 16.7 | 16.7 | 16.7 |
| Target Price ($) | 41.0 | 42.7 | 44.4 | 46.0 | 47.7 |
| Market Price | 40.2 | 40.2 | 40.2 | 40.2 | 40.2 |
| Upside/(Downside) | 1.9% | 6.1% | 10.2% | 14.4% | 18.5% |
| Source: Author’s Estimates |
The stock has traded at an average P/E ratio of around 17.3x in the past, as shown below.
| FY19 | FY20 | FY21 | FY22 | Average | |
| Earnings per Share ($) | 2.38 | 2.81 | 2.86 | 2.74 | |
| Average Market Price ($) | 41.5 | 37.9 | 55.4 | 51.4 | |
| Historical P/E | 17.4x | 13.5x | 19.4x | 18.8x | 17.3x |
| Source: Company Financials, Yahoo Finance, Author’s Estimates | |||||
Multiplying the average P/E multiple with the forecast earnings per share of $2.64 gives a target price of $45.6 for the end of 2023. This price target implies a 13.3% upside from the April 6 closing price. The following table shows the sensitivity of the target price to the P/E ratio.
| P/E Multiple | 15.3x | 16.3x | 17.3x | 18.3x | 19.3x |
| EPS 2023 ($) | 2.64 | 2.64 | 2.64 | 2.64 | 2.64 |
| Target Price ($) | 40.3 | 42.9 | 45.6 | 48.2 | 50.9 |
| Market Price ($) | 40.2 | 40.2 | 40.2 | 40.2 | 40.2 |
| Upside/(Downside) | 0.2% | 6.7% | 13.3% | 19.8% | 26.4% |
| Source: Author’s Estimates |
Equally weighting the target prices from the two valuation methods gives a combined target price of $45.0, which implies an 11.8% upside from the current market price. Adding the forward dividend yield gives a total expected return of 15.0%.
In my last report, which was published in December 2022, I adopted a hold rating with a December 2023 target price of $52.0. Since then, the stock price has plunged, as discussed above. This is why I have a higher total expected return now even though I’ve slashed my target price.
I usually adopt a buy rating when the total expected return is in double digits. However, due to the above-average risk level, I believe a buy rating would be inappropriate. As a result, I’ve decided to maintain a hold rating on Glacier Bancorp.
Be the first to comment