

Editor’s note: Seeking Alpha is proud to welcome Eugenio Catone as a new contributor. It’s easy to become a Seeking Alpha contributor and earn money for your best investment ideas. Active contributors also get free access to SA Premium. Click here to find out more »
Justin Sullivan/Getty Images News
In recent years, Gilead Sciences (NASDAQ:GILD) has been little considered by investors who have turned their attention to other pharmaceutical companies, especially those that have made a relevant contribution to fight COVID-19.
I personally believe that Gilead Sciences is currently the most undervalued pharmaceutical company and, in this article, I will explain how I came to this conclusion.
Business core and strategy
Gilead Sciences, Inc is a biopharmaceutical company founded in 1987 that researches, develops, and markets drugs internationally that treat serious and uncommon diseases. It is a company with a market capitalization of approximately $76 billion, and an undisputed leader in the fight against HIV.
According to its 2021 annual report, much of the company’s revenue comes from the sale of drugs used in the fight against HIV: of a total of $27.3B as much as $16.3B comes from these drugs, or 59.7%.
The global HIV drug market considering a long-term time horizon has always been growing, and only the advent of COVID-19 reversed this trend since it caused disruptions in the import and export of healthcare products worldwide. However, now that the COVID-19 issue is now becoming less and less relevant, analysts predict that “this market is expected to return to growth and from $30.46 B in 2021 will reach $45.58 B in 2028, at a CAGR of 5.9%”. As Gilead is the industry leader, there is a good likelihood it will benefit.
Being a leader in a stable and growing market is certainly good for Gilead’s coffers; however, management as of 2020 is opting for more revenue diversification so as not to be too dependent on HIV drugs.
In 2020, the company entered 11 acquisitions and partnerships in oncology, demonstrating a strong focus on the commercialization of drugs inherent in this area. In particular, “since 2020 the pipeline has increased by 50% and to date has 10 drugs in phase 3 (clinical trials) in the oncology department”.
Considering revenue and market capitalization, this company’s best period was 2015, therefore the negative returns of the last 6 years are justified. However, in the last 3 years, the company’s will is to get back to the levels of that time, and this can be deduced from the large R&D expenses to widen the pipeline.
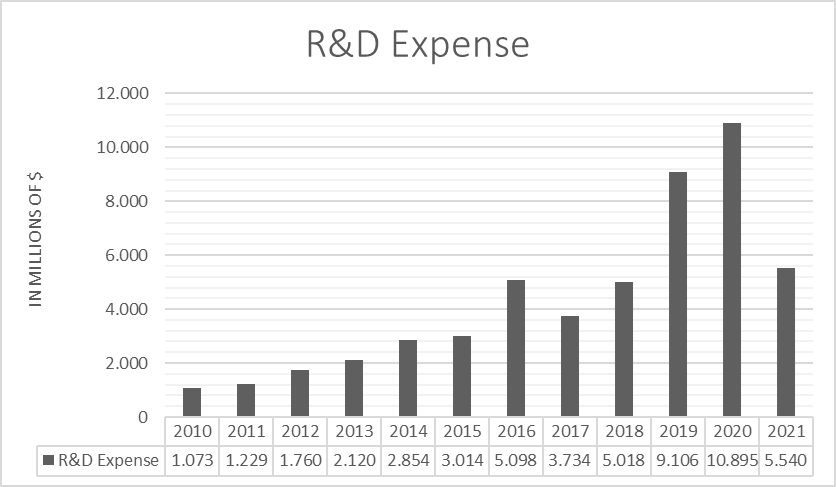
R&D Expense (TIKR Terminal)
As we can see, research and development spending has increased significantly in recent years, as $25.5 billion has been invested in the last 3, virtually the same amount the company spent from 2010 to 2018. Research and development spending is crucial for a pharmaceutical company, as it increases the likelihood of commercializing new drugs in the future.
Gilead Sciences’ income and cash flow analysis
As a company in decline since 2015 you would expect a rather weak profitability; however, in my opinion, this is not the case: in the three-year period from 2014 to 2016 since 2010 the company achieved better profitability.
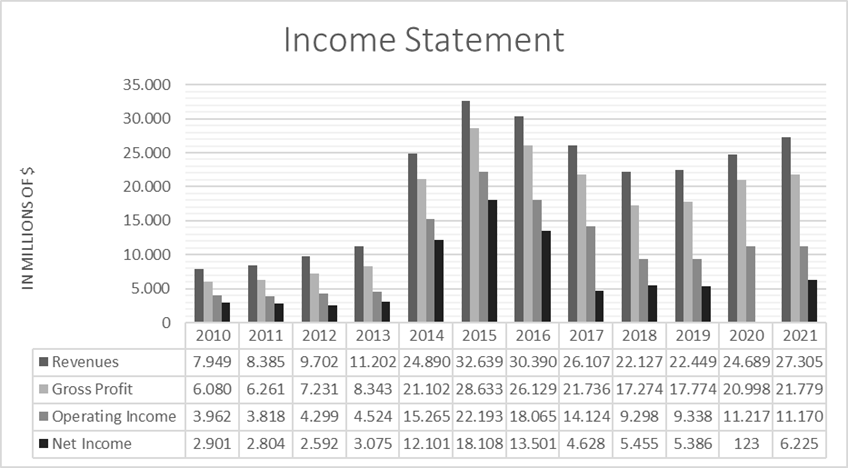
Income Statement (TIKR Terminal )
The graph above expresses the net income and the intermediate income values from 2010 to 2021.
As can be seen, it is easy to observe how the company had a profitable situation year after year until 2015, as all these items at the time had a marked increase. It must be said, however, that the sharp improvement achieved between 2013 and 2015 was mainly due to multiple acquisitions by the company such as YM BioSciences, EpiTherapeutics ApS, and Phenex Pharmaceuticals AG. From 2015 onward, there was a steep decline up until 2018.
Since 2018, however, the trend in revenues and profits has been growing again, and with recent investments in research and development and the demand for products to treat HIV no longer being held back by the pandemic emergency, there are good signs that this trend may continue in the future.
However, to best understand whether the company is achieving quality growing profits, it is necessary to analyze cash inflows: having growing profits that do not result in cash inflows is a red flag. Profits can be manipulated through the improper use of non-monetary revenues and costs, which is not the case with free cash flow.

Cash Flows (TIKR Terminal)
As we can see from this graph regarding the cash flows of the company, we can see that Gilead is able to generate significant cash inflows, often even greater than the profits themselves: the strong divergence between free cash flow and profits is due to the presence of high non-monetary costs such as depreciation and amortization.
The cash inflows that this company manages to generate are significant, and I believe it will inevitably get more attention from investors in the future.
Profitability and valuation ratios
Profitability ratios are critical for a company’s valuation, especially when compared to industry competitors. The table below shows the current comparison between Gilead and its major competitors: Biogen (BIIB), Merck (MRK), Novo Nordisk (NVO), AbbVie (ABBV), and Bristol Myers Squibb (BMY).
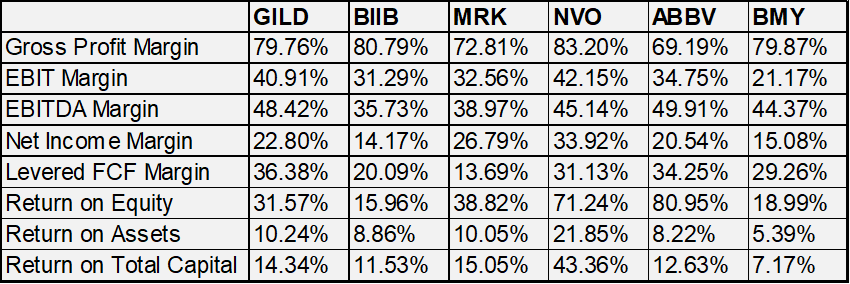
Comparison of profitability ratios with competitors (Seeking Alpha )
As you can see, Gilead currently has solid values, and in no way disfigures against competitors that are near their all-time highs. Moreover, Gilead has the best levered FCF margin, proving once again its efficiency in generating cash through its operations. Looking at this data, it is counterintuitive to think that Gilead (aside from BIIB) is the company furthest from its all-time highs, yet it is.
However, the biggest advantage of investing in Gilead over other companies is not its far better margins, but its current valuation. Gilead’s profitability margins are overall in line with competitors, but what makes the difference is how much you have to pay for those margins.
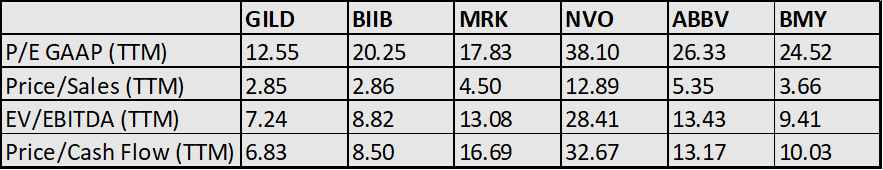
Comparison of price multiples with competitors (Seeking Alpha)
As you can see, each of these four valuation ratios presents a better value for Gilead: all other companies compared to Gilead have much higher multiples, therefore they are more expensive.
In my opinion, a solid company like Gilead deserves higher multiples, so it is currently undervalued compared to its competitors.
Short- and long-term solvency
Having ascertained that Gilead has significant cash inflows and healthy valuation ratios, we now need to understand if there are any issues related to debt solvency.
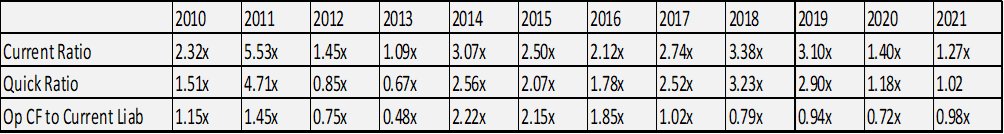
Short term solvency (TIKR Terminal)
The table above shows the main short-term solvency ratios from 2010 to date. As can be seen, the current values are lower than in the past; however, the Current ratio and Quick ratio are still greater than 1, so there is no risk of insolvency in the short term. Furthermore, as the company has significant cash inflows, it is able to almost completely cover its short-term debt with the 1-year cash from operations (0.98x).
Established that Gilead’s liquidity is not an issue, it is worth checking whether the company’s overall structure is compromised by excessive debt.
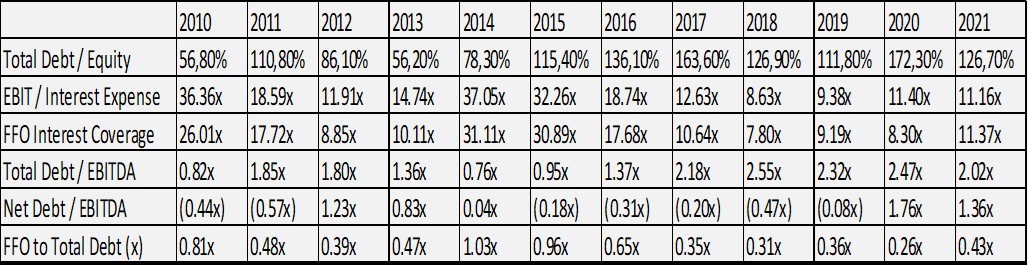
Long term solvency (TIKR Terminal )
According to the Debt/Equity the company is quite indebted since it has a value of 126.70%; however, it is important to make further considerations.
Gilead can easily cover the interest on debt since EBIT/Interest Expense and FFO Interest Coverage are both greater than 11x.
The Total Debt itself, although high, is sustainable. The EBITDA of 2021 is about half of the total debt, so in just 2 years it is possible to repay the entire debt. Similar reasoning for FFO to Total Debt.
Also considering the cash and equivalents of the company, then the debt becomes even more sustainable: with a Net Debt/EBITDA of 1.36x the company is close to repay the entire debt with the EBITDA of just one year.
Overall, I believe that Gilead despite having a high Debt/Equity can meet its liabilities easily. Its cash inflows are able to support the company’s overall debt.
Gilead’s buyback and dividends
Price-per-share appreciation is not the only way to reward shareholder investment; we also have buybacks and dividends.
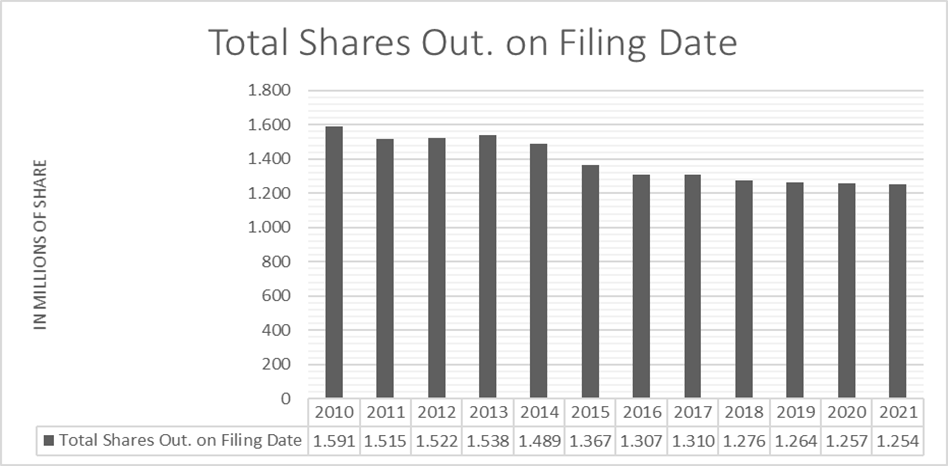
Total shares outstanding (TIKR Terminal)
As we can see from the chart above, Gilead’s outstanding shares have decreased since 2010, benefiting its shareholders who have seen their ownership stake in the company increase. The buyback represents a tax-efficient way to remunerate its shareholders, and the trend is likely to continue, especially considering the current price per share.
Alongside the buyback, however, Gilead shareholders receive additional compensation: a sustainable dividend with a yield of 4.69%.
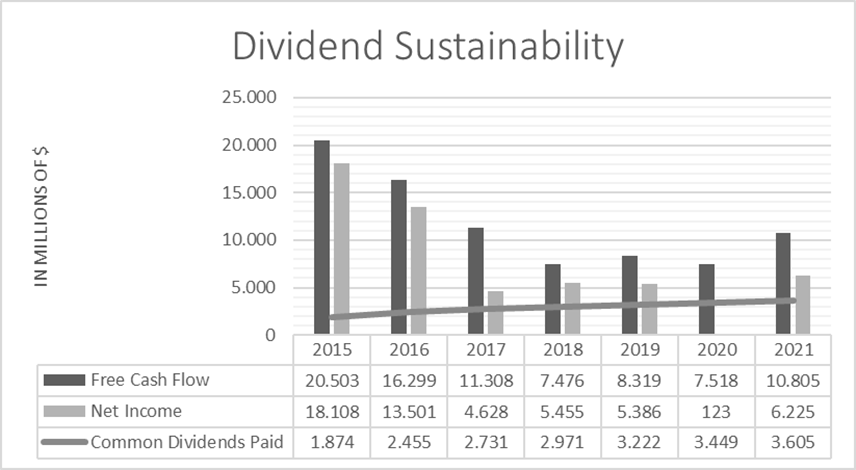
Dividend sustainability (TIKR Terminal )
As we can see from the graph, although the dividend is increasing year after year and is quite high, it represents half of the net profit and the third part of the free cash flow: it is therefore a sustainable dividend.
In my opinion, buyback and high dividend represent two other reasons to invest in Gilead: besides the appreciation of the shares, investors will also gain from dividend payments and buybacks.
Above all, dividends (high, constant, and increasing) will bring liquidity to investors already in the short term.
GILD stock valuation
I value Gilead using a discounted cash flow model. The reason why I’m using this model is because I believe that every investment is the present value of future cash flows, and that’s what I’m going to do in this model.
This model was constructed as follows:
– Perpetual growth rate of 2.5% based on the average of worldwide annual GDP growth and the average level of inflation. This is a standard value.
– WACC represents Gilead’s weighted average cost of capital (taken from finbox.com)
– Free cash flow values included from 2022 to 2026 represent TIKR Terminal analysts’ estimates.
– The free cash flow growth estimate from 2027 to 2031 is 0%. I purposely wanted to use a very conservative value to bring out even more how potentially undervalued this company is.
– The values of the outstanding shares and net debt belong to TIKR Terminal platform.
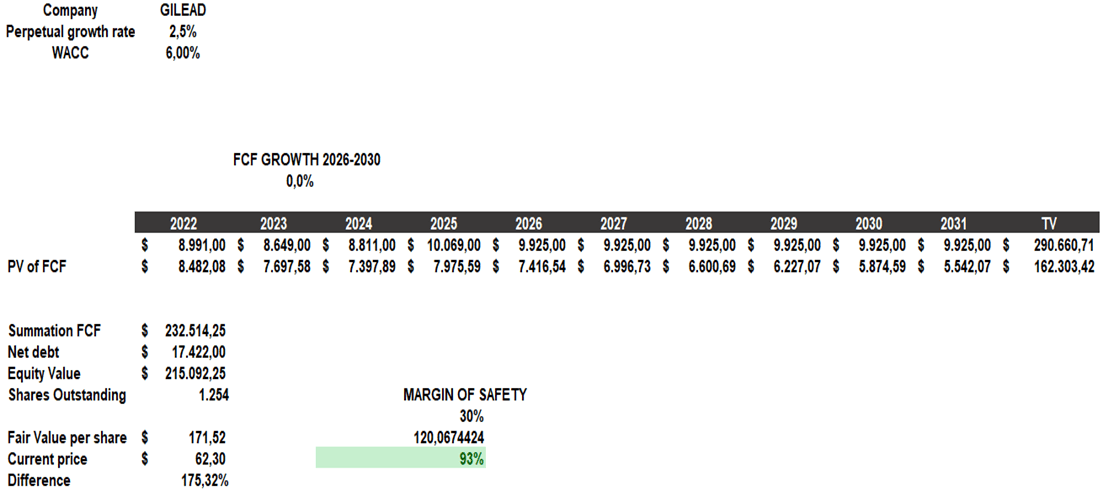
Discounted cash flow (The sources are as mentioned above )
As you can see, Gilead appears extremely undervalued since its fair value is $171.52 when its current price is $62.30. Wanting to be even more conservative, using a 30% margin of safety the company still presents a potential upside of almost 100%. The potential for this company, according to DCF, is very high even though the data entered is quite conservative. Even if I had entered free cash flow with a 0% growth rate from now to 2031 Gilead would still be undervalued.
Risks
Although Gilead seems to be a solid and undervalued company, it is necessary to consider the risks related to an investment in this company: every investment has risks, even Gilead.
The first risk of a possible investment concerns the sector in which Gilead operates. The pharmaceutical industry is very competitive, and a company’s pipeline is the most important thing. At the moment, Gilead’s pipeline is not very diversified despite recent investments in oncology drugs, as much of its revenue is tied to drugs to treat HIV. The company is trying to diversify; however, it is not yet certain that this process will be successful.
The second risk relates to the huge investments of $25.5 billion that Gilead has made in the last 3 years. While these investments are welcomed because they express the company’s willingness to innovate, it is not possible to know in advance whether these investments will bring concrete benefits to the pipeline.
Buying Gilead means buying a company that has lost investor interest since 2015, and this can also be seen from the fact that in 2015 the Price per share was around $117, almost double the current price. The potential upside of 100% is very interesting, but it can only happen if Gilead manages to redeem itself definitively.
Final thoughts
Since Gilead is a company that has struggled to attract investors since 2015, the entire investment thesis is based on the company redeeming itself, as stated above. It is a contrarian investment.
I personally believe that Gilead has all the parameters to be revalued in the future, as the company does not show any evident weaknesses other than related to its price per share. From an earnings perspective, there were difficulties until 2018, but since then revenues have returned to steady growth. The company’s free cash flow is very high, and its margin is the highest among the competitors analyzed. The debt although high is sustainable thanks to the significant cash flows that the company receives each year.
Using a DCF model, and inserting conservative values, the company is undervalued by almost 100% with a margin of safety of 30%. With a sustainable dividend growing at almost 5%, even if the company’s stock market performance is flat there will be a gain for investors. For all these reasons, I believe the benefits of investing in Gilead far outweigh the risks, which is why I consider this company a Strong Buy.
Finally, I want to point out that I am not talking about a short-term investment but a long-term one: if a company goes down for 7 years, it is unlikely to recover in a few months.
Be the first to comment