

peshkov
Buffett famously said, “It’s far better to buy a wonderful company at a fair price, than a fair company at a wonderful price.”
Microsoft (NASDAQ:MSFT) is the ultimate Buffett “wonderful company”.
Microsoft Dividend Safety
| Rating | Dividend Kings Safety Score (233 Point Safety Model) | Approximate Dividend Cut Risk (Average Recession) | Approximate Dividend Cut Risk In Pandemic Level Recession |
| 1 – unsafe | 0% to 20% | over 4% | 16+% |
| 2- below average | 21% to 40% | over 2% | 8% to 16% |
| 3 – average | 41% to 60% | 2% | 4% to 8% |
| 4 – safe | 61% to 80% | 1% | 2% to 4% |
| 5- very safe | 81% to 100% | 0.5% | 1% to 2% |
| MSFT | 100% | 0.5% | 1.00% |
| Risk Rating | Very Low Risk (100th S&P Global percentile risk-management) | BB Stable Outlook credit rating = 17% 30-year bankruptcy risk | 20% OR LESS Max Risk Cap Recommendation |
Long-Term Dependability
| Company | DK Long-Term Dependability Score | Interpretation | Points |
| Non-Dependable Companies | 36% or below | Poor Dependability | 1 |
| Low Dependability Companies | 37% to 54% | Below-Average Dependability | 2 |
| S&P 500/Industry Average | 55% to 63% | Average Dependability | 3 |
| Above-Average | 64% to 77% | Dependable | 4 |
| Very Good | 78% or higher | Very Dependable | 5 |
| MSFT | 100% | Very Dependable | 5 |
Overall Quality
| MSFT | Final Score | Rating |
| Safety | 100% | 5/5 Very Safe |
| Business Model | 100% | 3/3 Wide And Stable Moat |
| Dependability | 100% | 5/5 Very Dependable |
| Total | 100% | 13/13 Ultra SWAN |
| Risk Rating |
5/5 Very Low Risk |
|
| 20% OR LESS Max Risk Cap Rec |
20% Margin of Safety For A Potentially Good Buy |
It’s as close to God’s own dividend growth blue-chip as exists on Wall Street.
Let me show you why I believe Microsoft is the ultimate sleep-well-at-night bear market buy, a potentially strong buy when it becomes a Buffett-style table-pounding “fat pitch” ultra value buy.
In other words, let me show you why this bear market likely isn’t over yet, Microsoft is potentially the perfect blue-chip to safeguard your hard-earned savings, and why it soon might be time to back up the truck on the ultimate Buffett-style blue-chip.
Why This Bear Market Likely Isn’t Over Yet
The market is once again in rally mode, and that’s no surprise. Why?
State Street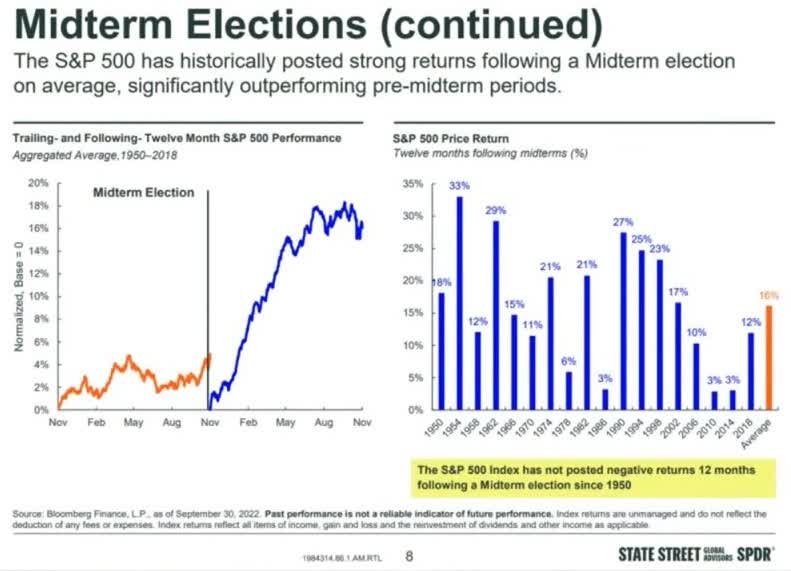
Midterm elections are famous for their rallies, no matter who wins. Since 1950 the market has never failed to deliver positive returns within 12 months.
Why? Because almost always midterms deliver divided government, gridlock in which nothing major gets done.
They also deliver certainty and we know how much markets love that.
Mike Wilson at Morgan Stanley has been bearish all year, but recently became short-term bullish. Why? Because of several short-term factors that his quant team believes could cause the market to rally to 3,950 to 4,150.
- falling long-term rates (economy is weakening and bond investors are getting ready for the 2023 recession)
- midterm election rally
- Santa Claus rally
- pension fund rebalancing
In other words, a short-term perfect storm of potential market tailwinds that likely makes this the next bear market rally.
Daily Shot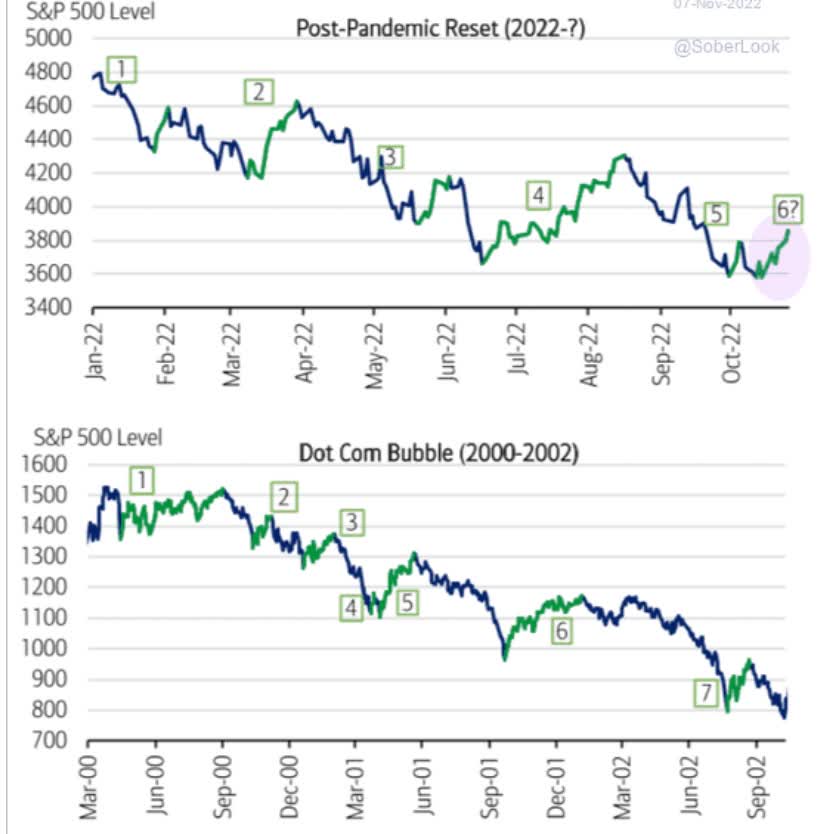
But why can’t this be the bottom? Some analysts like JPMorgan’s Chief Equity Strategist Marko Kolanovic and Ed Yardeni think it is. But Mike Wilson, Bank of America, UBS, and Goldman think the bears aren’t done with us yet.
Why?
(Source: NY Fed, CNBC, DK S&P 500 Valuation Tool)
The bond market is now pricing in a 100% risk of recession in 2023.
- Bloomberg’s model says 100%
- Ned Davis Research 98%
- Conference Board 96%
- 85% of CEOs now expecting a mild recession next year
Bloomberg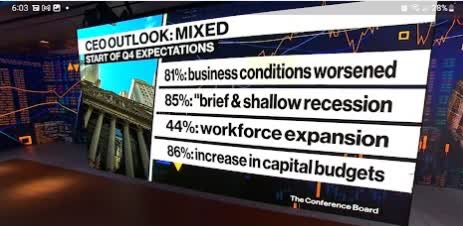
Interestingly enough, 44% of companies still plan to keep hiring through the recession and 86% plan to keep growth spending flat or even increase it.
This gives credence to the idea that the 2023 recession could be mild and short.
Daily Shot
Even if the Fed refuses to cut rates (which it says it won’t do unless inflation collapses) and Congress doesn’t approve stimulus (which it likely won’t do with divided government), JPMorgan thinks the coming recession will be average.
- four quarters long
- 6% peak unemployment
- about 1.4% GDP decline in 2023
What does that mean for earnings?
Daily Shot
The average EPS decline in recessions since WWII is 13% and so is the median.
| Weekly Decline In S&P EPS Consensus | Last Week’s EPS Consensus | Year | EPS Consensus | YOY Growth |
| 0.09% | $206.08 | 2021 | $206.27 | 50.20% |
| -0.03% | $219.29 | 2022 | $219.22 | 6.28% |
| -0.92% | $234.90 | 2023 | $232.75 | 6.17% |
| -0.75% | $255.23 | 2024 | $253.31 | 8.83% |
| Recession Adjusted Forward PE | Historical 2023 EPS (Including Recession) | 12-Month forward EPS | 12-Month Forward PE | Historical Overvaluation |
| 20.23 | $190.72 | $231.19 | 16.686 | -0.97% |
(Source: DK S&P 500 Valuation Tool)
That current forward earnings estimates of 231 are too high and 191 is a more reasonable estimate.
- Morgan Stanley’s estimate is 195
What does that mean for the stock market? That historically speaking, with the market generally bottoming at 13 to 15X trough earnings, the S&P has a bit more to fall.
- 3,000 to 3,400 is the blue-chip consensus bottom range
- 12% to 25% lower
When is the bottom likely coming?
- Morgan Stanley thinks Q1 (around earnings season and Fed’s final rate hike)
- Goldman thinks Q2 (around earnings season and peak earnings pessimism)
- JPMorgan thinks Q4 (halfway through the average recession)
So if stocks are likely going to still fall more, why recommend any stocks today? Why buy Microsoft today when you can buy it cheaper tomorrow?
Why Buying Stocks Today Makes For A Potentially Rich Retirement Tomorrow
Wall Street doesn’t run on certainty, just probability curves. If you want to time the market, you need to be right about both when the market will bottom and when individual stocks you want to buy will bottom.
Vanguard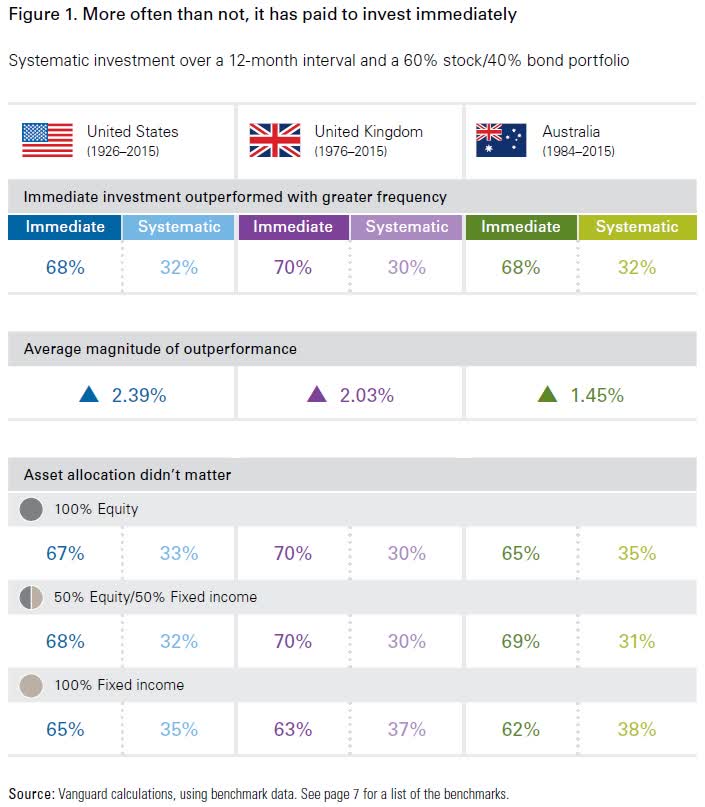
It’s almost impossible to beat dollar cost averaging and steady blue-chip buy and hold.
70% of the time investing 100% of your savings is the right call, resulting in 2.4% higher annual long-term returns.
- 2X more wealth over 30 years
- 4X more wealth over an investing lifetime of 60 years
In bear markets like this, putting all your money to work immediately is the optimal strategy 85% to 90% of the time.
Nick Maggiulli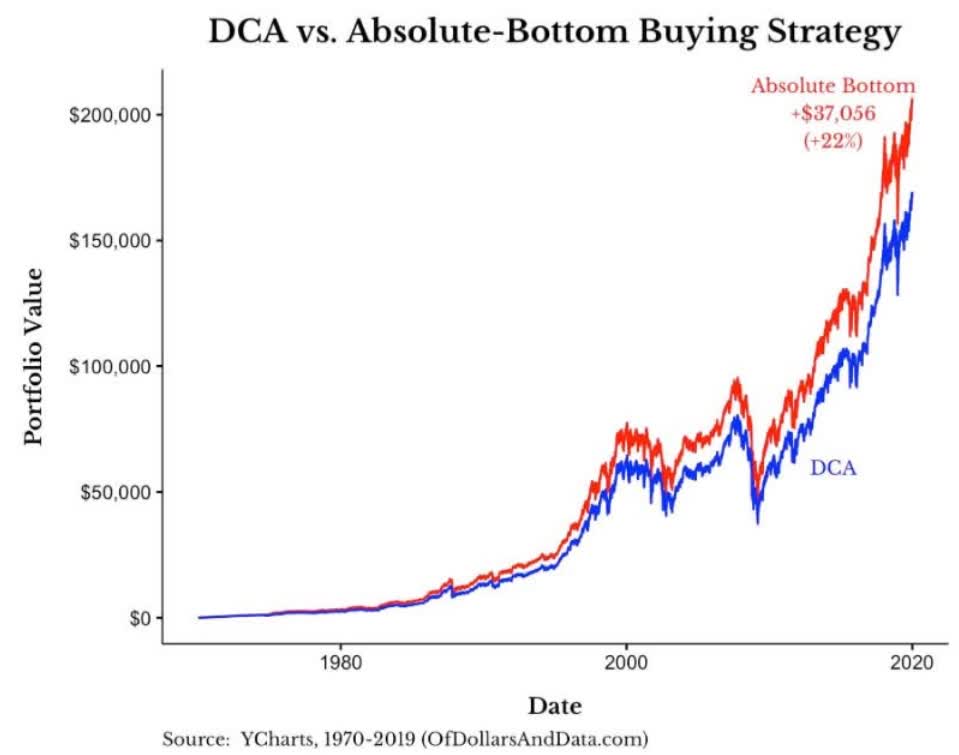
From 1970 to 2019, had you bought stocks every month, you would have basically made the same money as if you had bought at the low point for each year.
- 22% higher return from perfect market timing over 49 years
- 0.4% higher annual returns for perfect market timing
The market’s historical return is 10%. That’s similar to what analysts expect in the future.
So to time the market means you risk giving up 10% returns to try to make 10.4% CAGR.
- risk not making $25 to try to make an extra $1
That’s a negative 25:1 reward/risk ratio, which is terrible.
But we’re headed for recession! That doesn’t matter.
Charlie Billelo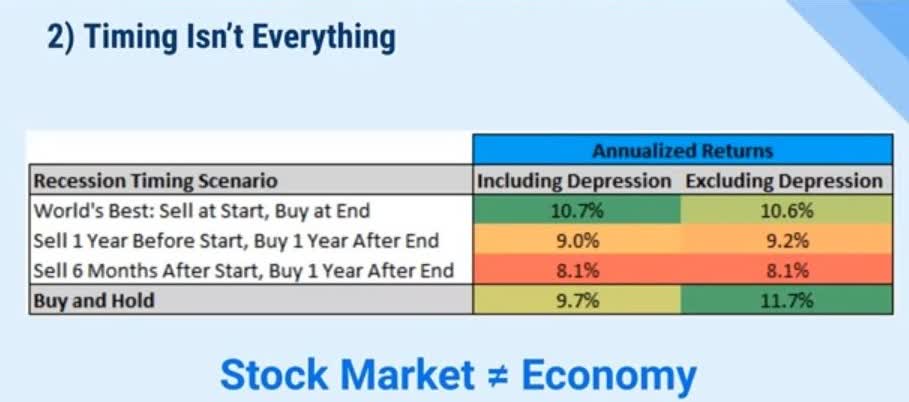
Other than the Great Depression, perfect economic timing, which as impossible as perfect market timing, doesn’t beat buy and hold blue-chip investing.
And as you’ll now see, Microsoft is the ultimate sleep-well-at-night blue-chip for this, or any future recession.
Why Microsoft Is The Ultimate Sleep-Well-At-Night Dividend Blue-Chip For This Recession
Microsoft is as close to a risk-free stock as exists.
A Stronger Balance Sheet Than The US Treasury
| Rating Agency | Credit Rating | 30-Year Default/Bankruptcy Risk | Chance of Losing 100% Of Your Investment 1 In |
| S&P | AAA Stable Outlook | 0.07% | 1428.6 |
| Fitch | AAA Stable Outlook | 0.07% | 1428.6 |
| Moody’s | Aaa (AAA equivalent) Stable Outlook | 0.07% | 1428.6 |
| Consensus | AA- Stable Outlook | 0.07% | 1,429 |
(Source: S&P, Fitch, Moody’s)
How many US companies have three AAA credit ratings? Only MSFT (JNJ has two).
Not even the US government has three AAA credit ratings (S&P rates the US government AA+).
That means MSFT has a 1 in 1,429 chance of defaulting on its bonds and going bankrupt (and the stock to zero) over the next 30 years.
Why?
FactSet Research Terminal
MSFT has $60 billion more cash than debt.
It’s also a free cash flow machine.
Ycharts
33 cents of every dollar in sales drops straight to the bottom line, in the top 10% of all companies on earth.
What does that actually mean in dollars?
FactSet Research Terminal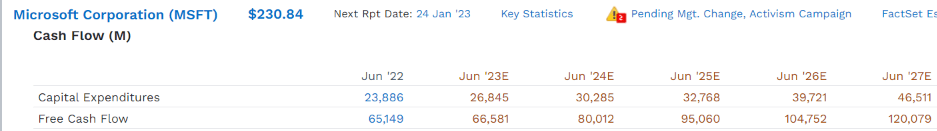
$65 billion in free cash flow that’s expected to double to $120 billion per year by 2027.
FactSet Research Terminal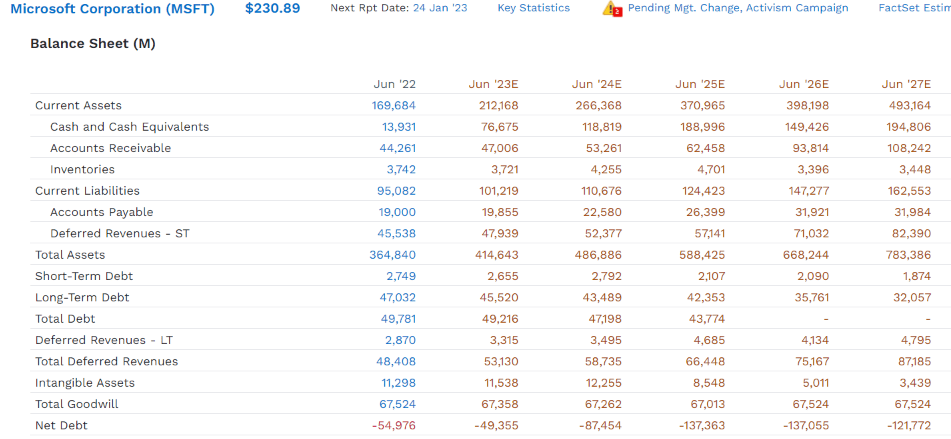
It means a consensus $195 billion in cash by 2027, and $122 billion net cash.
And that’s AFTER buybacks, of which MSFT is expected to do a lot of. How much?
Microsoft Buyback Consensus Forecast
| Year | Consensus Buybacks ($ Millions) | % Of Shares (At Current Valuations) | Market Cap |
| 2022 | $32,696 | 1.9% | $1,723,699 |
| 2023 | $27,506 | 1.6% | $1,723,699 |
| 2024 | $33,868 | 2.0% | $1,723,699 |
| 2025 | $35,635 | 2.1% | $1,723,699 |
| 2026 | $34,467 | 2.0% | $1,723,699 |
| 2027 | $36,811 | 2.1% | $1,723,699 |
| Total 2023 through 2027 | $168,287 | 9.8% | $1,723,699 |
| Annualized Rate | 2.1% | Average Annual Buybacks | $28,048 |
| 1% Buyback Tax | $1,683 | Average Annual Buyback Tax | $280 |
(Source: FactSet Research Terminal)
Analysts expect $169 billion in buybacks over the next five years, averaging $28 billion per day.
- $121 million every day the market is open
- $18.7 million every hour the market is open
- $311,000 per second the market is open
MSFT is expected to have twice as much money in five years.
- Even after spending Kazakhstan’s GDP worth on buybacks
The Ultimate Tech Utility: Why Microsoft Is Such A Cash Machine
Why is MSFT the ultimate sleep-well-at-night company? Because its business is essential to the global economy.
Earnings Presentation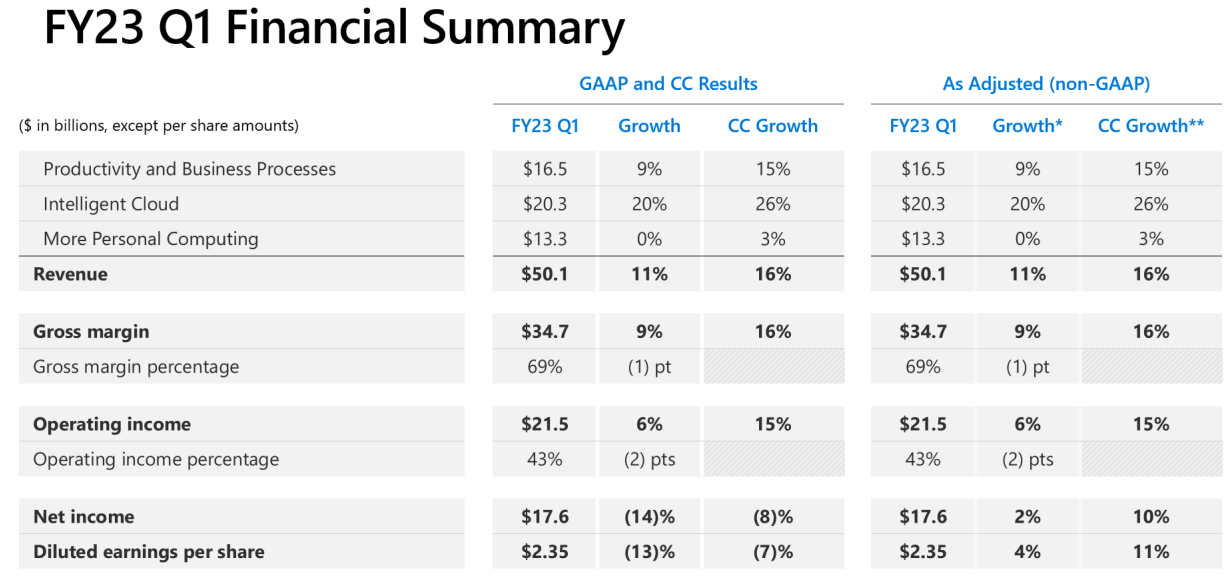
MSFT reported 16% constant currency sales growth in a very tough quarter, when slowing global growth caused all big tech giants other than Apple (AAPL) to miss badly.
Its EPS grew 11% in constant currency, incredible growth considering its earnings have already grown 105% during the Pandemic.
Earnings Presentation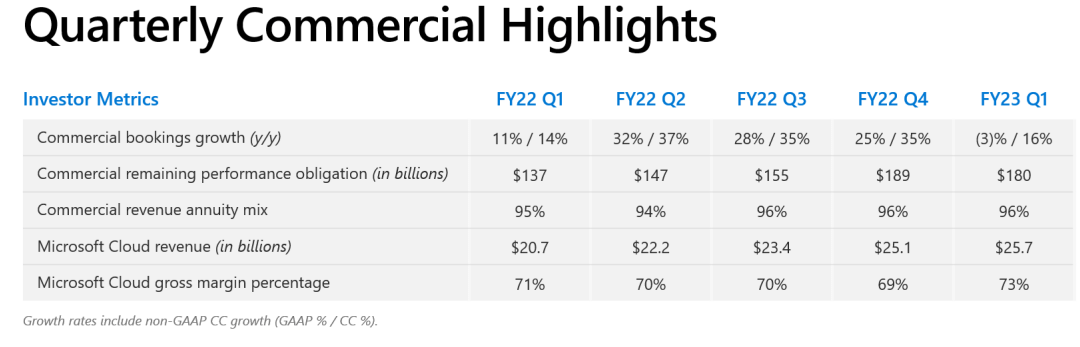
96% of its commercial business is now subscription, for things like Office 365 for businesses. I can say from personal experience that most IT managers would rather eat their dogs than give up Microsoft Office.
Cloud is generating 73% gross margins, and now generating over $100 billion per year.
If you think Office is addictive for companies, cloud computing is even more so.
Cloud computing saves companies money, and allows for productivity growth that makes them more profitable.
86% of companies say they have no plans to scale back growth spending and those that do almost certainly don’t plan to cut back on cloud spending.
- in a recession cloud is even more valuable than in boom times because it saves companies money
Earnings Presentation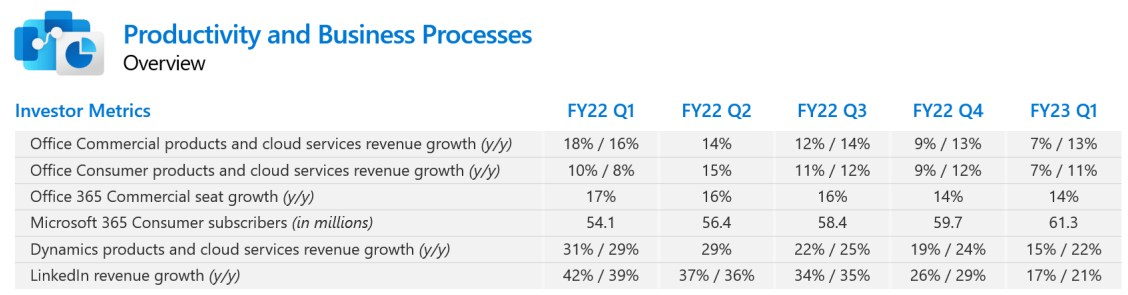
That’s why Office 365 and cloud services are growing at 14% and 22%, respectively, in constant currency.
It’s why LinkedIn, which helps companies find the best workers (44% of companies plan to keep hiring in the recession) is growing at 21% in a slowing global economy.
Earnings Presentation
It’s why cloud is growing at 28% per year in a slowing global economy and generating $36 billion in operating income per year.
FactSet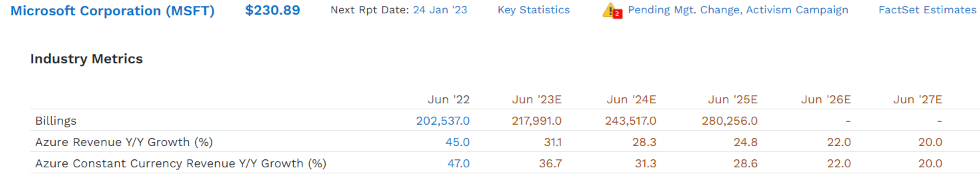
It’s why Azure is expected to keep growing at 20+% through at least 2027.
How big could MSFT’s cloud get?
Grand View Research
This was a $135 billion industry in 2021 that’s expected to keep growing at 15% per year through 2030.
- $406 billion industry in 2030
MSFT is gaining market share in an industry that’s already 66% dominated by Amazon (AMZN) AWS, Alphabet’s (GOOG) (GOOGL) Google Cloud, and Azure.
Statista
MSFT has 21% market share in cloud and AWS, Azure and Google Cloud are all gaining market share by growing faster than the industry as a whole.
- Google Cloud 38% Q3 growth
- AWS 28% Q3 growth
- Azure 28% Q3 growth
How big could cloud computing eventually get?
IOT Analytics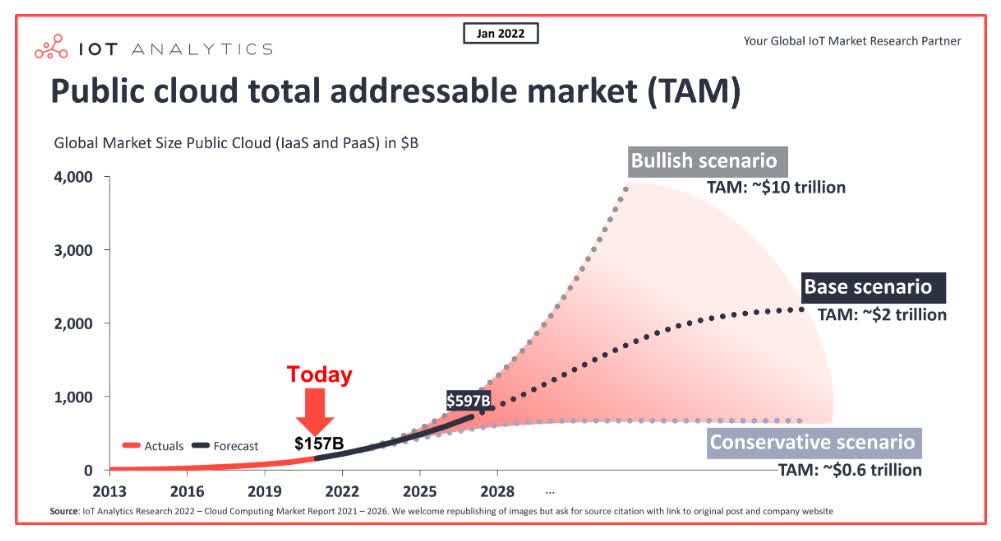
A potential $2 trillion or even $10 trillion global industry, one dominated by the three kings of cloud computing.
Why is cloud the ultimate wide-moat business? Shouldn’t challengers like IBM (IBM) or Alibaba (BABA) be able to undercut on price and steal market share?
Don’t forget that cloud isn’t just about storing data, it’s about data analytics.
Machine learning algos need data to keep improving. The more data they have the faster they can improve. And then they can analyze corporate data and provide efficiency and profit boosting ideas to corporate clients.
Do you know who has the most data? Amazon, Alphabet, and Microsoft.
So who does everyone use? Amazon, Alphabet, and Microsoft.
And whose algos keep improving at an exponential rate? Faster than any rivals? Amazon, Alphabet, and Microsoft.
Why is GOOG #1 in global search? Because they have the best search algos.
Why does GOOG have the best search algo? Because everyone uses it.
When will GOOG be dethroned in search? Only when we all stop using it.
And since they have the best service, we never will.
It’s the same for cloud computing, which is now as essential to corporate operations as the internet itself.
And that my friends, is why there is no wider moat tech utility on earth than MSFT.
The Ultimate Wonderful Company At A Wonderful Price
(Source: FAST Graphs, FactSet)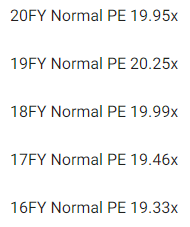
(Source: FAST Graphs, FactSet) (Source: FAST Graphs, FactSet)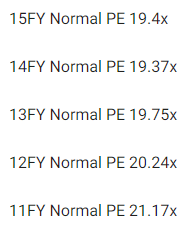
Even when it was being run by a fool (Ballmer) and growing at 9%, MSFT was valued at 19X earnings. That’s because of its wide moat from legacy Office.
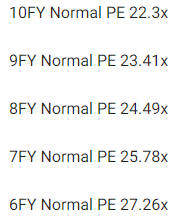
Since Nadella took over and changed the business model to be faster-growing, higher margin, and recurring revenue, it’s been valued at 24X to 27X earnings.
- GOOG and AMZN, MSFT’s two largest cloud computing peers, have also traded at 26X earnings and cash flow, historically
| Metric | Historical Fair Value Multiples (10-Years, Nadella Era, New Business Model) | 2021 | 2022 | 2023 | 2024 | 2025 |
12-Month Forward Fair Value |
| Earnings | 25.78 | $221.71 | $241.30 | $266.57 | $316.06 | $370.97 | |
| Average | $221.71 | $241.30 | $266.57 | $316.06 | $370.97 | $263.65 | |
| Current Price | $231.12 | ||||||
|
Discount To Fair Value |
-4.25% | 4.22% | 13.30% | 26.88% | 37.70% | 12.34% | |
| Upside To Fair Value | -4.07% | 4.40% | 15.34% | 36.75% | 60.51% | 15.25% | |
| 2022 EPS | 2023 EPS | 2022 Weighted EPS | 2023 Weighted EPS | 12-Month Forward EPS | 12-Month Average Fair Value Forward PE | Current Forward PE |
Current Forward Cash-Adjusted PE |
| $9.36 | $10.34 | $1.08 | $9.15 | $10.23 | 25.8 | 22.6 | 13.4 |
MSFT is worth about 26X earnings and today it trades at 23X. But don’t forget about its mountain of cash.
It’s cash-adjusted PE is just 13.4.
In other words, MSFT is not overvalued by as long as its growing at least 2.45% CAGR.
FactSet Research Terminal
The long-term median growth consensus from all 54 analysts is 10.3% CAGR, which is very realistic given MSFT’s dominance in cloud, Office software, and 2% annual buybacks.
| Rating | Margin Of Safety For Very low Risk 13/13 Ultra SWAN (Sleep Well At Night) Quality Companies | 2022 Fair Value Price | 2023 Fair Value Price |
12-Month Forward Fair Value |
| Potentially Reasonable Buy | 0% | $241.30 | $266.57 | $263.65 |
| Potentially Good Buy | 5% | $229.24 | $253.24 | $250.47 |
| Potentially Strong Buy | 15% | $205.11 | $226.58 | $224.10 |
| Potentially Very Strong Buy | 25% | $171.93 | $199.92 | $197.74 |
| Potentially Ultra-Value Buy | 35% | $156.85 | $173.27 | $171.37 |
| Currently | $231.12 | 4.22% | 13.30% | 12.34% |
| Upside To Fair Value (Including Dividends) | 5.58% | 16.51% | 15.25% |
For anyone comfortable with MSFT’s risk profile, it’s a potentially good buy today.
And at $171, it would become an Ultra-Value Buffett-style table-pounding “fat pitch” buy.
By the end of the year, $173 becomes the Ultra Value buy price, because 12-month forward earnings are Wall Street’s favorite valuation metric.
By Q1 of 2023, when Morgan Stanley thinks the market will finally bottom for good:
- MSFT fair value $279
- Ultra Value Buy price: $181
By Q2 of 2023, when Goldman thinks the market will finally bottom:
- MSFT fair value $291
- Ultra Value Buy price: $189
By the end of 2023, when JPMorgan thinks the market will bottom for good:
- MSFT fair value: $316
- Ultra Value Buy price: $205
What if you buy MSFT today? Then here’s a reasonable idea of the returns you can make.
Microsoft 2025 Consensus Total Return Potential
(Source: FAST Graphs, FactSet)
If MSFT grows as expected and returns to historical fair value in the Nadella era, it could deliver 18% annual returns through mid 2025.
- about 50% more than the S&P 500
Microsoft 2028 Consensus Total Return Potential
(Source: FAST Graphs, FactSet)
If MSFT grows as expected and returns to historical fair value by mid 2028, it could deliver 114% returns or 14% annually.
- about 2X the S&P 500 consensus
- but with less fundamental risk than US treasury bonds according to S&P
Microsoft Investment Decision Score
DK (Source: Dividend Kings Zen Research Terminal)

MSFT is a potentially very good Ultra SWAN dividend growth opportunity for anyone comfortable with its risk profile. Look at how it compares to the S&P 500.
- 12% discount to fair value vs. 3% S&P = 9% better valuation
- 1.2% safe yield vs. 1.8% (growing 10% CAGR)
- 15% better long-term annual return potential
- 50% higher risk-adjusted expected returns
Risk Profile: Why Microsoft Isn’t Right For Everyone
There are no risk-free companies, and no company is right for everyone. You have to be comfortable with the fundamental risk profile.
MSFT’s Risk Profile Includes
- Legacy high-margin business is being disrupted (by MSFT itself)
- disruption risk: AMZN and GOOG are the other two titans in cloud computing, but lots of smaller rivals (like CRM)
- M&A execution risk: $85 billion Activision purchase is the biggest in its history by far
- regulatory risk: mostly for future acquisitions as well as data tracking
- talent retention risk in the tightest job market in 50 years (tech is a high-wage sector)
- currency risk: modest headwind this year
How do we quantify, monitor, and track such a complex risk profile? By doing what big institutions do.
Long-Term Risk Management Analysis: How Large Institutions Measure Total Risk
- see the risk section of this video to get an in-depth view (and link to two reports) of how DK and big institutions measure long-term risk management by companies
DK uses S&P Global’s global long-term risk-management ratings for our risk rating.
- S&P has spent over 20 years perfecting their risk model
- which is based on over 30 major risk categories, over 130 subcategories, and 1,000 individual metrics
- 50% of metrics are industry specific
- this risk rating has been included in every credit rating for decades
The DK risk rating is based on the global percentile of how a company’s risk management compares to 8,000 S&P-rated companies covering 90% of the world’s market cap.
Microsoft Scores 97th Percentile On Global Long-Term Risk Management
S&P’s risk management scores factor in things like:
- supply chain management
- crisis management
- efficiency
- labor relations
- talent retention and training
- innovation management
- privacy protection
- information/cyber security
- customer relationship management
- climate strategy adaptation
- environmental policy management
- corporate governance
- brand management
Microsoft Long-Term Risk Management Is The 23rd Best In The Master List (95 Percentile In The Master List)
| Classification | S&P LT Risk-Management Global Percentile |
Risk-Management Interpretation |
Risk-Management Rating |
| BTI, ILMN, SIEGY, SPGI, WM, CI, CSCO, WMB, SAP, CL | 100 | Exceptional (Top 80 companies in the world) | Very Low Risk |
| Microsoft | 97 | Exceptional | Very Low Risk |
| Strong ESG Stocks | 86 |
Very Good |
Very Low Risk |
| Foreign Dividend Stocks | 77 |
Good, Bordering On Very Good |
Low Risk |
| Ultra SWANs | 74 | Good | Low Risk |
| Dividend Aristocrats | 67 | Above-Average (Bordering On Good) | Low Risk |
| Low Volatility Stocks | 65 | Above-Average | Low Risk |
| Master List average | 61 | Above-Average | Low Risk |
| Dividend Kings | 60 | Above-Average | Low Risk |
| Hyper-Growth stocks | 59 | Average, Bordering On Above-Average | Medium Risk |
| Dividend Champions | 55 | Average | Medium Risk |
| Monthly Dividend Stocks | 41 | Average | Medium Risk |
(Source: DK Research Terminal)
MSFT’s risk-management consensus is in the top 5% of the world’s highest quality companies and similar to that of such other blue-chips as
- Abbott Labs (ABT): Ultra SWAN dividend king
- Colgate-Palmolive (CL): Ultra SWAN dividend king
- British American Tobacco (BTI): Ultra SWAN global aristocrat
- Canadian National Railway (CNI): Ultra SWAN global aristocrat
- Amgen (AMGN): Ultra SWAN
- Lockheed Martin (LMT): Ultra SWAN
The bottom line is that all companies have risks, and MSFT is exceptional at managing theirs according to S&P.
How We Monitor Microsoft’s Risk Profile
- 53 analysts
- three credit rating agencies
- 56 experts who collectively know this business better than anyone other than management
- the bond market for real time fundamental risk-assessment
“When the facts change, I change my mind. What do you do, sir?” – John Maynard Keynes
There are no sacred cows at iREIT or Dividend Kings. Wherever the fundamentals lead, we always follow. That’s the essence of disciplined financial science, the math behind retiring rich and staying rich in retirement.
Bottom Line: Be Ready To Back Up The Truck On Microsoft In The Coming Months
Let me be clear: I’m NOT calling the bottom in MSFT (I’m not a market-timer).
Fundamentals are all that determine safety and quality, and my recommendations.
Over 30+ years, 97% of stock returns are a function of pure fundamentals, not luck
- in the short term; luck is 25X as powerful as fundamentals
- in the long term, fundamentals are 33X as powerful as luck
While I can’t predict the market in the short term, here’s what I can tell you about MSFT.
- As close to a perfect dividend growth stock as can exist on Wall Street
- 11.5% CAGR long-term total return consensus, better than the dividend aristocrats and S&P 500
- 12% historically undervalued, a potentially good buy
- 13.4X cash-adjusted PE
- 114% consensus return potential over the next five years, 14% CAGR, about 50% more than the S&P 500
- 50% better risk-adjusted expected returns of the S&P 500 over the next five years
MSFT could fall a lot more if the blue-chip consensus is right (and fundamentals indicator they probably are).
But anyone buying MSFT today is very unlikely to regret it in 5+ years.
Remember that market timing is a fool’s errand, and 70% of the time investing all your money right away is the optimal strategy.
- 85% to 90% in a bear market like this one
With a fast-growing world-beater like MSFT, with its AAA-credit rating, .07% fundamental risk, and wide moat, you don’t want to try to be cute and miss out on the chance to buy it at a good price.
Just be ready to buy more at a better price if the market gods are kind enough to grant us one.
Be the first to comment