

Nic Antaya
Investment Thesis
- The strong brand images of General Motors (NYSE:GM) and Ford (NYSE:F) as well as their spending on Research & Development [R&D] help to build an economic moat over their competitors. In 2021, General Motors had a market share of 13.9% in North America, while Ford’s was 12% in the same year.
- When it comes to autonomous vehicles [AVs], General Motors seems to be ahead of Ford: in June 2022, General Motors’ self-driving car subsidiary Cruise started to operate its self-driving taxi service in San Francisco. In the upcoming three months, the company will expand to the states of Texas and Arizona.
- However, Ford’s electric vehicle [EVs] plans appear to be more ambitious: the company announced in March of 2022 that it plans to produce more than two million electric vehicles per year by 2026. (General Motors’ goal is to produce more than one million EVs in North America per year by 2026.)
- According to the HQC Scorecard, both companies are rated as moderately attractive in terms of risk and reward: General Motors scores 54/100 points while Ford receives 45/100. In the categories of Valuation and Expected Return, General Motors is rated significantly higher than Ford.
- I rate General Motors as a buy, and Ford receives my hold rating. General Motors has a Free Cash Flow Yield [FY1] of 12.28% which is significantly higher than Ford’s (6.71%), thus contributing to make General Motors the more attractive choice in my opinion. Additionally, both my DCF Model and Relative Valuation Models (such as the P/E [FWD] Ratio) indicate that General Motors is currently undervalued and that Ford is currently overvalued.
- Taking into account General Motors’ current stock price of $39.89, I expect a compound annual rate of return of about 14% for the company. Considering Ford’s current stock price of $13.57, I expect a compound annual rate of return of approximately 5%. The numbers are based on the calculations of my DCF Models.
The Competitive Positions of General Motors and Ford
Both General Motors and Ford have spent a relatively high amount of revenue on Research & Development [R&D]. In 2021, the R&D expenditure of General Motors was $7.9 billion while Ford’s R&D spending was $7.6 billion. This implies an R&D Expense to Revenue Ratio (which measures the percentage of sales that is allocated to R&D expenditures) of 6.95% for General Motors and 6.02% for Ford. This relatively high R&D spending as well as having strong brand images, helps the companies to build an economic moat over their competitors.
General Motors achieved a market share of 13.9% in North America in 2021 while competitor Ford obtained a market share of 12% (in the same region and year). These numbers demonstrate the strong competitive position that the companies have in North America, showing a combined market share of over 25% in the region.
Both companies have ambitious goals concerning the production of electric vehicles: General Motors has committed to making investments of more than $35.0 billion between 2020 and 2025 in both electric vehicles (EVs) and autonomous vehicles (AVs). The company plans to launch more than 30 EVs globally by 2025. Its goal is to produce more than one million EVs in North America per year by 2026. Ford announced in March of 2022 that it intends to produce more than two million EVs per year by 2026.
When it comes to its autonomous vehicles, General Motors appears to be ahead of Ford: in June 2022, its self-driving car subsidiary Cruise started to operate a self-driving taxi service in San Francisco. The company owns 80% of the San Francisco-based Cruise. The goal of Cruise is $1 billion in revenue by 2025. This Monday, Cruise CEO Kyle Vogt said that it will bring a driverless taxi fleet to the states of Texas and Arizona in the next three months. The fact that Cruise won the first California permit to carry paying riders in driverless cars shows that the General Motors subsidiary is on track. On the other hand, Argo AI, which is a self-driving company backed by Ford and Volkswagen, closed its Washington, DC operation as part of a broader round of layoffs which impacted about 150 employees.
By 2030, General Motors plans to expand its margins to 12%-14%. While Ford aims to achieve an adjusted EBIT margin of 10% by 2026.
The Valuation of General Motors and Ford
Discounted Cash Flow [DCF]-Model
I have used the DCF Model to determine the intrinsic value of General Motors and Ford. The method calculates a fair value of $54.41 for General Motors and $9.01 for Ford. At the current stock prices, this gives General Motors an upside of 36.40% and implies a downside for Ford of 33.60%.
Market Value vs. Intrinsic Value
|
GM |
Ford |
|
|
Market Value |
$39.89 |
$13.57 |
|
Upside |
36.40% |
-33.60% |
|
Intrinsic Value |
$54.41 |
$9.01 |
Source: The Author
Internal Rate of Return for General Motors
The Internal Rate of Return [IRR] is defined as the expected compound annual rate of return earned on an investment. Below you can find the Internal Rate of Return as according to my DCF Model when assuming different purchase prices for the General Motors stock.
At General Motors’ current stock price of $39.89, my DCF Model indicates an Internal Rate of Return of approximately 14% for the company. (In bold you can see the Internal Rate of Return for General Motors’ current stock price of $39.89.)
|
Purchase Price of the General Motors Stock |
Internal Rate of Return as according to my DCF Model |
|
$15 |
25% |
|
$20 |
22% |
|
$25 |
20% |
|
$30 |
18% |
|
$35 |
16% |
|
$39.89 |
14% |
|
$40 |
14% |
|
$45 |
12% |
|
$50 |
11% |
|
$55 |
9% |
|
$60 |
8% |
|
$65 |
7% |
Source: The Author
Internal Rate of Return for Ford
At Ford’s current stock price of $13.57, my DCF Model indicates an Internal Rate of Return of 5% for the company. (In bold you can see the Internal Rate of Return for Ford’s current stock price of $13.57.)
|
Purchase Price of the Ford Stock |
Internal Rate of Return as according to my DCF Model |
|
$4 |
20% |
|
$6 |
16% |
|
$8 |
12% |
|
$10 |
9% |
|
$12 |
7% |
|
$13.57 |
5% |
|
$14 |
5% |
|
$16 |
3% |
|
$18 |
1% |
|
$20 |
-1% |
|
$22 |
-2% |
Source: The Author
Relative Valuation Models
The P/E [FWD] Ratio for General Motors and Ford
General Motors P/E [FWD] Ratio is currently 6.46, which is 52.57% below the Sector Median (13.62) and 54.58% below its 5 Year Average (14.06), indicating that the company is currently strongly undervalued.
Ford’s current P/E [FWD] Ratio is 19.56, which is 43.65% above the Sector Median (13.62), showing that Ford is currently overvalued.
Both my DCF Model and Relative Valuation Models such as the P/E [FWD] Ratio indicate that General Motors is currently undervalued and that Ford is currently overvalued.
Fundamentals: General Motors vs. Ford
General Motors and Ford show relatively similar EBIT Margins: while Ford has an EBIT Margin of 7.82%, General Motors’ is at 7.93%. However, when it comes to Return on Equity [ROE], Ford shows significantly higher results: while General Motors has an ROE of 13.63%, Ford’s is 29.39%. This higher ROE is an indicator that Ford’s management is more efficient in converting its equity financing into profits.
Ford’s Dividend Yield [FWD] of 4.60% is currently much higher than the one of General Motors (0.96%), which makes General Motors the more attractive choice for dividend income investors. However, General Motors has a Free Cash Flow Yield [FY1] of 12.28%, which is significantly higher than that of Ford (6.71%). The Free Cash Flow Yield [FY1] compares the free cash flow per share that a company is expected to earn against its market value per share. When deciding to invest in one of the two automobile manufacturers, the higher Free Cash Flow Yield [FY1] of General Motors contributes to the fact that I would choose the company over Ford.
When comparing the companies’ Free Cash Flow Per Share Growth Rate [FWD], my opinion is strengthened: while General Motors’ is 28.24%, Ford’s is at -38.84%.
Additionally, General Motors Total Debt to Equity Ratio of 163.96% is significantly lower (Ford’s is 294.40%). This indicates that an investment in General Motors comes with lower risk compared to investing in Ford. These results once again strengthen my investment thesis. In the table below you can find some selected financial data for General Motors and Ford.
|
General Motors |
Ford |
||
|
General Information |
Ticker |
GM |
F |
|
Sector |
Consumer Discretionary |
Consumer Discretionary |
|
|
Industry |
Automobile Manufacturers |
Automobile Manufacturers |
|
|
Market Cap |
59.28B |
59.86B |
|
|
Profitability |
EBIT Margin |
7.93% |
7.82% |
|
ROE |
13.63% |
29.39% |
|
|
Valuation |
P/E GAAP [FWD] |
6.72 |
22.25 |
|
Growth |
Revenue Growth 3 Year [CAGR] |
-3.09% |
-2.28% |
|
Revenue Growth 5 Year [CAGR] |
-2.90% |
-0.74% |
|
|
EBIT Growth 3 Year [CAGR] |
9.87% |
41.38% |
|
|
EPS Growth Diluted [FWD] |
9.49% |
69.35% |
|
|
Free Cash Flow |
Free Cash Flow Yield [TTM] |
NM |
11.42% |
|
Free Cash Flow Yield [FY1] |
12.28% |
6.71% |
|
|
Free Cash Flow Per Share Growth Rate [FWD] |
28.24% |
-38.84% |
|
|
Dividends |
Dividend Yield [FWD] |
0.96% |
4.60% |
|
Dividend Growth 3 Year [CAGR] |
-61.02% |
-9.14% |
|
|
Dividend Growth 5 Year [CAGR] |
-43.18% |
-5.59% |
|
|
Consecutive Years of Dividend Growth |
0 Years |
0 Years |
|
|
Dividend Frequency |
Quarterly |
Quarterly |
|
|
Income Statement |
Revenue |
132.10B |
148.03B |
|
EBITDA |
16.43B |
17.45B |
|
|
Balance Sheet |
Total Debt to Equity Ratio |
163.96% |
294.40% |
Source: Seeking Alpha
The High-Quality Company [HQC] Scorecard
“The aim of the HQC Scorecard that I have developed is to help investors identify companies which are attractive long-term investments in terms of risk and reward.” Here you can find a detailed description of how the HQC Scorecard works.
Overview of the Items on the HQC Scorecard
“In the graphic below, you can find the individual items and weighting for each category of the HQC Scorecard. A score between 0 and 5 is given (with 0 being the lowest rating and 5 the highest) for each item on the Scorecard. Furthermore, you can see the conditions that must be met for each point of every rated item.”
Source: The Author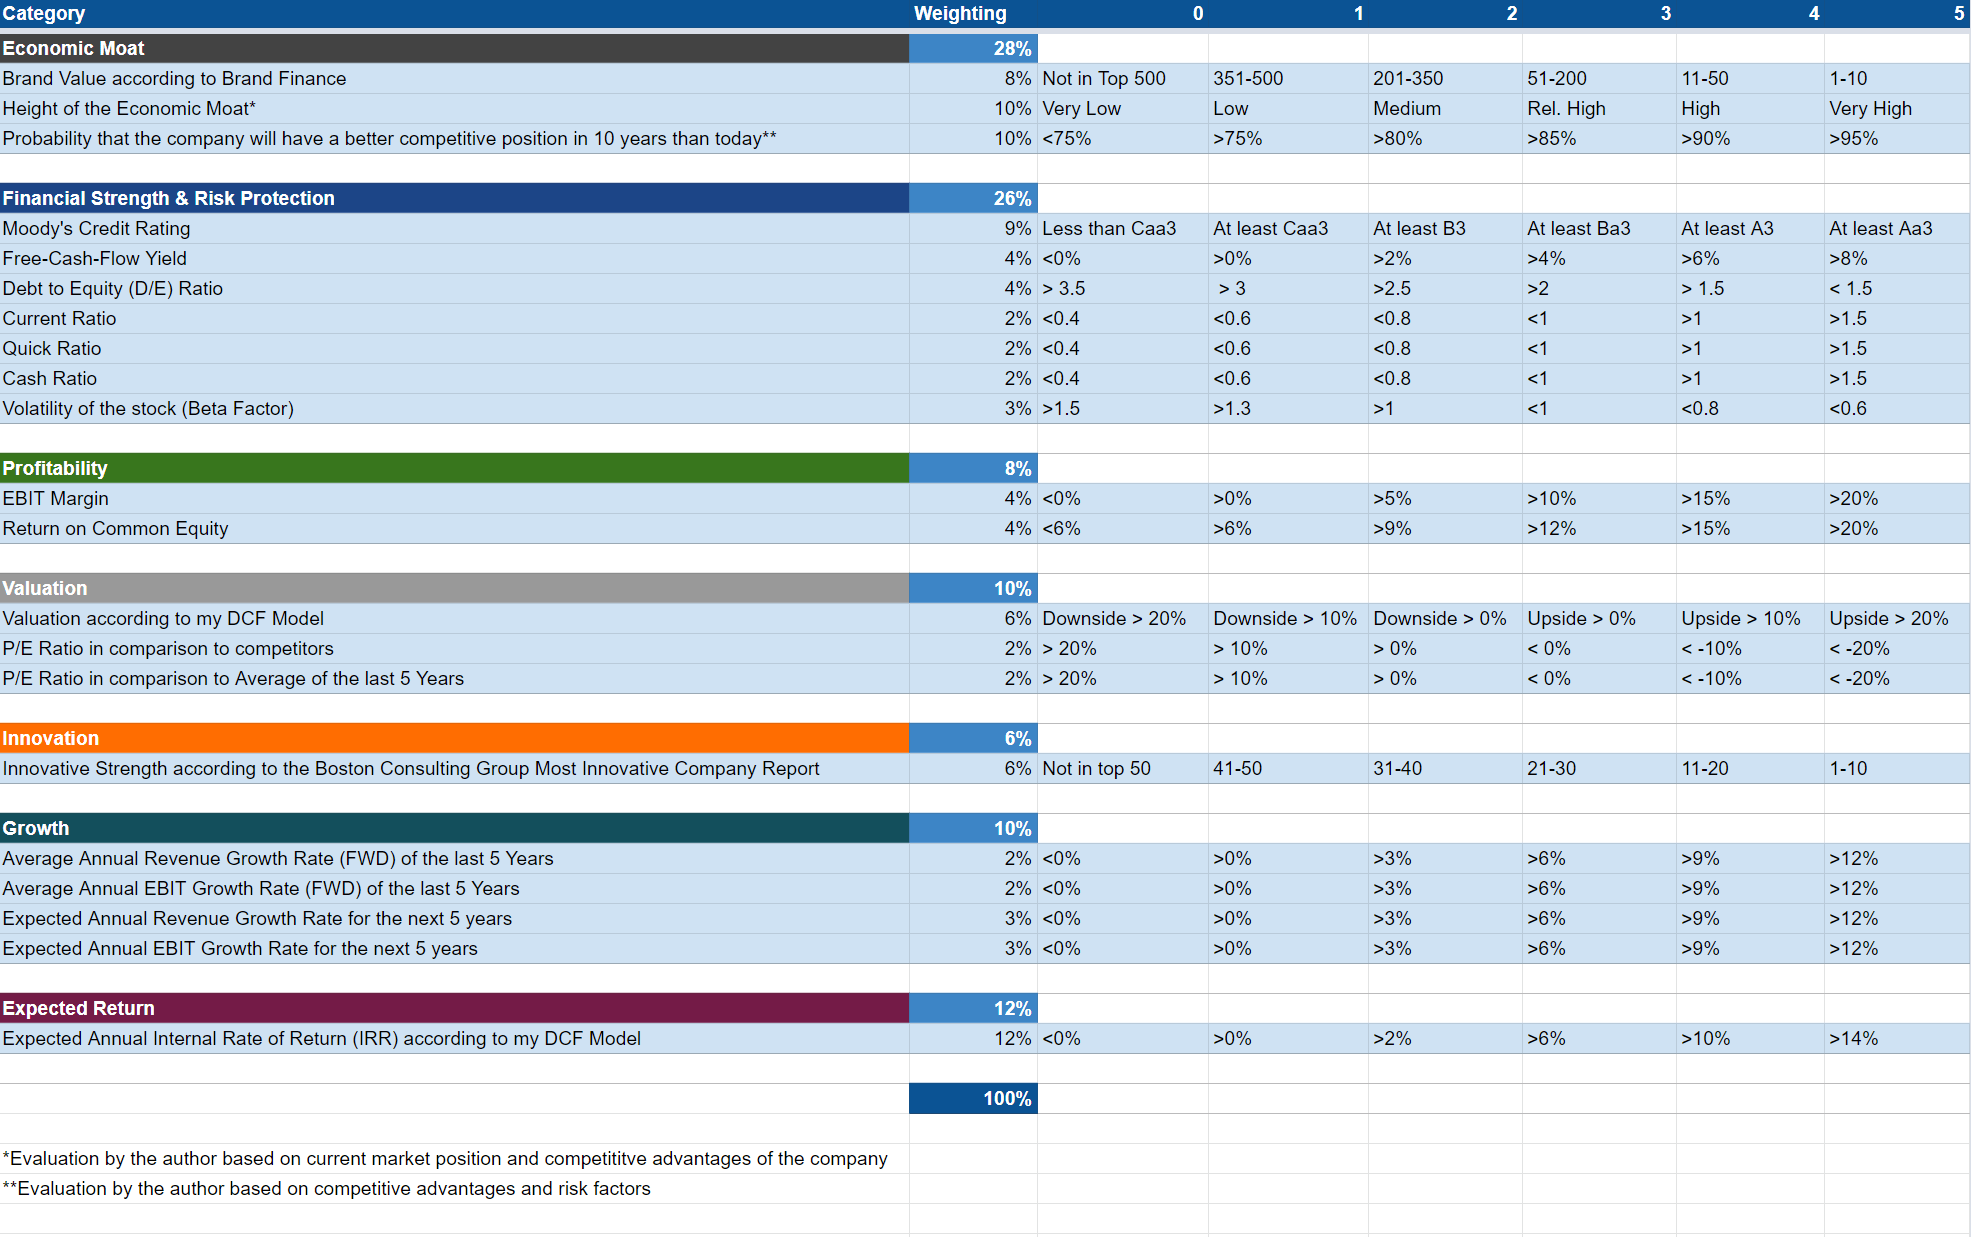
General Motors and Ford According to the HQC Scorecard
Source: The Author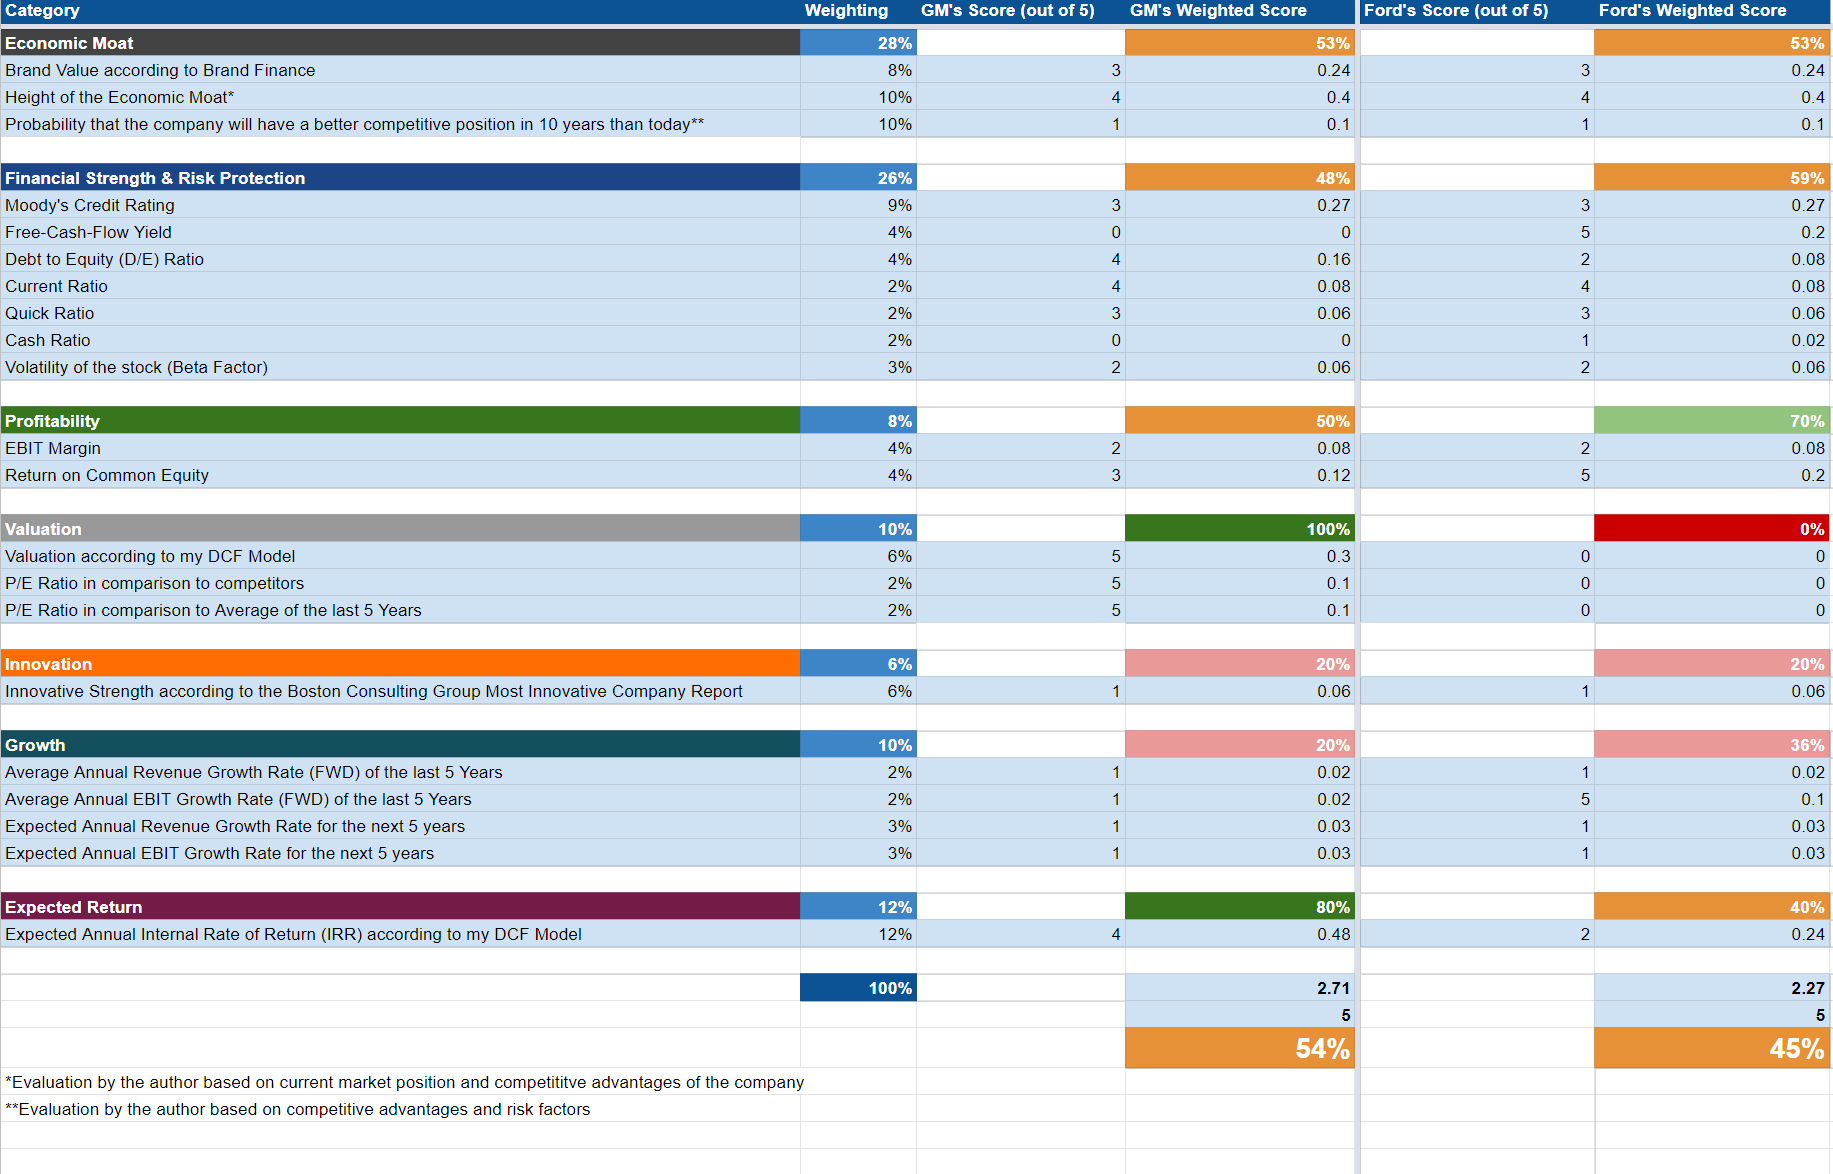
As according to the HQC Scorecard, General Motors and Ford are rated as moderately attractive when it comes to risk and reward: while General Motors receives 54/100 points, Ford scores 45/100.
For Economic Moat, both General Motors and Ford achieve a moderately attractive rating (both receive 53/100 points). For Financial Strength, Ford is rated with 59/100 points while General Motors is rated with 48/100. In terms of Profitability, Ford is rated as attractive, achieving 70/100 points while General Motors only reaches 50/100. Ford’s higher rating in terms of Profitability is a result of the company’s higher Return on Equity of 29.39% (while General Motors’ is 13.63%).
For Valuation, General Motors is rated as very attractive (100/100 points) while Ford is rated as very unattractive (0/100). In terms of Growth, both companies are rated as unattractive (20/100 for General Motors, 36/100 for Ford). When it comes to Expected Return, General Motors receives a very attractive rating (80/100) while Ford gets a moderately attractive rating (45/100).
The overall rating of the HQC Scorecard indicates that General Motors is currently the slightly more attractive option at this moment in time when deciding to invest in one of these two companies.
Risk Factors
There are several factors that show us that an investment in the Automobile Manufacturers Industry comes with relatively high risks:
First, EBIT-Margins in the Automobile Manufacturers Industry are relatively low. The EBIT-Margins of General Motors and Ford (7.93% and 7.82% respectively) are proof of this. As an example, a relatively low EBIT-Margin suggests that it’s more likely a company could generate losses in times of a recession.
Second, automobile manufacturers such as General Motors and Ford have relatively high fixed labor costs and they often have limitations on their ability to reduce fixed costs (which, for example, can be a result of collective bargaining agreements). Because of the relatively high fixed structural costs, small declines in the companies’ revenues can have large effects on their profitability.
Third, the automotive industry is cyclical and in times of recession a decreasing demand for vehicles can have a significant impact on the revenue and profit margins of car manufacturers.
Fourth, increases in prices for commodities and raw materials used by car manufacturers can lead to significantly higher production costs for parts, components and vehicles, which could then cause a decrease in the companies’ profit margins. This is another important factor to consider in these times of inflation.
Due to the risk factors mentioned above, I would limit investments in companies within the Automobile Manufacturers Industry to a maximum of 5% of a total investment portfolio.
When considering the risk of investing in Ford and General Motors in particular, two characteristics stand out: the lower Debt to Equity Ratio of General Motors and its higher credit rating as compared to Ford:
Ford’s Total Debt to Equity Ratio of 294.40% is significantly higher than the one of General Motors (163.96%), which indicates that investing in Ford comes with much higher risk than investing in General Motors.
The credit ratings by Moody’s underline that it’s riskier to invest in Ford over General Motors: General Motors receives a Baa3 credit rating (obligations rated Baa are subject to moderate credit risk) while Ford gets a Ba2 credit rating (obligations rated Ba are judged to have speculative elements). These credit ratings reinforce the theory that General Motors is currently more attractive in terms of risk and reward.
The Bottom Line
After comparing General Motors and Ford, I have come to the conclusion that General Motors is currently the more attractive choice:
Both my DCF Models and Relative Valuation Models show that General Motors is currently undervalued and that Ford is currently overvalued. Furthermore, the Free Cash Flow Yield [FY1] of 12.28% for General Motors is significantly higher than that of Ford (6.71%), which once again underlines my belief that General Motors can be seen as the more attractive investment choice at this moment in time.
As according to the HQC Scorecard, General Motors and Ford are rated as moderately attractive when it comes to risk and reward. However, General Motors is rated slightly higher (with 54/100 points), while Ford scores (45/100) points. In the categories of Valuation and Expected Return, General Motors shows significantly higher results than its competitor.
Ford’s significantly higher Debt to Equity Ratio of 294.40% as compared to the one of General Motors (163.96%), confirms that an investment in Ford comes with higher risk. This is also confirmed by General Motors higher Baa3 credit rating by Moody’s (while Ford receives a Ba2 credit rating).
However, if a high Dividend Yield is the driving factor behind your investment decision, then you might select Ford, since its Dividend Yield [FWD] of 4.6% is well above that of General Motors (0.96%).
I currently rate General Motors as a buy while I rate Ford as a hold. Due to the relatively high risk factors of the Automobile Manufacturers Industry that I have mentioned before, I would recommend not to invest more than 5% of your investment portfolio in companies from this industry.
Which is your favorite of the two companies discussed in this article?
Be the first to comment