

Seiya Tabuchi
Thesis
I saw the question in the first summary bullet point a few days from a friend. Let me debunk the sensation out of it upfront so we can look at our world more calmly and rationally. Firstly, the exact comparison between our current events and the historical events back in the 1930s is debatable (Neville Chamberlain resignation, Inukai Tsuyoshi assassination, and Stalin’s war on organized religion). Secondly and more importantly, there is a standard recipe to produce similar sensations. The recipe is pretty simple: you generate plenty of details of any two events (or two time periods) and then you are guaranteed to see plenty of similarities. It’s a mathematical certainty that enough digits will overlap between any two streams of random numbers when they are sufficiently long. So now you know the secret of producing articles like “8 mysterious similarities between Lincoln and Kennedy assassination” and “12 wicked similarities between WWI and WWII”.
After debunking the sensation, unfortunately, our world is not totally different from the 1930s in many fundamental ways. Globalization is in retreat as the tension between the two superpowers intensifies. Polarization is both increasing at the country level (like within the U.S. or the U.K.), regional levels (the Europe and Asia-Pacific region as we will see immediately in the next section), and also global level. For better or worse, if you want peace, you prepare for war. Since the Russian/Ukraine war broke out, all major countries (China, U.S., Germany, et al) are prioritizing their military spending. And the recent tragic assassination of former Japanese Prime Minister Shinzo Abe, in my view, just added another instability factor to the world peace. As the longest serving prime minister and a monumental political figure in Japan, his passing will have a range of implications within Japan and beyond.
Under this background, this article will analyze two leading defense stocks, General Dynamics (NYSE:GD) and Raytheon Technologies (NYSE:RTX). To me, the current developments around the world signal a new cycle for the defense sector.
Retreat of globalization and increased polarization
Raytheon Technologies CEO Greg Hayes commented recently that the Russian/Ukraine war changed the geopolitical landscape and the dynamics of the defense sector COMPLETELY.
What’s happened in Ukraine has been awful from a humanitarian standpoint, from a geopolitical standpoint. And it has changed the dynamic of the defense industry completely.
I gloomily agree. Then the recent assassination of Shinzo Abe brought Japan’s expanded rearmament plan to my mind. According to this Military Balance Plus report published shortly before the assassination (on June 10, 2022), Japan’s governing Liberal Democratic Party (LDP) proposed a five-year timeframe to achieve its declared ambition of doubling defense spending to 2% of GDP. And the former prime minister commented that the increased defense budget would mean a “new level” of cooperation with allies and deterrence of potential adversaries. Shortly after the assassination (on July 8, 2022), Reuters reported that:
Japan will forgo setting a ceiling on defense spending in next fiscal year’s annual budget… highlighting Tokyo’s interest in boosting defense at a time of tension with its powerful neighbour China.
This following report provides some contexts to interpret what a defense budget of 2% of GDP means:
As a rule of thumb, a 1% GDP defense budget funds a National Guard-like defense force. It can supplement police departments when needed and provide effective security for large international events, like the recent Tokyo Olympics. A 2% GDP defense budget would probably allow Japan to project power regionally and deter neighborhood bullies like Russia, North Korea, and China. Furthermore, a larger defense budget would put Japan on more even terms with Australia and other regional allies. A 3%GDP budget allows a country to project power globally. By comparison, the United States has a 3.4% GDP defense budget.
As a major ally, the U.S. has both a vested interest and extensive presence in Japan. The U.S. currently operates a total of 7 military facilities in Japan. The U.S. Forces in Japan are headquartered at the Yokota Air Base in the Tokyo area. And as Japan’s rearmament progresses, leading U.S. defense contractors such as GD and RTX will play a major role, as elaborated below.
GD and RTX’s role in the defense sector
Both GD and RTRX are leaders in the defense sector. It has four segments, Aerospace (21% of 2021 companywide sales); Combat Systems (19%); Marine Systems (27%); and Technologies (32%). The U.S. Government accounts for 69% of total revenues and the rest comes from overseas. RTX is a leader in the development of missile defense systems for 17 nations around the globe. Its recent merger with the legacy United Technologies brands also expanded its role in the manufacturing and services of commercial and military aircraft engines.
Both companies have been actively engaged with the national defense of many countries around the world as just mentioned. A few examples particular to Japan, GD is the world’s leading provider of wheeled combat vehicles. And back in 2019, GD’s land systems have been down selected as part of Japan’s Next Armored Wheeled Vehicle project (although GD later withdraw from the bidding). GD has also been supplying fighter jets (a modified YF-16) to Japan under the designation F-16J. And RTX has been a long-term provider of missile systems to Japan. For example, back in 2007, the Japan Maritime Self-Defense Force successfully flight tested its first Raytheon-built Standard Missile-3. And recently in 2022, RTX just secured an $866 million contract to manufacture updated ship-based ballistic missile interceptors for the U.S. government and the Japanese defense ministry.
Under the context of heightened geopolitical tensions since the Russian/Ukraine war broke out, both stocks have performed well against the backdrop of an overall market decline as you can see from the chart below. Both GD and RTX stock prices have delivered positive total returns YTD while the overall market suffered sizable declines. To wit, GD delivered a total return of almost 6% and RTX more than 11%. The S&P 500, in contrast, suffered a loss of more than 15%.
Looking forward, I see the global tensions persist. And the defense budget increases in many nations, especially allies to the U.S. such as Japan, are expected to provide secular support for both businesses in the years to come.
Seeking Alpha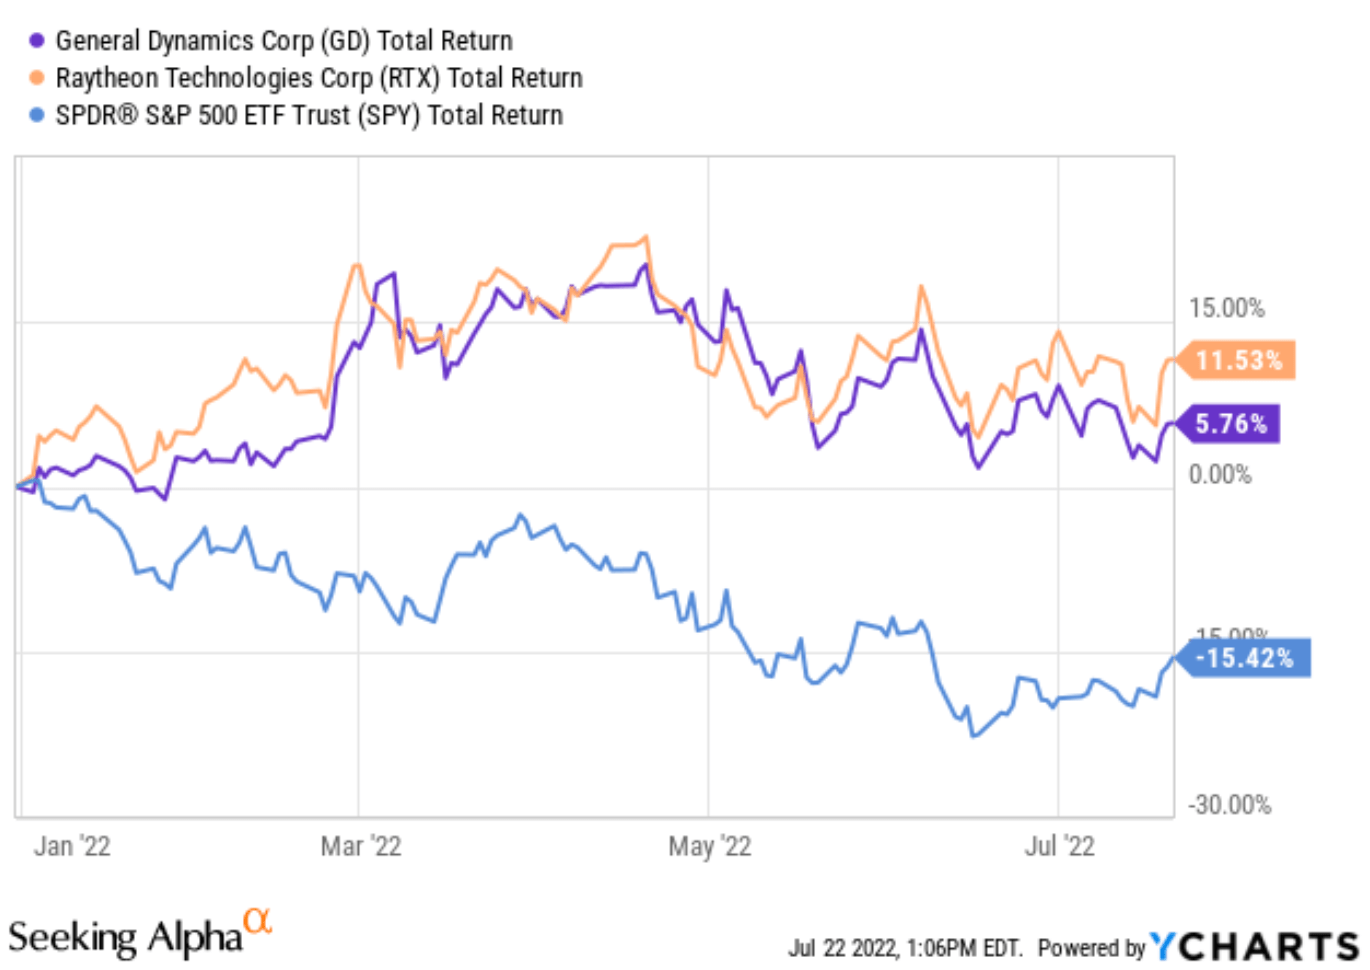
GD and RTX profitability comparison
As you can see from the following chart, both GD and RTX enjoy strong profitability. Comparing profitability is ultimately subjective but my overall impression is that GD is a more profitable one here. To expand the comparison a bit wider, this chart also included another defense leader, Lockheed Martin (LMT). And my view is that GD enjoys about the same level of profitability as LMT too. To cite a few key metrics, GD enjoys a gross margin of 16.7%, a bit lower than RTX’s 19.9%. But GD makes it up in bottom-line metrics such as net profit margin (8.5% vs 6.4%) and also FCF margin (11.3% vs 8.3%). GD’s operation metrics like Return on Asset and asset turnover rates are also substantially better than RTX.
Seeking Alpha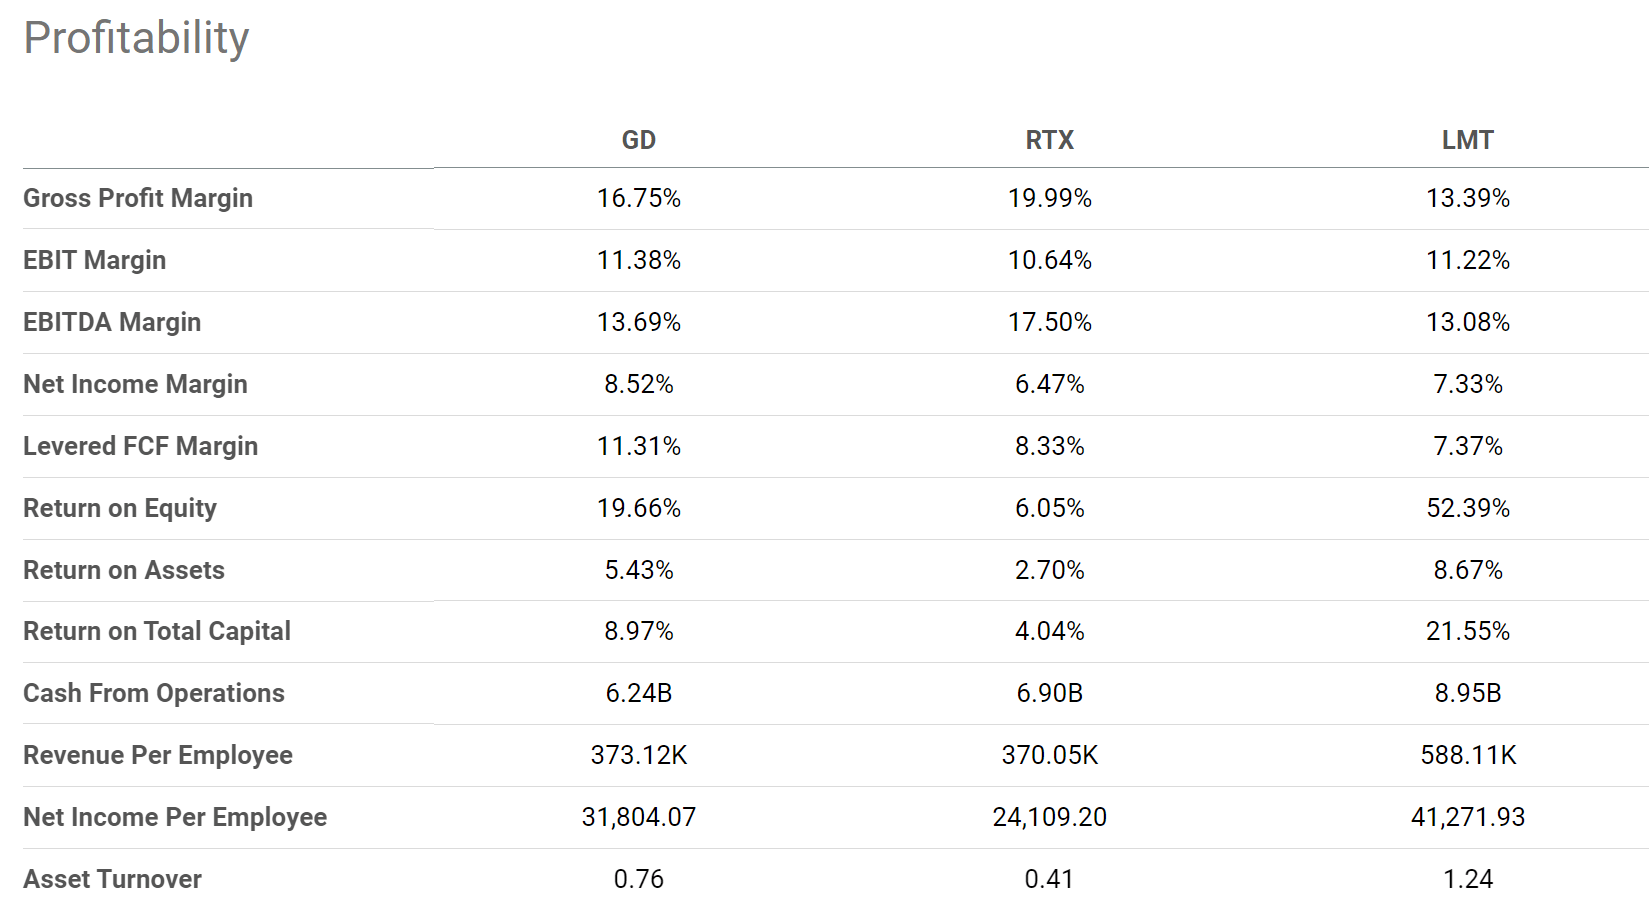
In addition to this snapshot of various metrics, the second chart shows a more fundamental profitability measure over a longer period of time. And as explained in our earlier writings, to me, the ROIC (return on invested capital) provides a more meaningful measure of profitability.
The ROIC comparison provides a more complete picture here from a broader perspective. GD’s ROIC has been relatively consistent except in 2013. Overall, its ROIC has fluctuated between a narrow range of 10% to 20% again excluding the outlier data point in 2013. And its average ROIC in the past decade has been 13.8%. In comparison, RTX’s ROIC has exhibited a bit more volatility and is also lower on average. In recent years, it hovered below 6%, not only below GD but also below its own historical average of 8.15%.
Seeking Alpha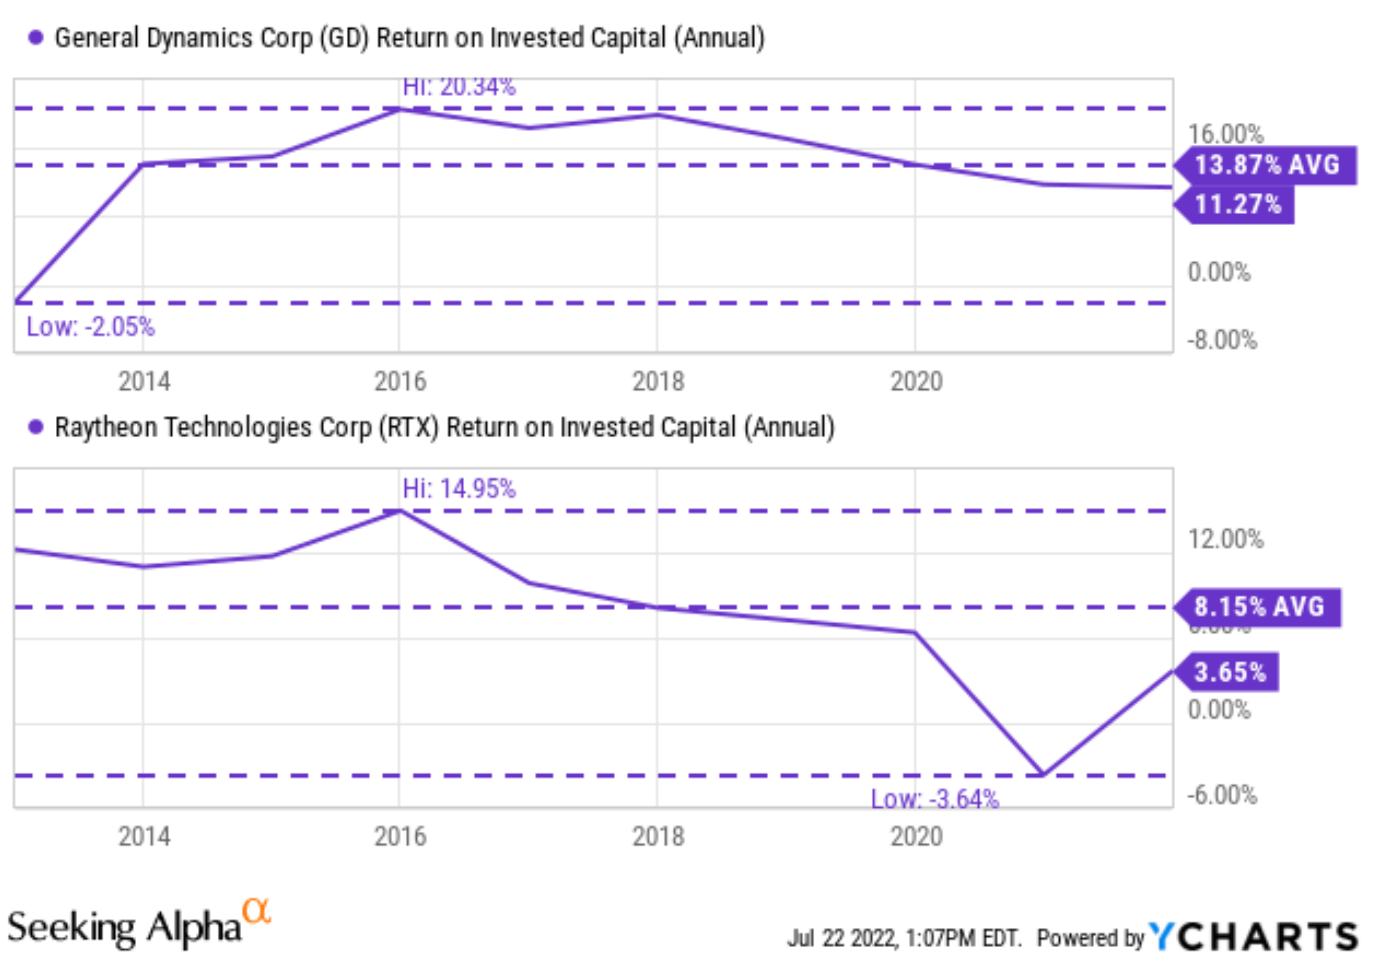
GD and RTX valuation comparison
Despite GD’s superior profitability, it’s trading at a slight discount relative to RTX as you can see from the chart below. Its FY1 PE of 17.88x is more than 10% below RTX (although higher than LMT). Topline metrics such as price to sales or EV/sales ratio also indicate a sizable discount relative to RTX. Take the price-to-sales ratio as an example. GD is valued at a P/S ratio of 1.57, almost a 30% discount relative to RTX, which is difficult to justify in my mind. As we have just established earlier, GD enjoys a better net profit margin than RTX, and hence each dollar of its sales should be worth more, not less.
Seeking Alpha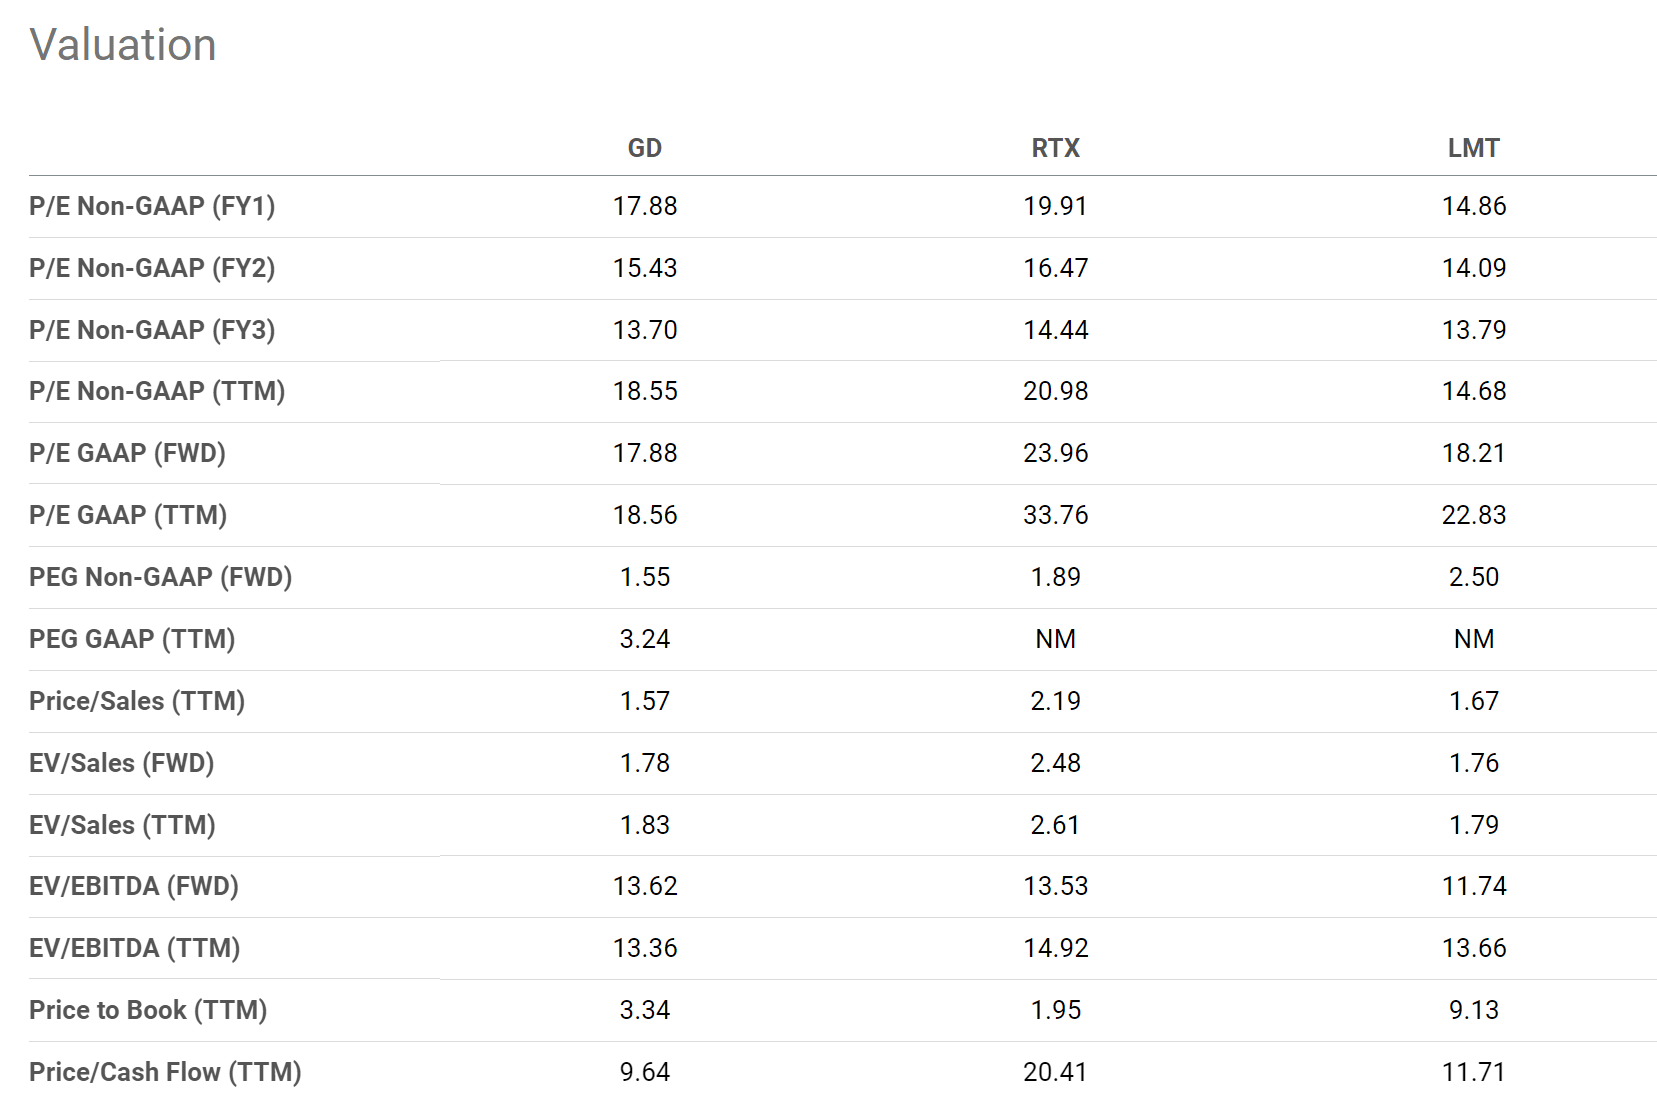
Expected returns
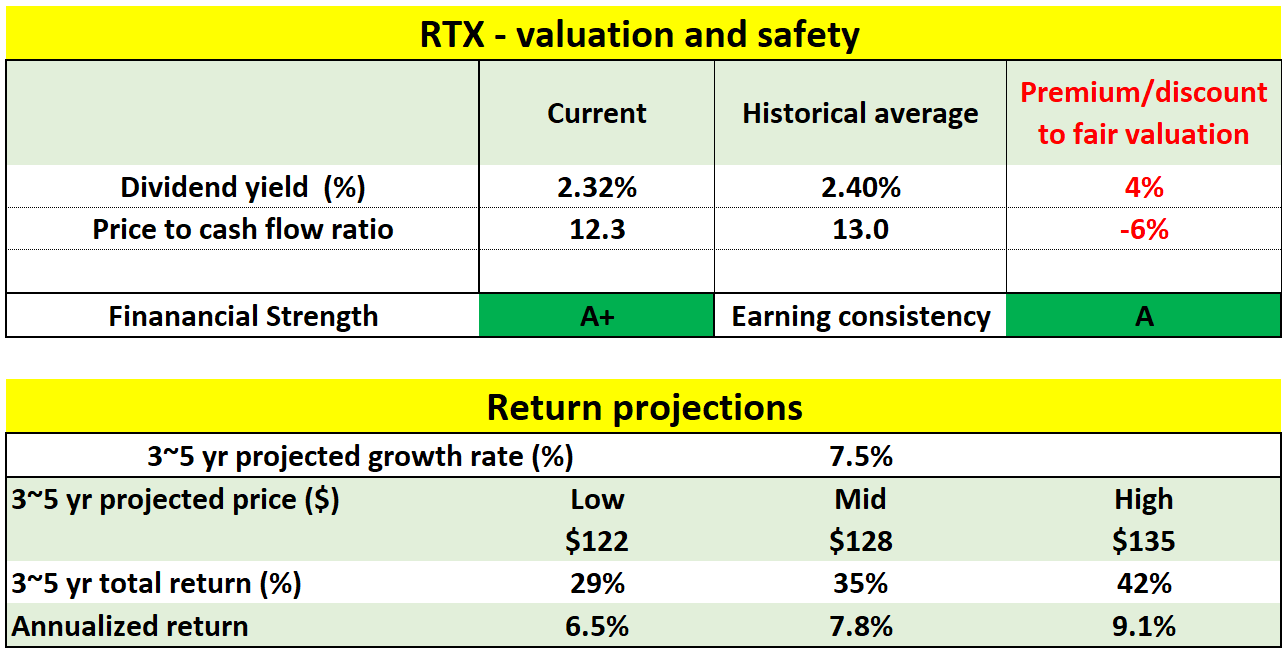
Due to the superior profitability and discounted valuation, my projected return for GD is slightly higher than RTX as shown in the tables below. GD is about fairly valued (a small 3% premium) relative to its historical record in terms of dividend yields. In terms of price to cash flow, its present multiple of 14.3x is at an 8% discount from its historical average of 15.5x. RTX, similarly, is at a 4% premium relative to its historical record in terms of dividend yields and a smaller 6% discount in terms of price to cash flow multiple.
Looking forward, I also see a higher growth rate from GD and my estimate is about 8.5%, compared to RTX’s 7.5%. The main reason is its higher ROIC as aforementioned. A higher ROIC leads to higher growth rates assuming the same reinvestment rates.
All told, for the next 3~5 years, the total return is projected to be in a range of 34% (the low-end projection) to about 50% (the high-end projection) for GD. Such return potential translates into an annual return of 7.6%to 10.8%. The return potential for RTX is slightly lower. Total returns are projected to be in the range of 29% to 42%, translating into annual returns in the range of 6.5% to 9.1%.
Author Author
Final thoughts and risks
Since the Russian/Ukraine war broke out, all major countries have announced plans to prioritize their defense budgets. And the recent assassination of Shinzo Abe has tragically catalyzed Japan’s expansion of its defense budgeting too. In my opinion, as a major U.S. ally, Japan’s rearmament plan will inevitably involve GD and RTX for their airplanes, marine systems, and missile systems. These defense leaders have demonstrated their anti-cyclical price actions recently. And they are currently close to fair valuation. In comparison, GD is more attractively valued and also offers better profitability.
The main risks in the near term involve global supply chain congestion and labor shortages. The following comments from RTX CEO Greg Hayes suggest that these issues can persist well into 2024. Even though the comments came from RTX, they apply equally well to GD.
“I think we’re not going to see the end of the supply chain and the people challenges this year. I think it’s the end of 2023 and going into 2024,”
Be the first to comment