

photoman
In March 2022, gold reached $2072 per ounce on the continuous COMEX futures contract, an all-time nominal high. Since gold eclipsed the 1980 peak of $875 per ounce, the March 2022 high was the fourth new peak that led to a significant correction.
In 2008, the precious metal reached $1,014.60 before correcting 32.9% to a low of $681.00 later that year. In 2011, the high was $1,911.60 before gold worked its way to $1,046.20 in late 2015, a 45.3% drop. After trading to $2,063 on the continuous COMEX futures contract in August 2020, the price corrected by 18.9% to $1,673.70 in March 2021. The latest selloff from the March 2022 $2,072 high took the price to $1,613 in September, a 22.2% drop.
Each correction over the past years had led to a higher high, a pattern since 1999 when the United Kingdom auctioned off half its gold reserves, driving the price to a $252.50 per ounce bottom. The latest correction took nearby gold futures to a slightly higher low of $1615.10 last week, where the market ran out of selling.
Gold mining stocks offer leverage to gold’s price as the miners invest substantial capital in extracting the metal from the earth’s crust. Junior mining stocks can be even more volatile than the senior miners as they explore for gold and extract lower ore grades, offering more upside when the price experiences explosive rallies. The VanEck Vectors Junior Gold Miners ETF (NYSEARCA:GDXJ) product holds a diversified portfolio of junior gold mining stocks. The recent price action could signal that gold will head for another higher high sooner rather than later.
Gold outlook not good after Fed meet
Gold looked awful on Nov. 2 after the FOMC increased the Fed Funds Rate by 75 basis points for the fourth consecutive time. After reaching a $1673.10 lower short-term high on Nov. 2, the price plunged, falling to $1618.30 on the active month December COMEX gold futures contract on Nov. 3. The price action was ugly as rising interest rates took the shine off the precious metal, making it more costly to carry gold inventories. Moreover, rising rates make fixed-income assets shine as yields rise, causing capital to flow from stocks, gold, and other commodities to interest-bearing assets.
In March 2022, the short-term Fed Funds Rate was at zero percent, and the latest rate hike pushed it to a range between 3.75% and 4.00%. In a sign of just how dramatic 2022 rate hikes have been, a conventional 30-year fixed-rate mortgage below the 3% level in late 2021 is currently sitting around 7%. The 4% rise on a $400,000 conventional mortgage means the monthly payment has increased by an astonishing $1,333.33 in less than one year. Aside from weighing on the housing market, higher rates have caused car loans, car leases, and credit card rates to soar. Gold has been only one of the victims of the rising rates.
Aside from increasing short-term rates, quantitative tightening to reduce the US Fed’s swollen balance sheet has pushed rates to multi-year highs further out along the yield curve.
Chart of the 30-Year US Treasury Bond Futures (Barchart)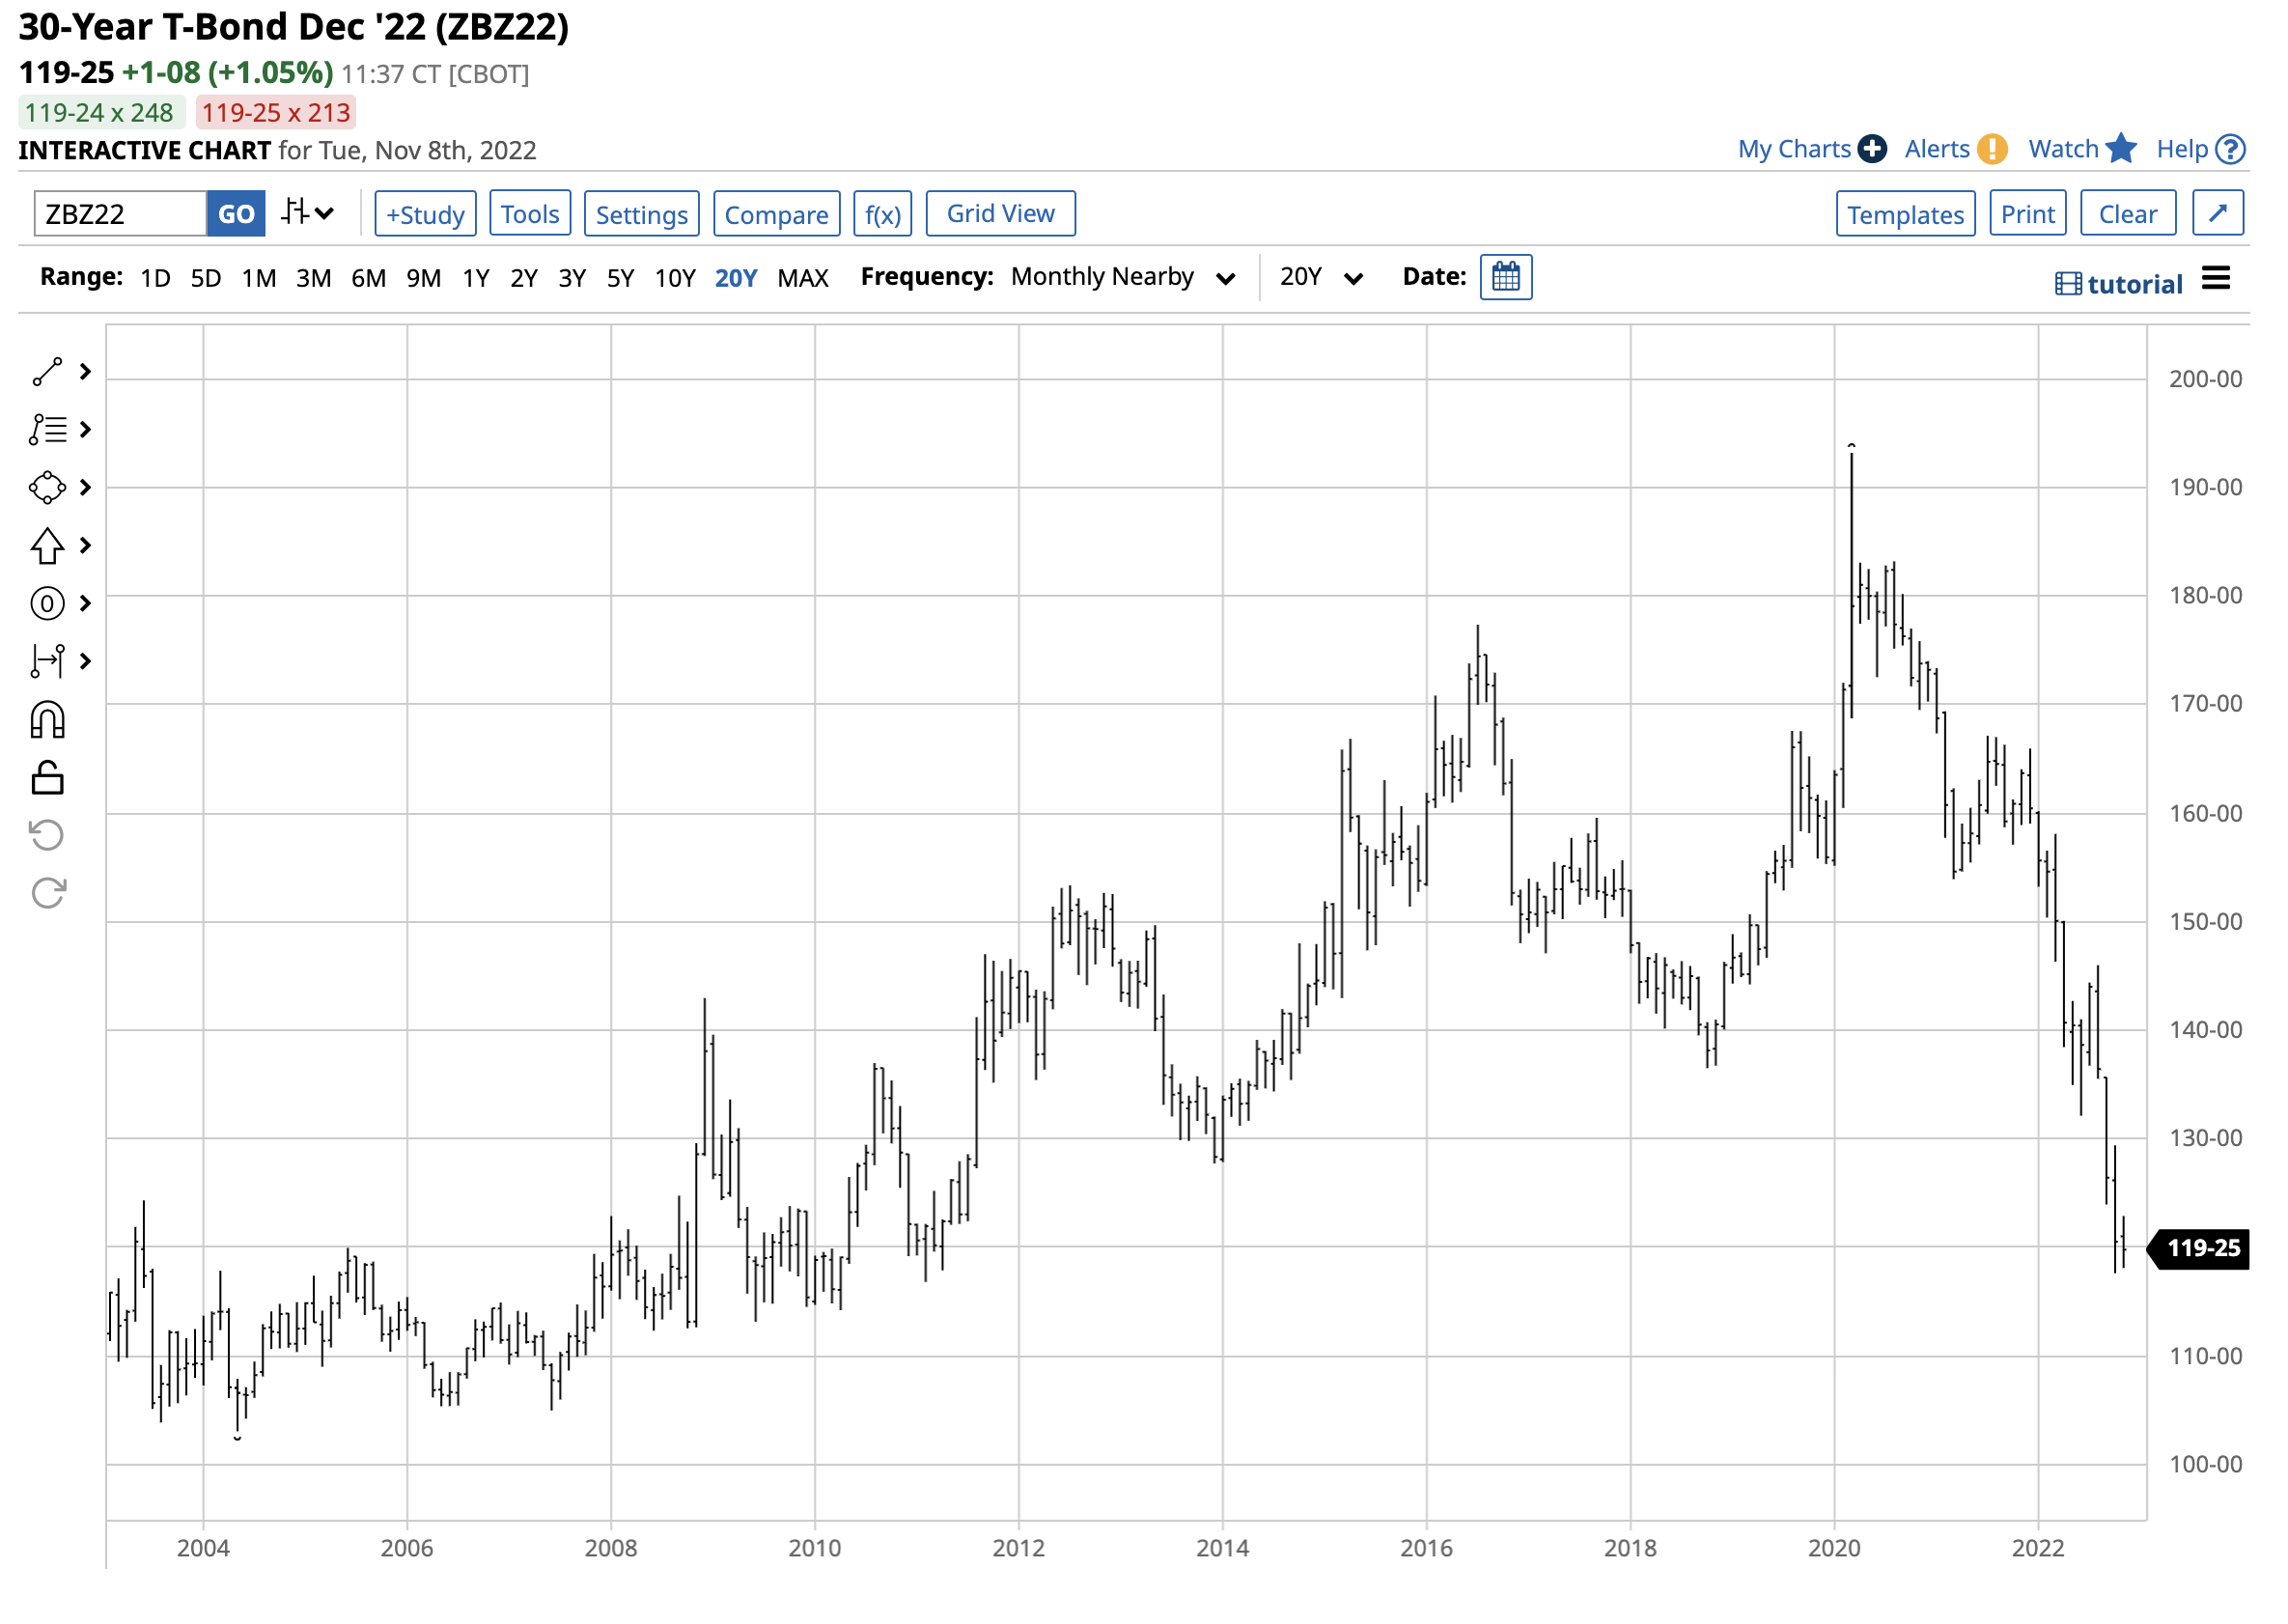
The long-term chart of the US 30-Year Treasury bond futures shows that the long bond fell to a 117-19 low in October, a level not seen since February 2011. Falling bonds and rising interest rates support the US dollar.
Chart of the US Dollar Index (Barchart)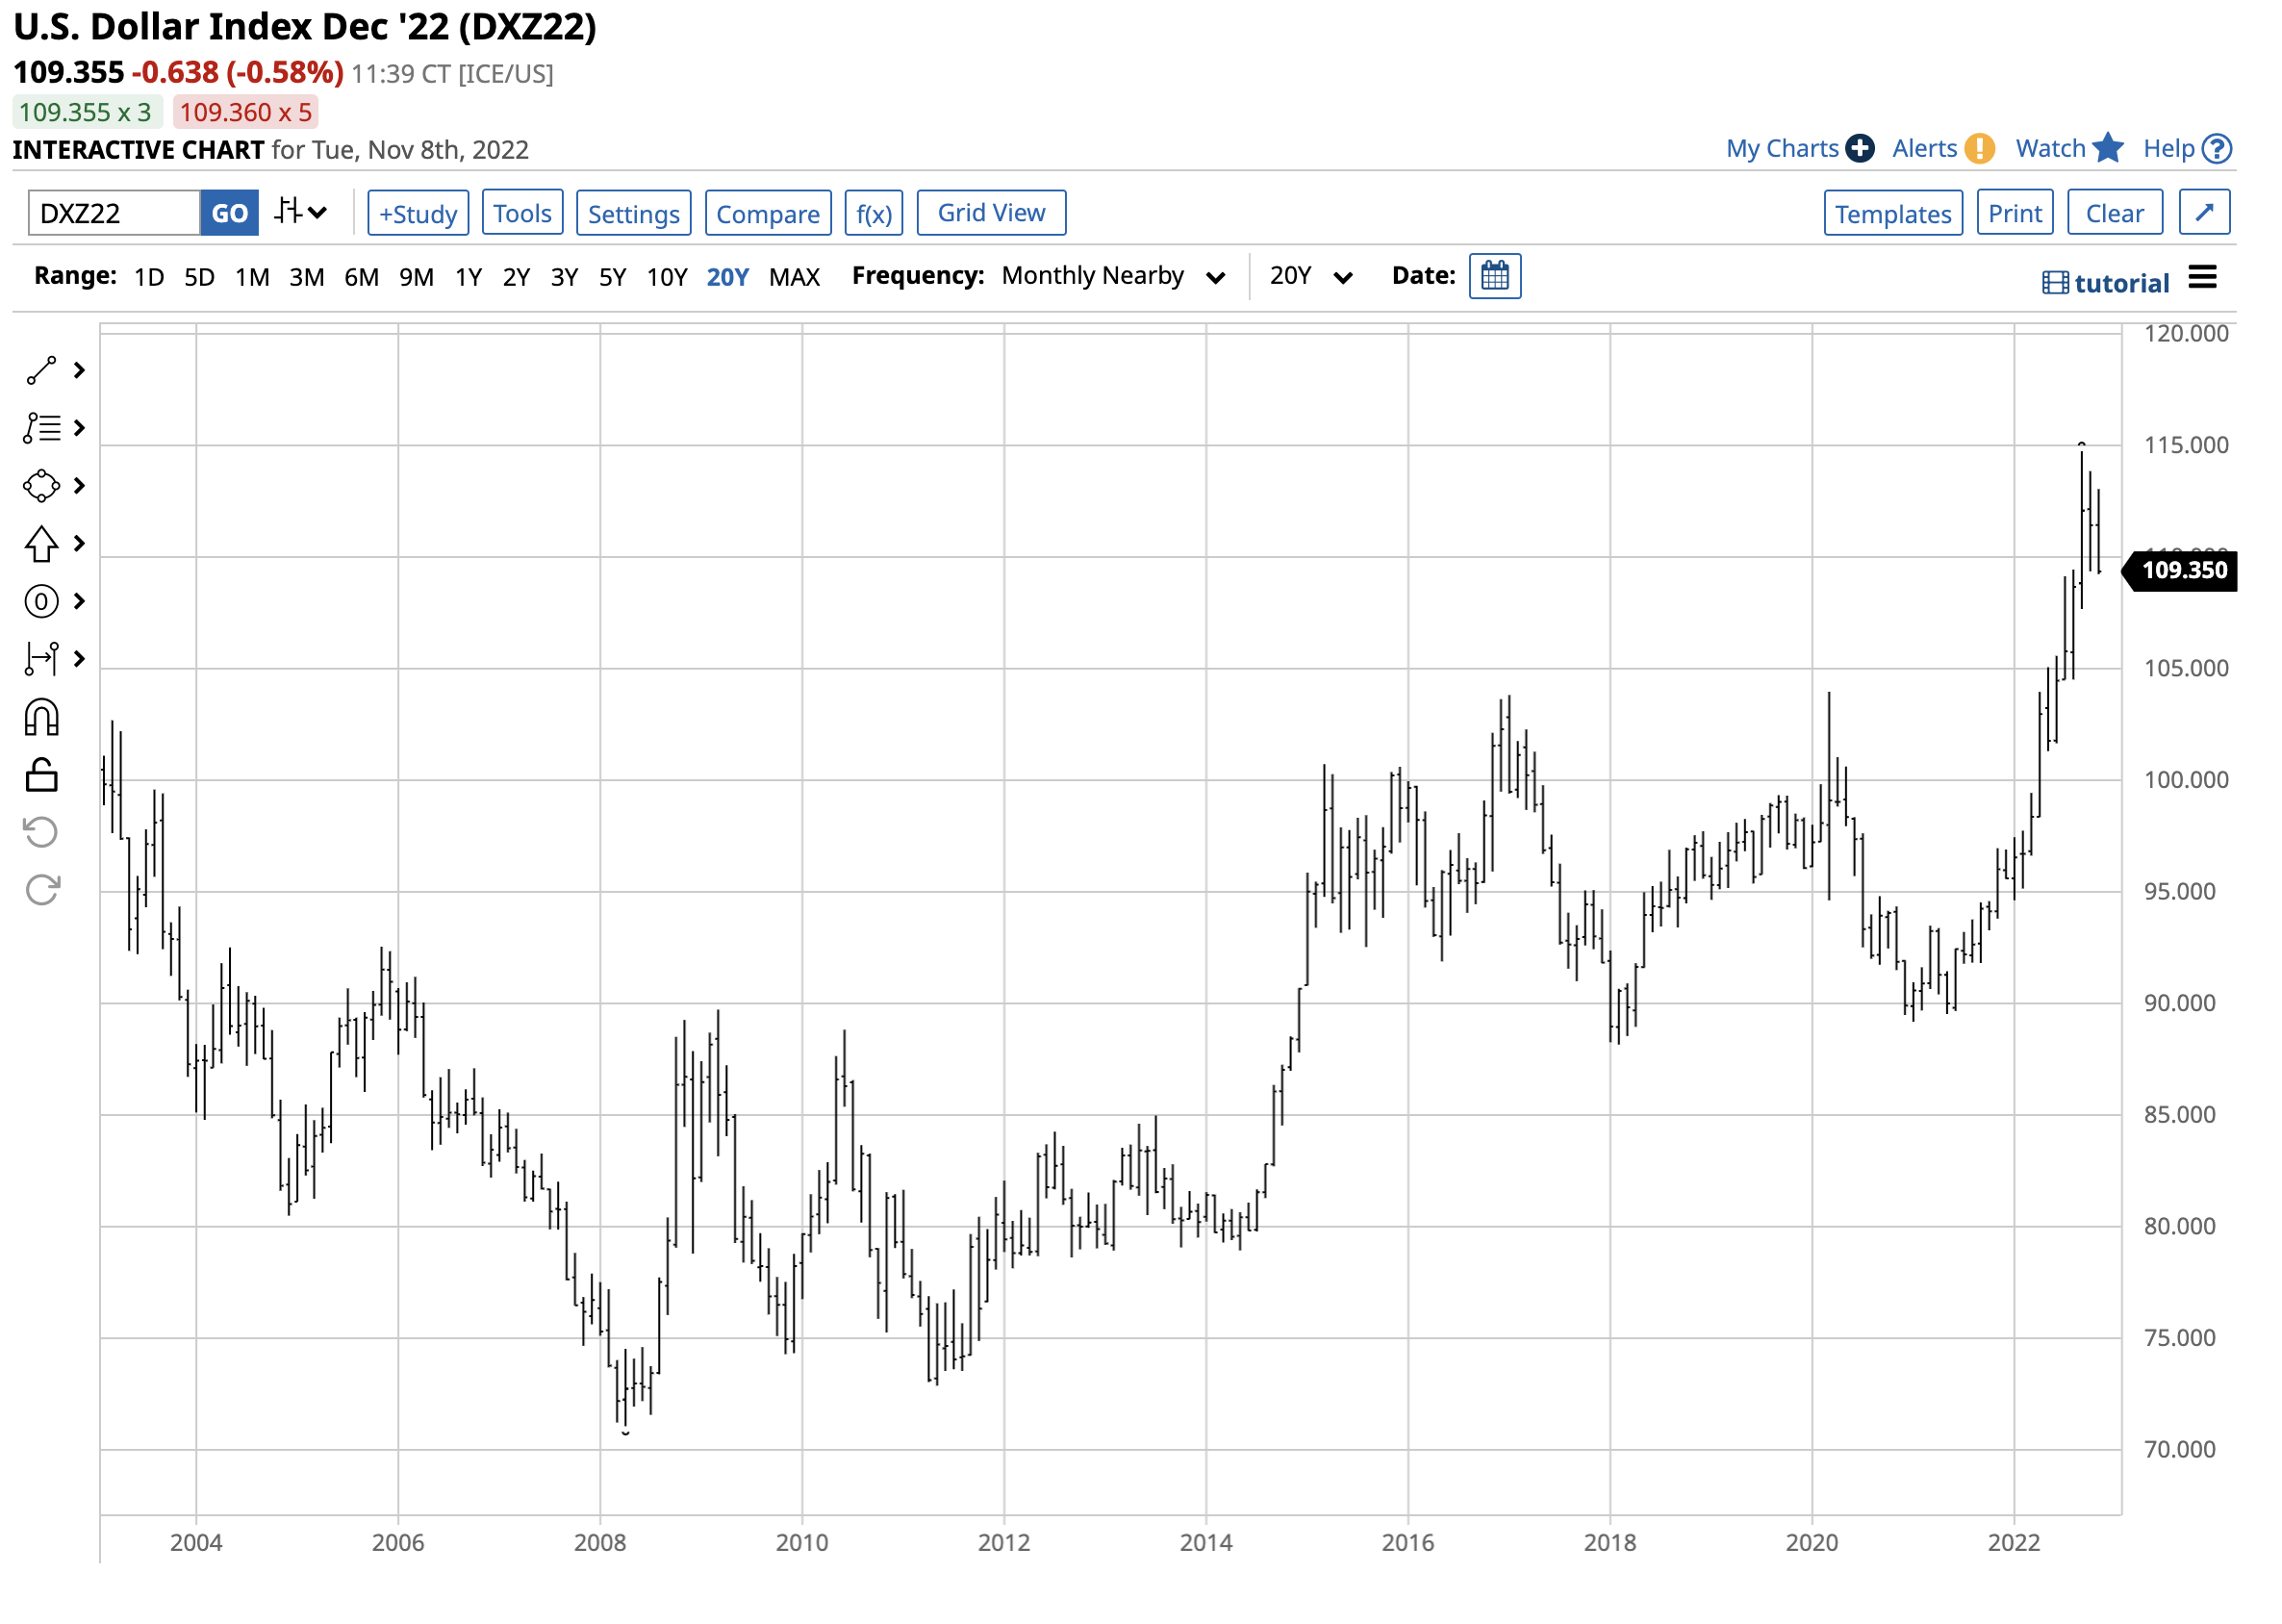
The chart shows the US dollar index, which measures the US dollar against the euro, pound, yen, Canadian dollar, Swedish krona, and Swiss franc, rose to the highest level in two decades. After moving to 114.745 in September 2022, the index was around the 109 level on Nov. 8, still the highest level since 2002.
The dollar is the world’s reserve currency and the benchmark pricing mechanism for gold and other commodities. A strong dollar, like rising rates, tends to weigh on gold’s price. Gold has experienced a double-barrel bearish blow since reaching a record high of $2,072 per ounce in March 2022. The precious metal corrected 21.9% at the latest November 3 $1,618.30 low. The continuous COMEX futures contract fell to $1,615.10 per ounce on Nov. 2. Gold looked like toast on Nov. 2 and 3, but the price held and has not done poorly considering the two-decade high in the dollar and the eleven-year low in the long bond futures.
The selling stopped at the right level
The first sign gold remains strong is technical, and the second is historical.
Chart of COMEX Gold Futures (Barchart)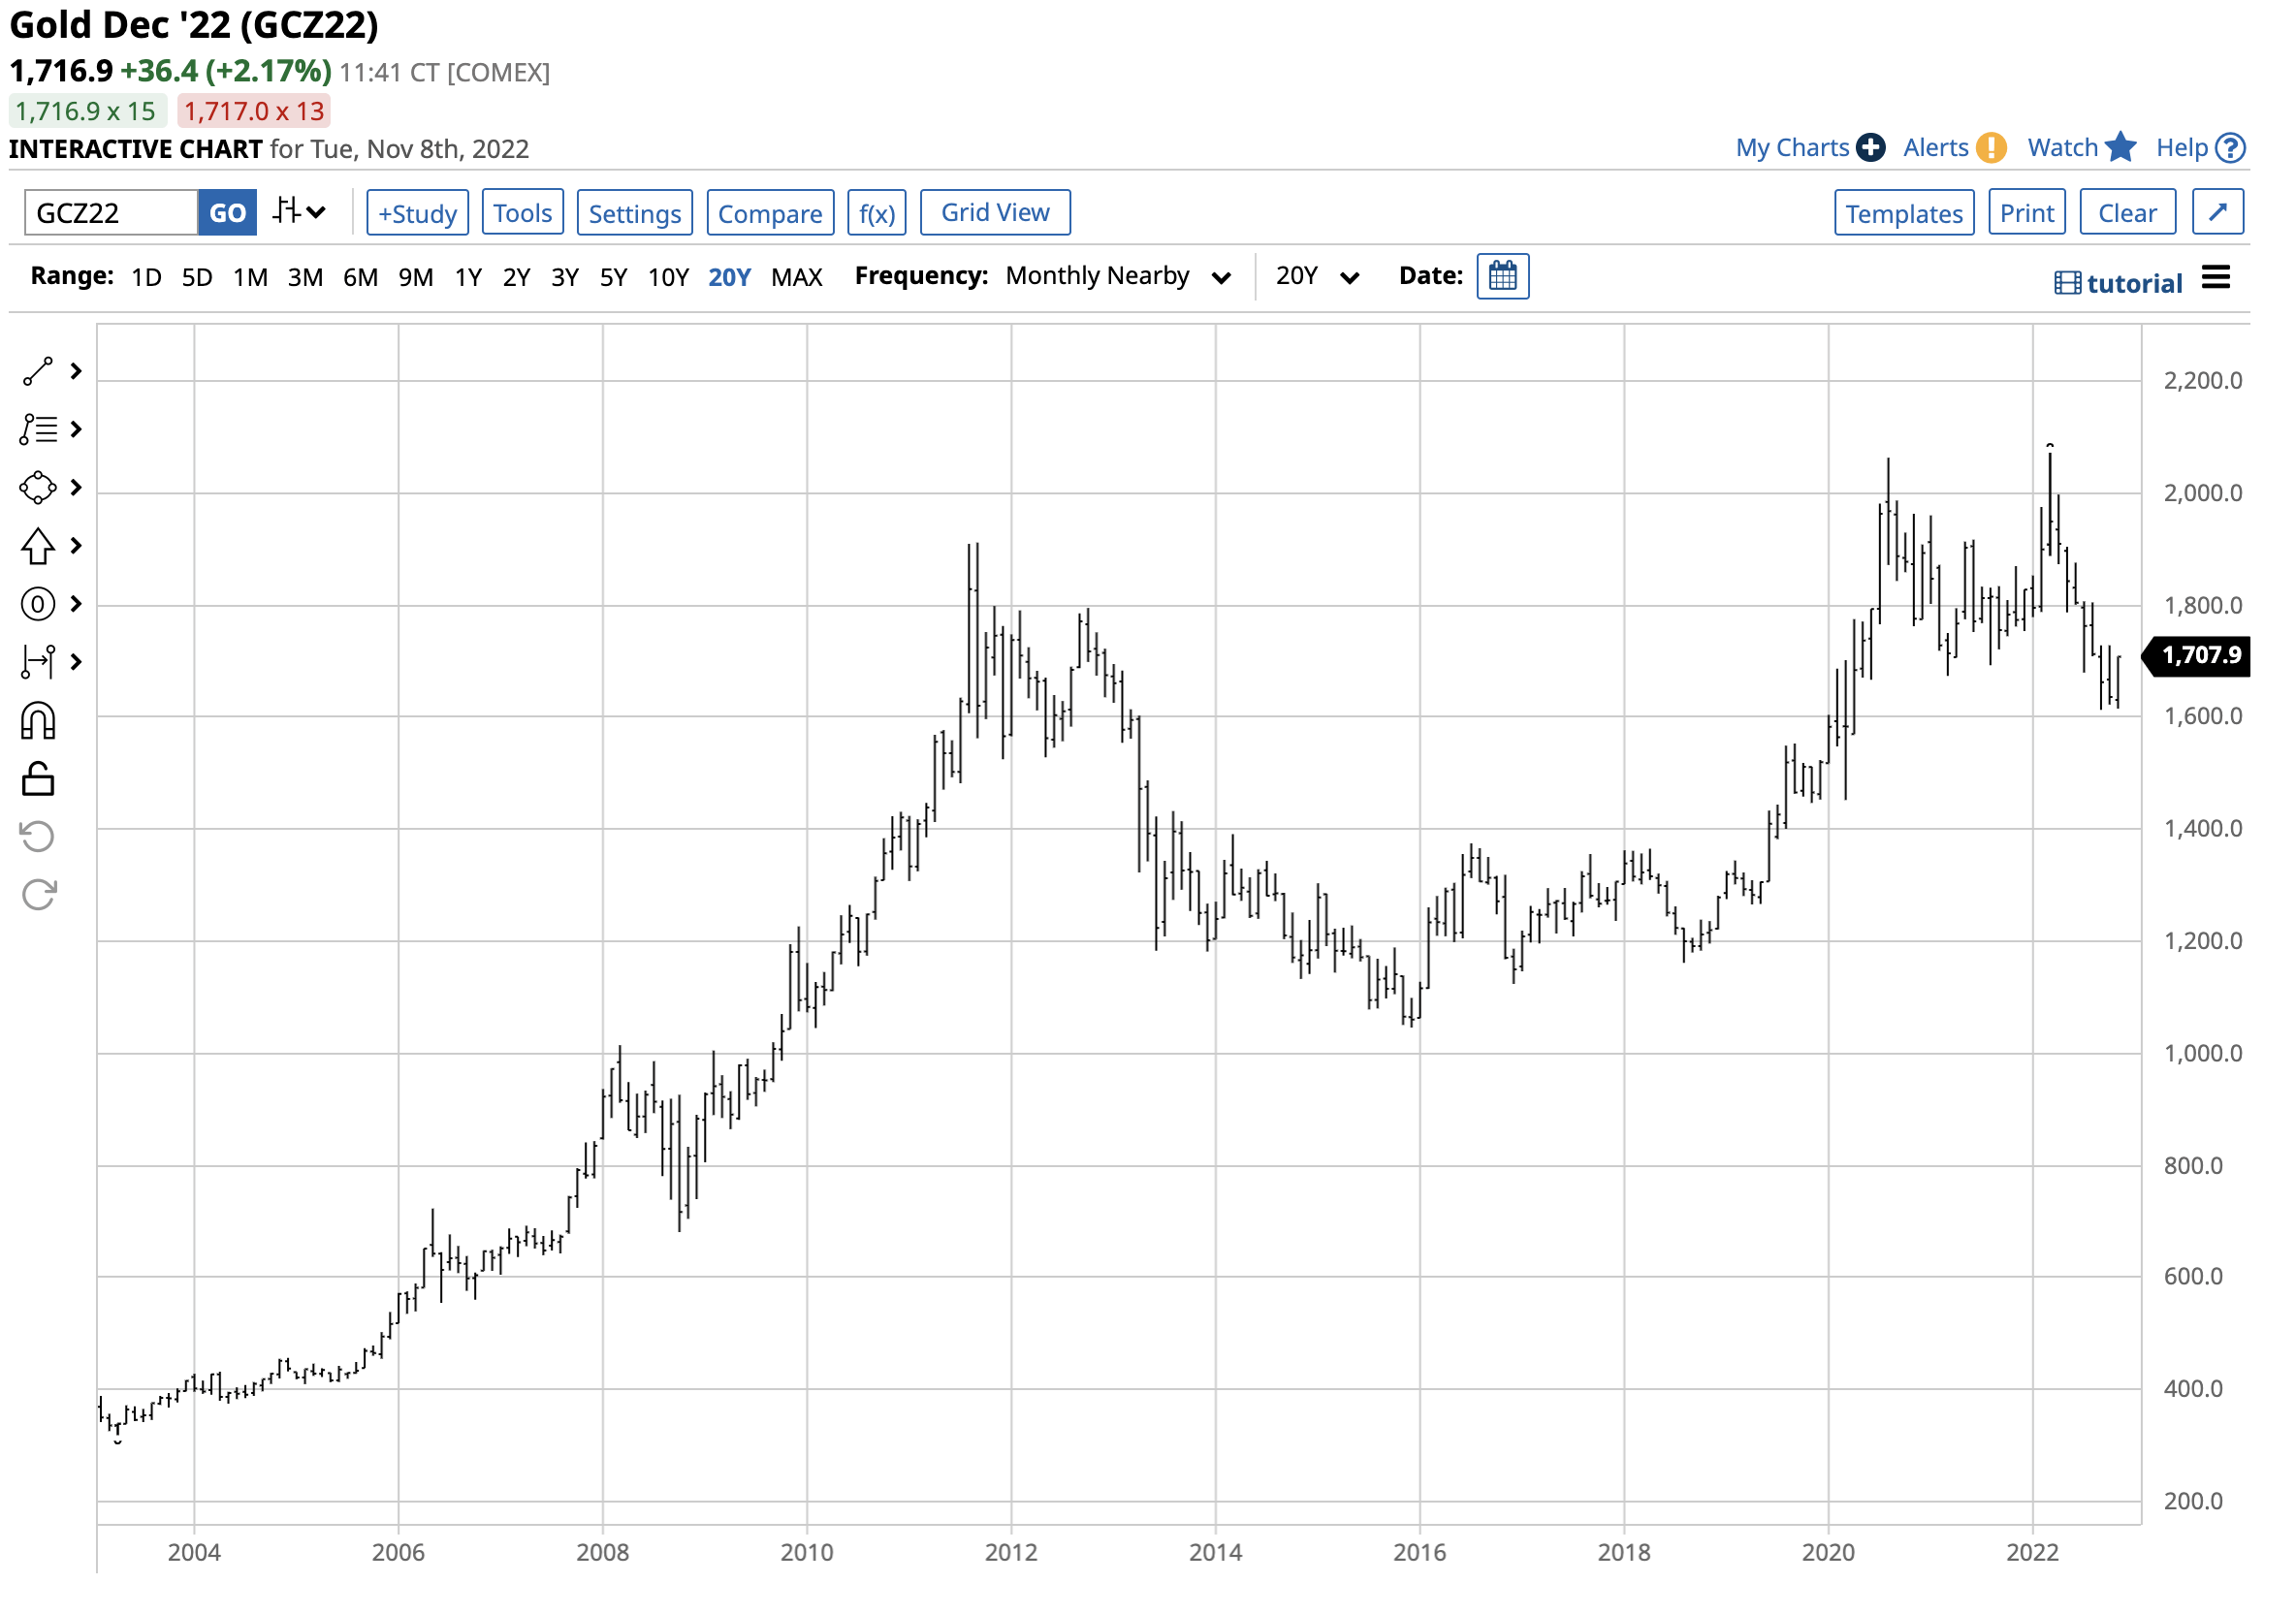
The chart highlights the continuous gold futures contract stopped short of a test of the September 2022 critical technical support level at $1613, falling to $1615.10 before turning higher.
Moreover, gold remained a lot higher than the last time the dollar index was at the current level in 2022 or the bonds fell to the recent low, the lowest level since 2011. In 2002, gold’s high was $350.70, and in February 2011 when the long bond reached 116-28, gold’s high was $1,417.70 per ounce. The gold selling stopped at the correct technical level that supports the over two-decade pattern of higher lows and higher highs. The price action in the face of the dollar and bond market is a sign of underlying strength in the gold market.
December COMEX gold futures recovered and were at the $1,717 per ounce level on Tuesday, Nov. 8.
A compelling case for gold
The following factors present a compelling bullish case for gold:
- Central bank buying – The World Gold Council reported that the central banks purchased nearly 400 metric tons in Q3, a record for official sector purchases. Turkey, Uzbekistan, and Qatar were among the most significant buyers. Central bank buying continues to validate gold’s role in the global financial system. Governments hold the metal as an integral part of foreign currency reserves.
- Chinese and Russian accumulation – In China and Russia, gold holdings are a state secret and a matter of national security. China is the world’s leading gold-producing country, and Russia is third in annual output. In 2022, China will produce 370 metric tons, with Russian production at the 300-ton level. Over the past years, China and Russia have not sold all that much gold on the international market, leading analysts to believe the countries are vacuuming domestic output to increase their reserves. That trend likely continued in Q3 2022, making official sector purchases much higher than the World Gold Counsel’s 400-ton level.
- Russian backing the ruble with gold – As the US, NATO countries, and worldwide allies sanctioned Russia because of its aggressive invasion of Ukraine, Russia responded by backing its currency with gold. The Russian central bank announced that 5,000 rubles are exchangeable for one gram of gold. The US dollar index at the 110 level is 15% higher since the end of 2021. Meanwhile, the Russian ruble vs. the US dollar currency relationship has risen by over 22% since December 31, 2021. The ruble’s rise is likely because of Russia’s move to back its currency with gold. The “no-limits” alliance with China could eventually lead Beijing to follow Moscow, backing the yuan with gold. A gold standard in China would lift gold’s already high profile in the worldwide financial system.
- Supply-side inflation – The US Fed and other western central banks are combating multi-decade-high inflation levels by increasing interest rates and other monetary policy tools. Meanwhile, the war in Ukraine, sanctions on Russia, and Russian retaliation have lifted food and energy prices. Supply concerns are above the US central bank’s pay grade as monetary policy tools influence the economy’s demand side. While the Fed is committed to battling inflation, supply-side issues make the fight challenging. The highest worldwide inflation level since the 1980s is bullish for gold.
- The mirage in fiat currencies – While the US dollar index is at its highest level since 2002, fiat currency values as an asset class have declined. The highest US CPI and PPI levels since the 1980s signify the economic conditions weighing on the US dollar’s purchasing power. While the dollar index has appreciated by over 15% in 2022, the rise is a mirage because the index only measures the US currency against other world reserve currencies, including the euro, pound, yen, Canadian dollar, Swedish Krona, and Swiss franc. Inflation is eroding all fiat currency values, including the US dollar, as they depend on the declining faith and credit of the governments that issue the legal tender. Gold is the oldest world currency. While central banks can increase and contract the money supply to their heart’s content, the only way to increase the gold stock is to extract more from the earth’s crust. As fiat currencies lose value, gold gains value.
- Geopolitical turmoil – While the most significant event of 2020 and 2021 was the global pandemic that blind-sighted governments and people worldwide. In 2022, the early February “no-limits” alliance between Beijing and Moscow that came right before Russia’s invasion of Ukraine was a surprise that raised the global geopolitical temperature to the highest level since WW II. While Russia believes Ukraine is a breakaway territory in Western Russia, the US, NATO countries, and their allies believe Ukraine is a sovereign country in Eastern Europe. Moreover, Russian objections to NATO expansion in Eastern Europe set the stage for the first major European War since the 1940s. Meanwhile, China has made no secret of its plans to reunify with Taiwan despite Taiwan’s insistence on independence and US and European support for the island nation. At the same time, North Korea’s nuclear program is progressing, with daily missile tests threatening South Korea, Japan, and the US. Iran, another Russian and Chinese ally, has been supplying drones to Russia in its war against Ukraine, and its nuclear weapons program continues. The bottom line is the world has become far more dangerous in 2022, and gold tends to thrive when geopolitical tensions rise.
- The trend is always your best friend – The Bank of England auctioned off one-half of the UK gold reserves in 1999 through 2002, and gold reached a $252.50 low on the nearby COMEX gold futures contract. Since then, every dip in gold has been a buying opportunity leading to a new nominal record peak in the precious metal. The latest new high at $2,072 was in March 2022. The trend is always your best friend in markets, and in gold, the long-term path of least resistance remains higher despite the recent correction.
Gold has been a means of exchange for thousands of years, with more than a few biblical references in the Old Testament. Gold is mentioned 417 times, while silver has 320 references, and money is only mentioned 140 times.
Gold mining shares are the place to be if gold is going to surge; risk-reward favors the upside
Gold mining companies invest significant capital in extracting and producing the precious metal. Therefore, they tend to provide leverage to the gold price, outperforming the metal during rallies and underperforming during corrections. In a cynical commentary about the gold mining business, iconic US writer and humorist Samuel Clemens, aka Mark Twain, once said, “A gold mine is a hole in the ground owned by a liar.” Twain unsuccessfully prospected for gold during the US gold rush in the 1860s.
Gold mining has come a long way since Twain’s days panning for the metal. Today, the leading senior and gold mining companies’ fate depends on the gold price and provides investors with leverage. The top diversified senior gold mining index is the VanEck Vectors Gold Miners ETF (GDX), which holds over 23% of its assets in Newmont Corporation (NEM) and Barrick Gold Corporation (GOLD) (ABX:CA), the top two publicly traded gold miners. GDX tends to outperform gold’s price on the upside and underperform when gold falls. Meanwhile, junior gold miners can provide even more leverage than senior miners.
GDXJ is the junior gold mining ETF product
The top holdings of the VanEck Vectors Junior Gold Miners ETF product include:
Top Holdings of the GDXJ Junior Gold Miners ETF Product (Seeking Alpha)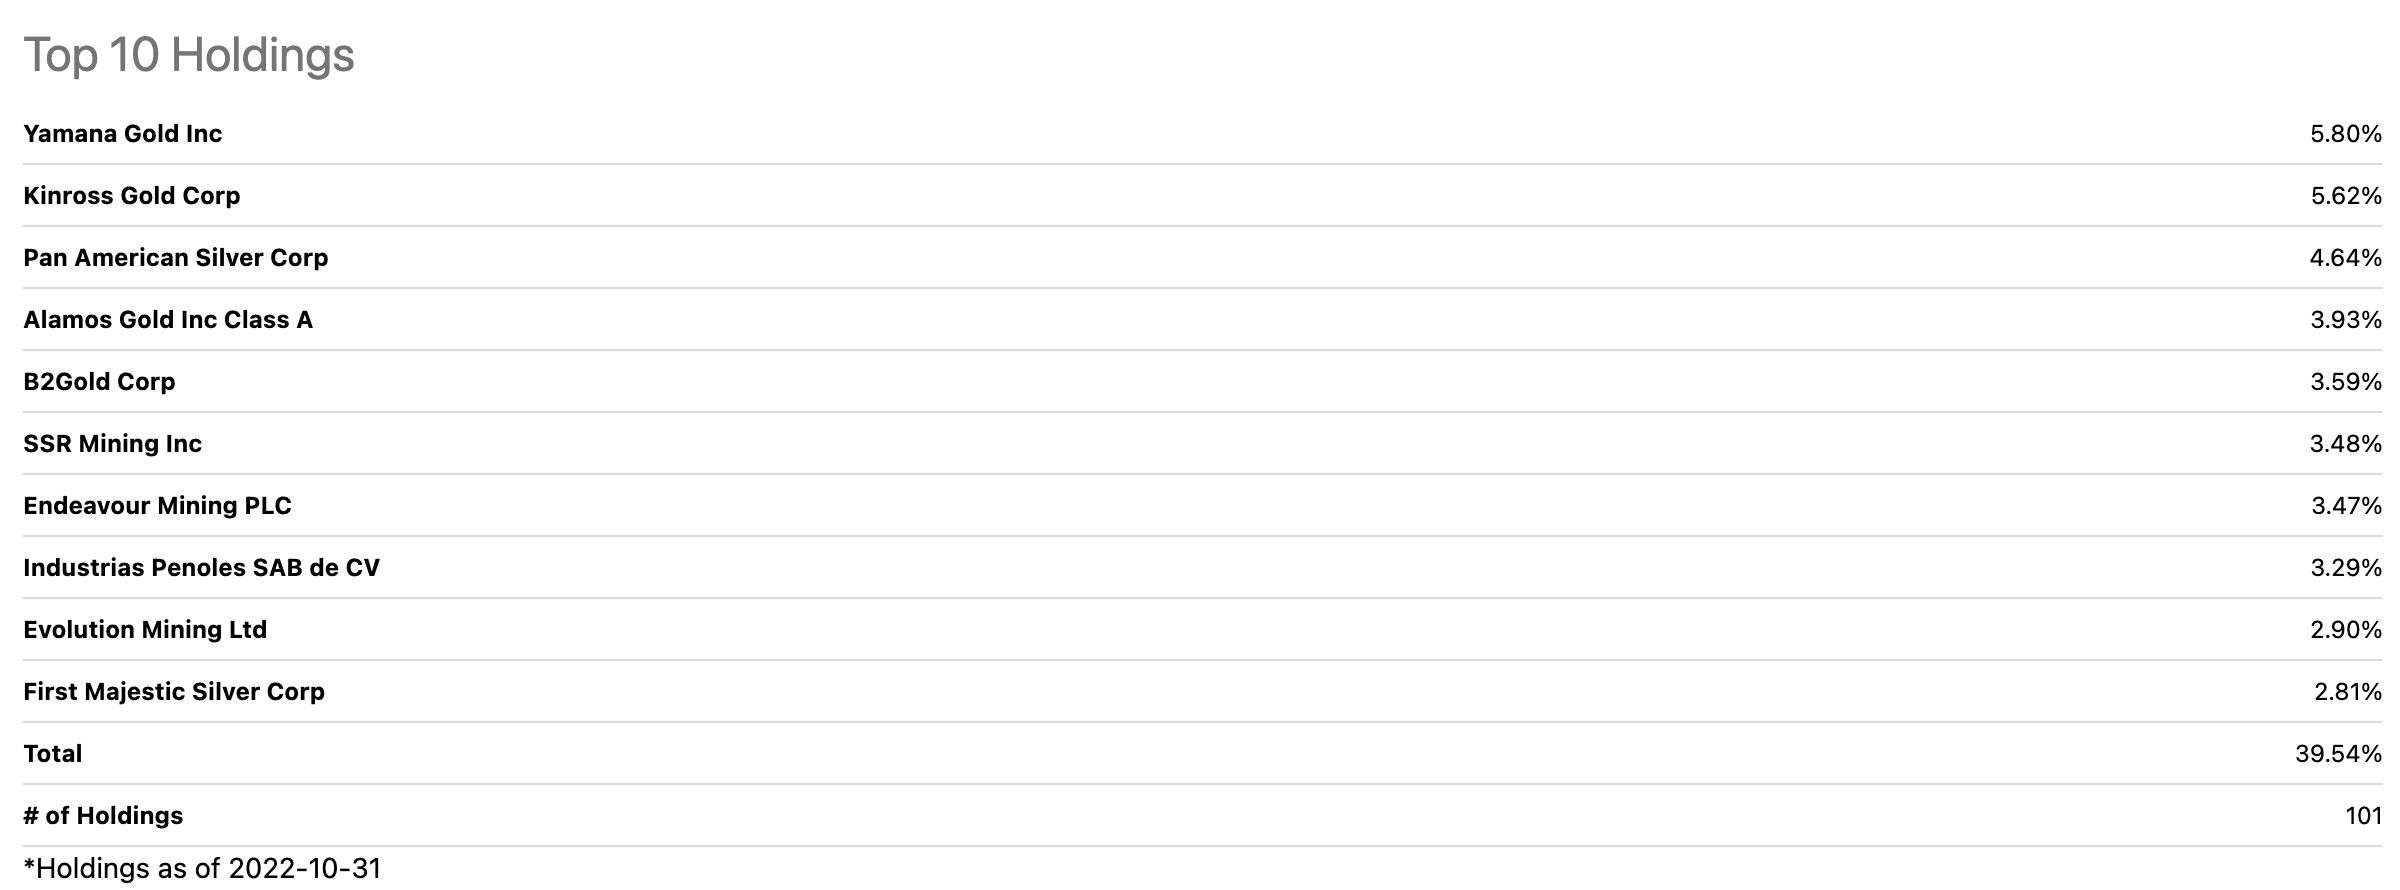
At $33.05 per share on Nov. 8, GDXJ had over $3 billion in assets under management and traded an average of over eight million shares daily. The price action from March 2020 low to the August 2020 high in gold, the GDX, and the GDXJ highlights the potential for explosive price action in the GDXJ compared to gold and the senior miners.
Gold fell to a $1,452.10 low in March 2020 before rising to $2,063 five months later in August 2020, a 42.1 % rise. Over the same period, GDX moved from $16.18 to $45.78 per share, or 182.9%.
Chart of the GDXJ Junior Gold Mining ETF Product (Barchart)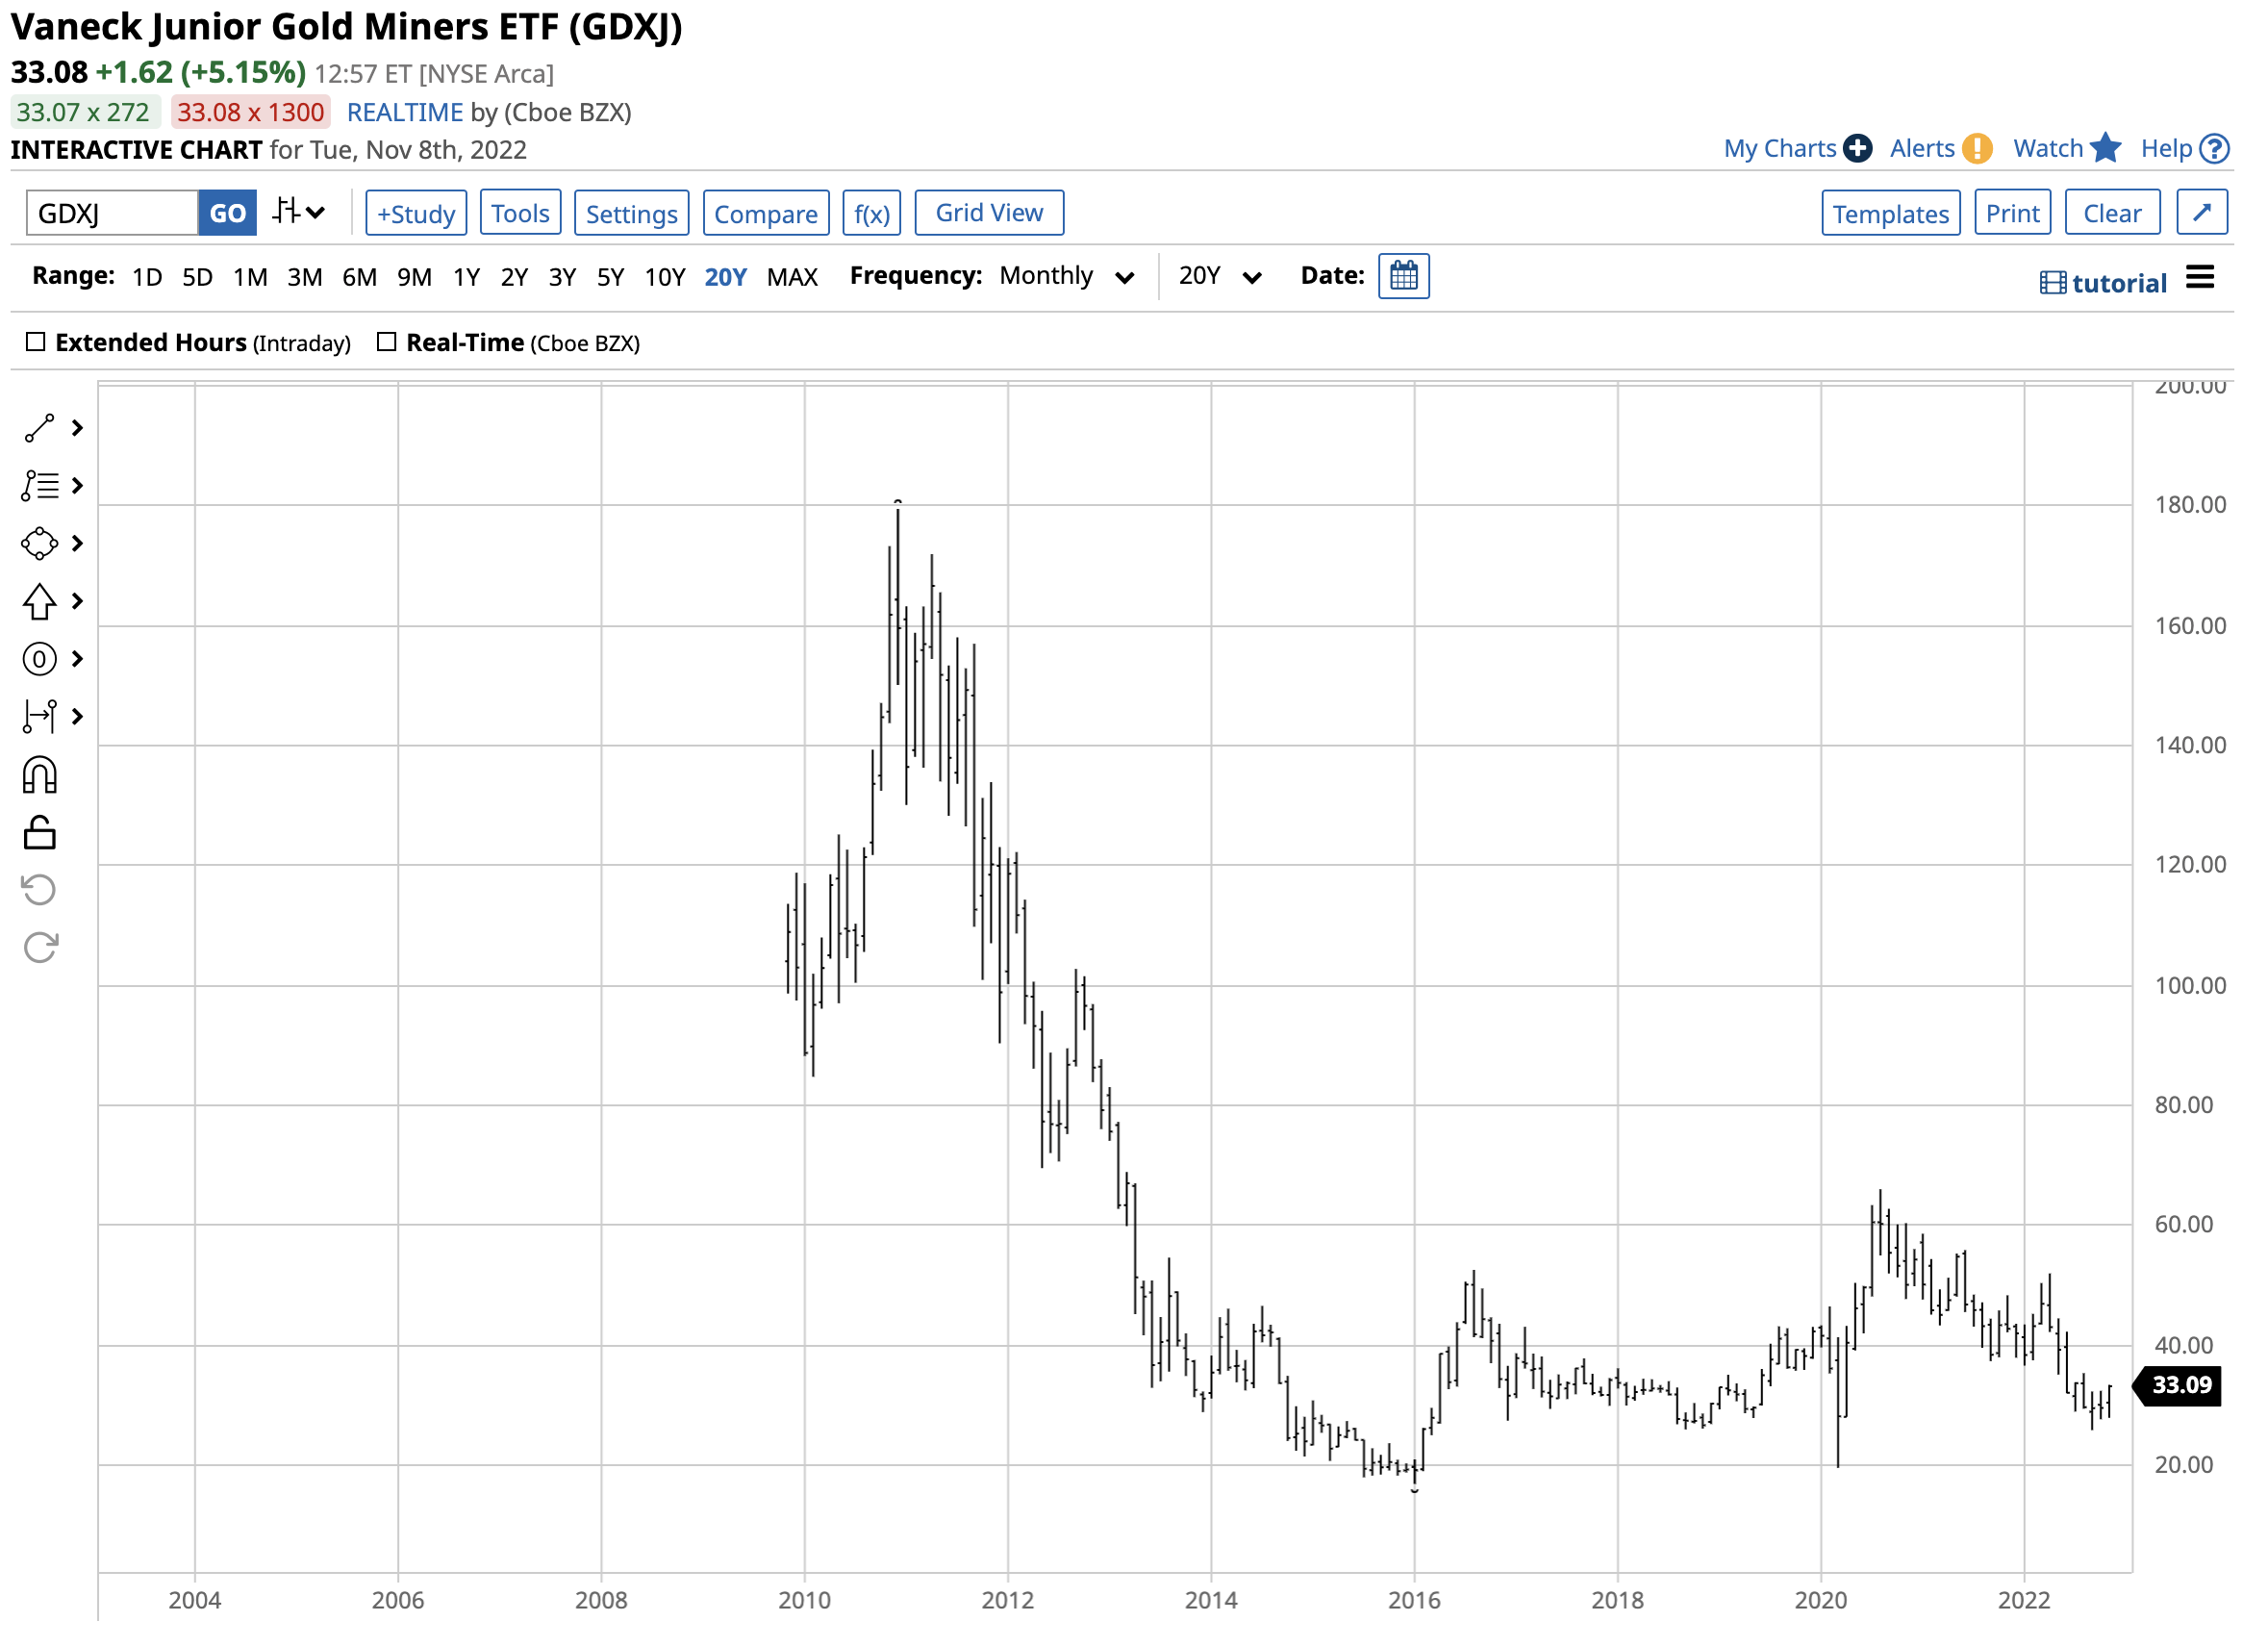
The chart shows the highly leveraged GDXJ ETF moved from $19.52 to $65.95 per share or 237.9% when gold rose 42.1%, and GDX moved 182.9% higher.
The latest rally took December COMX gold futures from $1,618.30 on Nov. 3 to $1,720.40 on Nov. 8, a 6.3% rise. Over the same period, GDX moved from $22.58 to $26.95 per share, or 19.4%. Meanwhile, GDXJ rallied from $27.85 to $33.34 per share, or 19.7%.
GDXJ is a product that tends to fall more than gold and the GDX ETF during price corrections. However, when gold and mining shares take off on the upside, the junior gold mining ETF can kick into high gear and outperform the metal and senior mining companies. While GDX and GDXJ provide leverage, they do not suffer from the time decay that other leveraged products often experience. The leverage comes from the underlying business, not from options and financial derivatives that artificially create the gearing.
Mark Twain may have said the underlying business is full of liars, but gold mining has come a long way since the 1860s. Gold’s case for a continuation of higher highs is compelling, which favors higher prices for the GDX and GDXJ products at their current price levels.
Be the first to comment