

USD/CAD Analysis
- Plenty of CAD data amidst a holiday-filled week
- USD/CAD on the move with volatility likely to pick up
- Mixed IG client sentiment as recent longs muddy the outlook
Plenty of CAD Data Amidst a Holiday-Filled Week
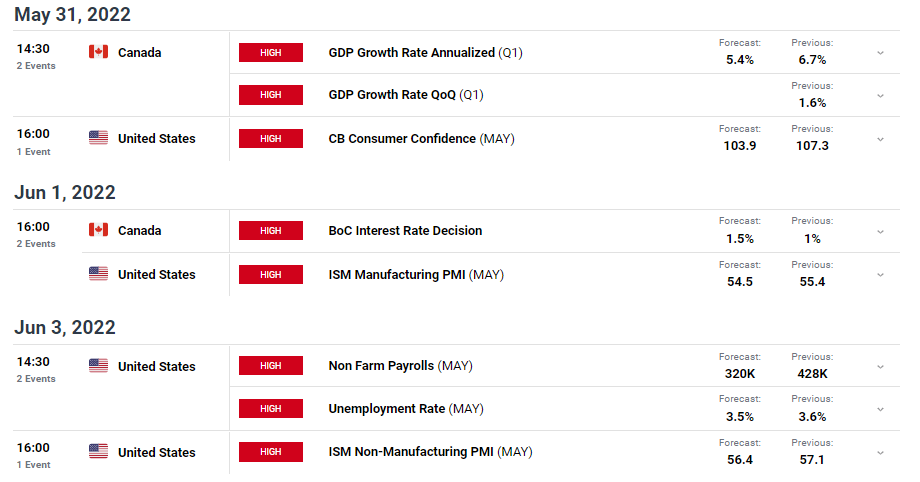
The Canadian dollar volatility is likely to rise this week due to GDP data and the Bank of Canada (BoC) interest rate decision. On top of that, US cash markets are offline on Monday for Memorial Day and the UK enters into its long weekend from the Thursday Spring Bank Holiday followed by the Queen’s Platinum Jubilee celebrations on Friday to the end of the weekend. While the UK isn’t particularly influential in USD/CAD movement, the anticipated lack of liquidity from one of the world’s major financial hubs is something to keep in mind.
The week comes to an end with US non-farm payroll data where more jobs are expected to have been added for May, adding to an extremely tight job market. Lastly, services PMI data (May) from the Institute of Supply Management is due on Friday. The services sector is the largest sector on the US economy and will be monitored closely for signs of deteriorating economic conditions after US retailers Walmart and Target issued a warning about the worsening state of the consumer and lower demand forecasted for Q2 2022.
Customize and filter live economic data via our DaliyFX economic calendar
BoC Expected to Hike by 50 Basis Points
Rates markets anticipate a 50 basis point hike on Wednesday as the BoC ramps up its efforts to calm rampant inflation. Markets have placed the Bank on a similar path of rate hikes to the Fed with the latter anticipated to produce 180 bps worth of rate hikes into year end, while the BoC is currently expected to add a further 169. Such elevated market expectations are likely to keep CAD bid along with the recent rising oil prices.
Implied Probabilities of BoC Rate Hikes via Money Markets
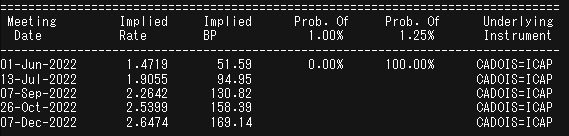
Source: TradingView, prepared by Richard Snow
Taking a look at the daily USD/CAD chart, there has been a very strong bearish move since the notable bullish rejection on May the 13th. More recently, we witnessed a failed attempt to trade above 1.2895 which translated into a long upper wick – signaling a propensity for a move lower.
This morning USD/CAD breached the long-term ascending trendline from 2017 as well as the 50 simple moving average. Not far from here we see potential levels of support via the 200 DMA (red line) followed by the 23.6% Fib level at 1.2645. The RSI is yet to reach oversold levels meaning that USD/CAD still has some room to run (to the downside) before pulling back.
Should we see a return to strength in the US dollar, levels of resistance appear in the form of the long-term trendline, followed by the level capping previous gains at 1.2788 and finally, the 1.2895 level.
USD/CAD Daily Chart
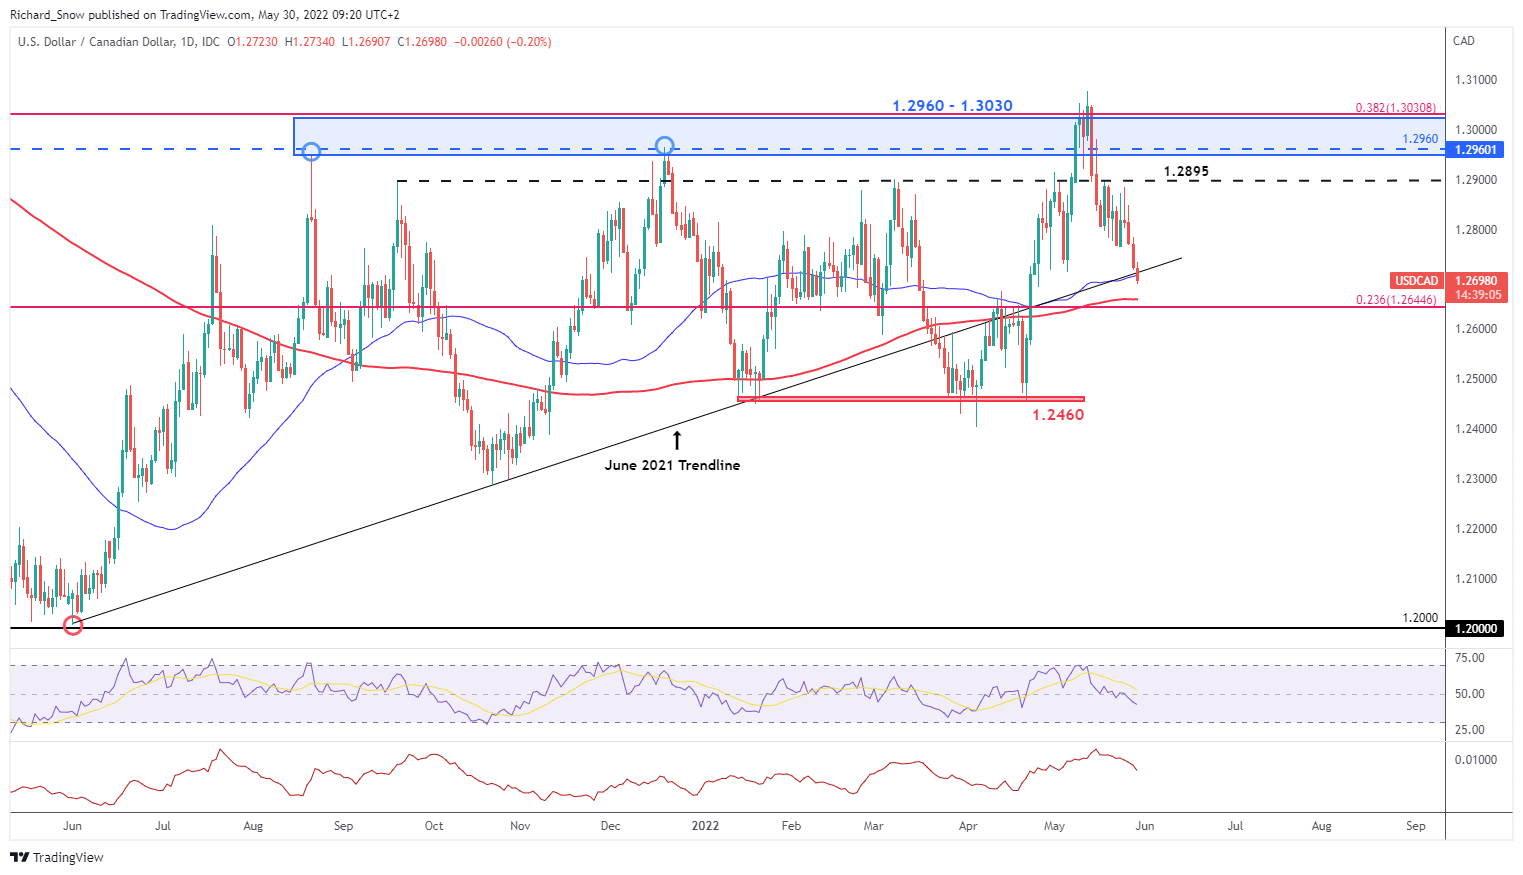
Source: TradingView, prepared by Richard Snow
USD/CAD IG Client Sentiment
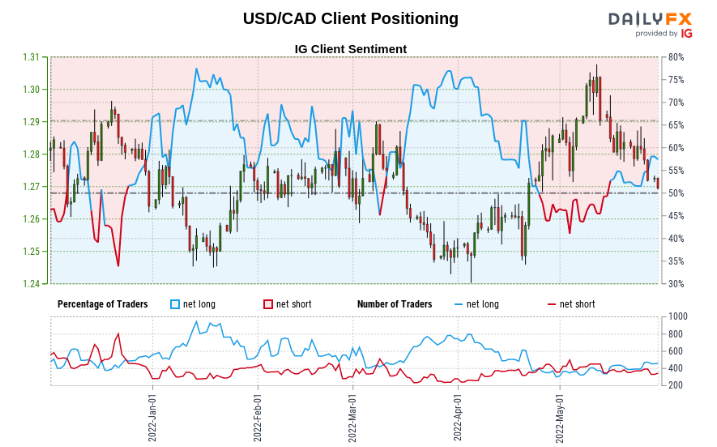
- USD/CAD: Retail trader data shows 56.06% of traders are net-long with the ratio of traders long to short at 1.28 to 1.
- We typically take a contrarian view to crowd sentiment, and the fact traders are net-long suggests USD/CAD prices may continue to fall.
- The number of traders net-long is 2.56% higher than yesterday and 21.46% higher from last week, while the number of traders net-short is 10.23% higher than yesterday and 1.82% lower from last week.
- Positioning is less net-long than yesterday but more net-long from last week. The combination of current sentiment and recent changes gives us a further mixed USD/CAD trading bias.
— Written by Richard Snow for DailyFX.com
Contact and follow Richard on Twitter: @RichardSnowFX
Be the first to comment