

vasabii
Written by Nick Ackerman, co-produced by Stanford Chemist. This article was originally published to members of the CEF/ETF Income Laboratory on July 2nd, 2022.
These are two funds that I’ve highlighted in the past. There was an opportunity to switch then based on valuation. That is from The Gabelli Convertible & Income Securities Fund (NYSE:GCV) to its sister, Ellsworth Fund (NYSE:ECF). This is worth revisiting and highlighting the opportunity again as the divergence in valuations becomes even more egregious.
Even Bancroft Fund (BCV) is an alternative to GCV, but I’m just sticking to highlighting one choice for simplicity’s sake.
These funds are managed by the same managers under the Gabelli umbrella. They are both primarily convertible funds but also mix in some exposure to fixed-income and equities.
Performance Comparison
Since last covering the funds and highlighting the opportunity in an article posted publicly on February 10th, 2022, here is a look at the performance divergence.
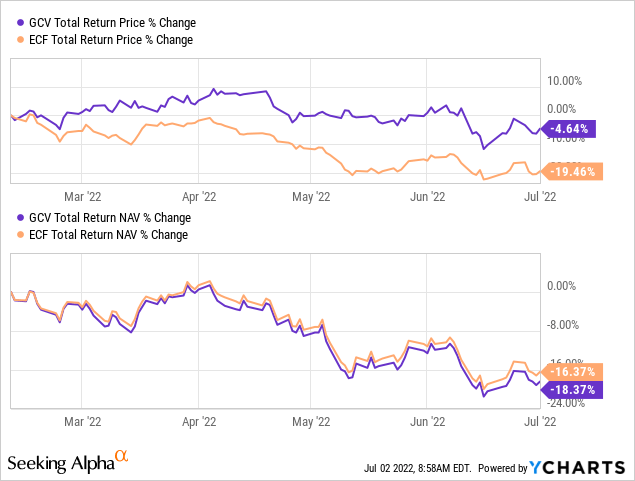
YCharts
We can see that GCV has held up much better on a total share price return basis. However, the drop was slightly worse on a total NAV return basis. That means the underlying portfolio of GCV had underperformed, but the actual price that investors are paying pushed the share price to outperform.
Here is a look at the YTD performance. We see a similar trend.
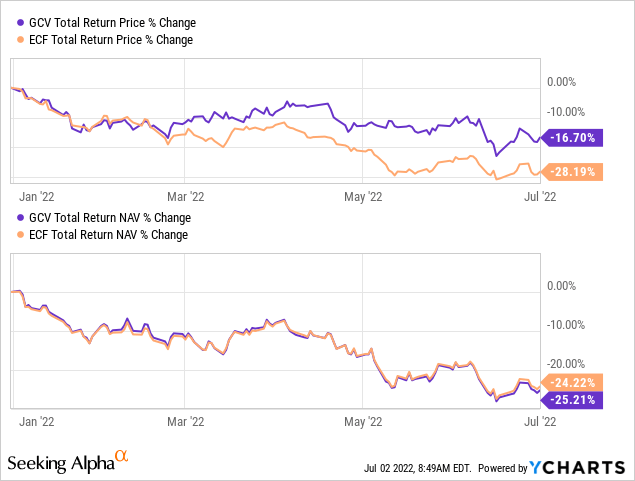
YCharts
All this means is that the GCV premium has expanded even further. The ECF discount has expanded further to the downside, and the divergence between the fund’s valuations grows.
This isn’t the first time this has happened either. Looking at the chart below, we can see that these divergences have happened several times. In the most egregious of cases (~2015 and ~2019), we can see that it ended the same. GCV’s premium collapses and comes back down to a closer valuation to where ECF trades. Through 2021, we even saw ECF tick into premium territory while GCV remained discounted.
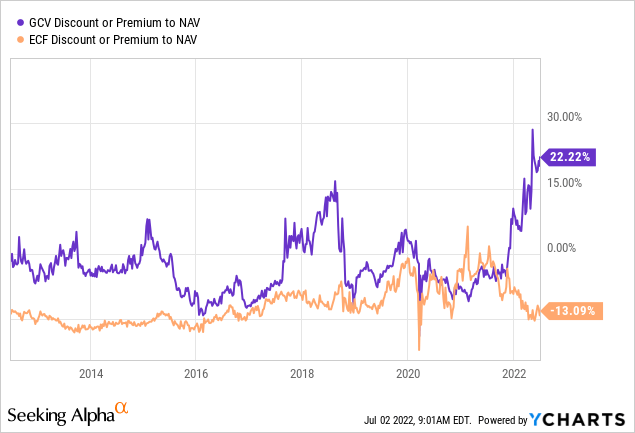
YCharts
Since that time, the roles have reversed to the extreme. If history repeats, investors are much better off swapping from GCV to ECF at this time. History suggests that one would get the opportunity to go back into GCV at a much more attractive price in the future.
Over the longer term, ECF has outperformed on both a total NAV return and a total share price return basis.
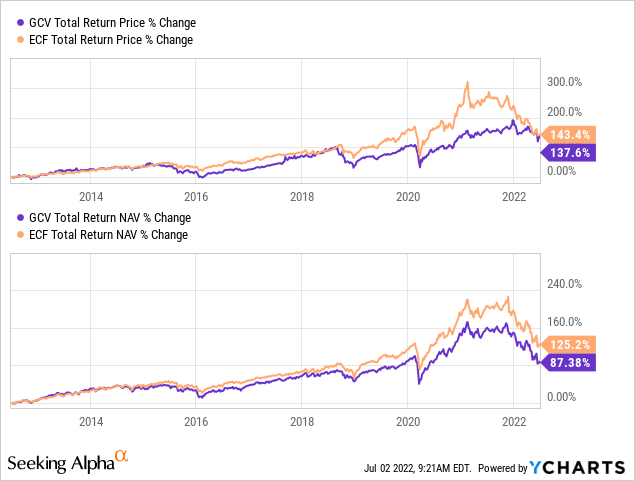
YCharts
Distribution Differences
Both funds pay regular distributions to shareholders. In the case of GCV, they pay a managed plan of a minimum 8% distribution. This comes via quarterly payouts to investors. If they are shy at the end of the year, investors would see a special to top it off.
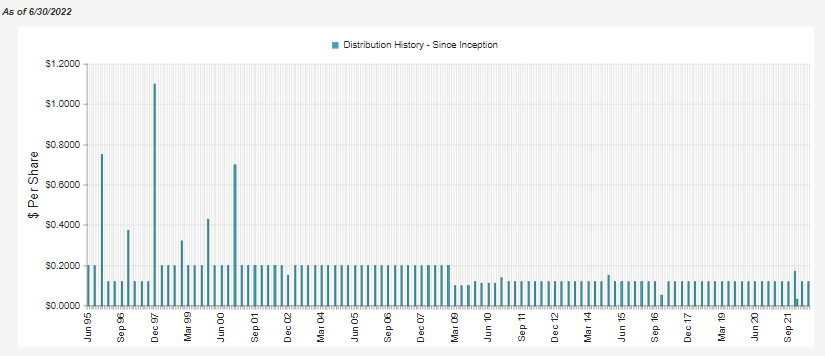
GCV Distribution History (CEFConnect)
Considering the 10.76% NAV distribution rate at this time, that isn’t likely to happen this year or anytime soon, to be quite honest. It would require quite a bit of appreciation in the underlying portfolio to get back to lowering that current payout ratio. Given the market volatility and uncertainty for the next year or so, that seems unlikely.
On the other hand, you have ECF. They take a more modest approach to their distribution at a 5% managed distribution policy. This sees them more frequently paying out annual year-end top-off special distributions.
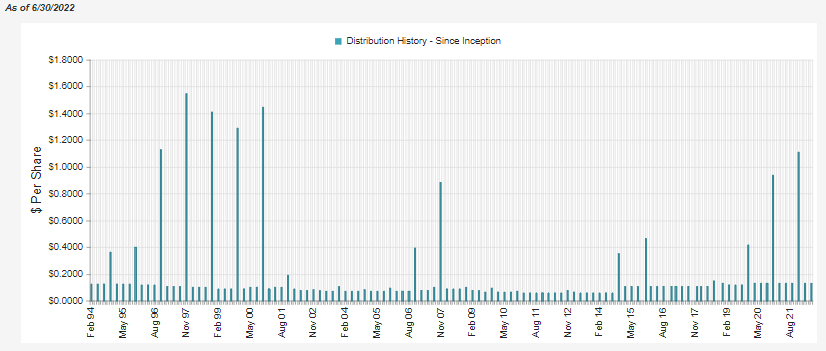
ECF Distribution History (CEFConnect)
ECF’s current NAV distribution rate comes to 5.28%. Meaning that they also won’t likely be required to pay a special this year. However, they are much closer to a level where that could change.
Over the longer run, these are just minimums, and that doesn’t mean that GCV will cut its quarterly distribution. Some plans are operated in a manner that has them regularly adjust for their percentage-based managed distribution plans. However, it sends up a red flag when the payout rate is over 10%, in my opinion.
For CEFs, they are all about paying out higher distributions to investors. So I understand the clear bias towards finding GCV more attractive with a higher distribution rate.
This is where the premium to NAV and discount to NAV valuations play a role again. Since GCV is so expensive, the actual distribution rate to investors is 8.89% right now. For ECF, it comes to 6.10%.
The absolute percentage difference between the NAV rates is 5.48 points, but the actual rate difference that investors are receiving is 2.79 points. On a relative basis, the NAV rate is 51% higher for GCV over ECF, while the share price rate that investors receive is around a 31% difference. It means that a cut in one’s pay wouldn’t be too substantial relative to the actual difference the underlying portfolios have to pay to sustain those payouts.
A Quick Look At The Portfolios
For being managed by the same managers, they actually have a different mix in their top positions.
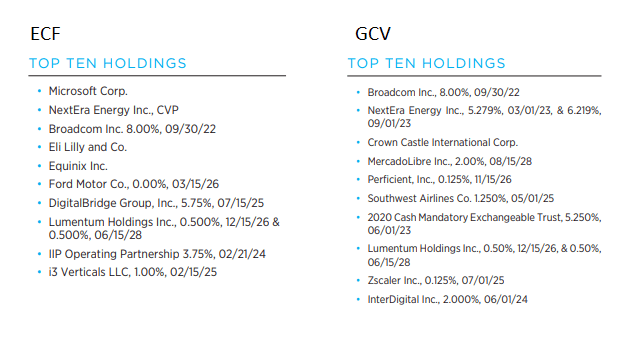
GCV Vs ECF Holdings (Gabelli)
When the same people manage funds, we tend to see more overlap in their positions. In this case, it could be argued that they are a good pair to hold together as they offer more limited overlap. That could be the case if the valuations weren’t so far apart.
Additionally, the positions might differ at the top, but the top sectors are much more similar. So somewhere under the surface level, it would seem that there could be more overlap than we see initially.
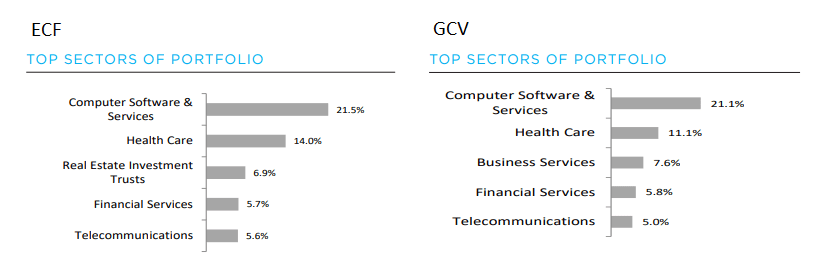
GCV Vs ECF Sectors (Gabelli)
In their most recent report, ECF had listed asset exposures as; convertible bonds 67.2%, convertible preferred 0.2%, mandatory convertible securities 10.3%, common stock 19.6% and U.S. Government obligations 2.7%. This was for the period ending March 31st, 2022.
GCV had its asset exposure listed as: convertible corporate bonds 72.2%, convertible preferred stocks 0.7%, common stocks at 7.8% and U.S. Government obligations 7.8%. That was for the period ending December 31st, 2021.
On that basis, we can see the portfolios are quite similar, with ECF favoring a slightly greater exposure to equity positions.
Risks To Consider
As we’ve seen already, the risk is that this trend continues and GCV continues just to get bid up. That has happened since highlighting GCV’s premium earlier this year until now. However, the difference between the funds has continued to expand. The potential downside is greater at this time.
Still, Gabelli funds aren’t necessarily strangers to premiums. They have the Gabelli Utility Trust, which has a 71.72% premium. Why do investors accept an 8.82% distribution yield when the fund has to earn 15.15%? No one knows except it does happen. It is quite wild. GCV could be the next fund to trade at a 70%+ premium, making this swap from GCV to ECF not play out.
A more general risk for both funds at this time is the exposure to credit risks. Below-investment-grade companies often issue convertible bonds. These companies are at greater risk of losses resulting in defaults or bankruptcy during slowing economic periods.
With lower convertible yields, they will tend to be tied much more closely with the price of the underlying stock. That can make them more volatile as there is less cushion that a higher yield could sometimes add. However, in the 2022 environment, fixed-income positions have been no source of comfort. With yields rising, the bonds already trading are losing value rapidly as they can be replaced with higher-yielding positions.
The general risk of poor-performing portfolios can have an impact on both funds. Both funds will require a fairly substantial portion of capital gains to continue to make sustainable distributions. GCV’s distribution rate is already a red flag, so sustainability here will be even more difficult. In the end, it can end up eroding the NAV away.
Finally, a risk that again is present in both funds is the smaller size of these funds. GCV has total managed assets of $118.046 million, and ECF has $166.894 million. ECF and GCV both have their leverage through preferred stock. That adds risks to the downside should things continue to deteriorate. However, the fixed-rate leverage expense can be one less thing to worry about in a rising interest rate environment.
The Series E Cumulative Preferred for GCV yields 4%. ECF Series A Preferred (ECF.PA) yields 5.25%.
Both funds utilize leverage, with ECF at around 18% and GCV more highly leveraged at 28.60%. If the market takes off, it could result in GCV performing better on a total NAV return. I think the valuation difference is still sufficiently far apart that it would have to be some massive outperform to justify the premium.
Conclusion
Based on the valuation and similarities, there is a clear signal that investors in GCV should swap out of the fund. Potential alternatives while waiting for more reasonable valuations would be ECF and BCV. ECF is the slightly better option now, with a deeper discount than BCV. The divergence in the valuations has expanded even further since earlier this year.
Be the first to comment