

GBP/USD started a major decline below 1.3200. USD/CAD is rising, but facing a major resistance near the 1.2800 zone.
Important Takeaways for GBP/USD and USD/CAD
· The British Pound started a fresh decline from the 1.3300 resistance zone.
· There is a key bearish trend line forming with resistance near 1.3055 on the hourly chart of GBP/USD.
· USD/CAD is rising and showing positive signs above the 1.2750 level.
· There are two key bearish trend lines forming with resistance near 1.2790 and 1.2820 on the hourly chart.
GBP/USD Technical Analysis
The British Pound started a strong decline from well above 1.3300 against the US Dollar. The GBP/USD pair gained bearish momentum after there was a break below the 1.3200 support.
The pair even broke the 1.3120 support level and the 50 hourly simple moving average. Finally, there was a move below the 1.3050 support. A low is formed near 1.3011 on FXOpen and the pair is now consolidating losses.
On the upside, an initial resistance is near the 1.3050 level. There is also a key bearish trend line forming with resistance near 1.3055 on the hourly chart of GBP/USD. The trend line is close to the 23.6% Fib retracement level of the recent decline from the 1.3194 swing high to 1.3011 low.
The next major resistance is near the 1.3100 level. It is near the 50% Fib retracement level of the recent decline from the 1.3194 swing high to 1.3011 low.
Any more gains could lead the pair towards the 1.3200 barrier in the near term. If not, the pair could continue to move down and might even break the 1.3000 support. If there is a downside break, GBP/USD might test the 1.2950 support. The next major support sits at 1.2880.
USD/CAD Technical Analysis
The US Dollar formed a strong support base above the 1.2700 and 1.2690 levels against the Canadian Dollar. The USD/CAD pair started a decent increase and it broke the 1.2725 resistance zone.
The pair gained pace for a move above the 1.2750 level and the 50 hourly simple moving average. It is now trading above the 38.2% Fib retracement level of the key decline from the 1.2900 swing high to 1.2693 swing low.
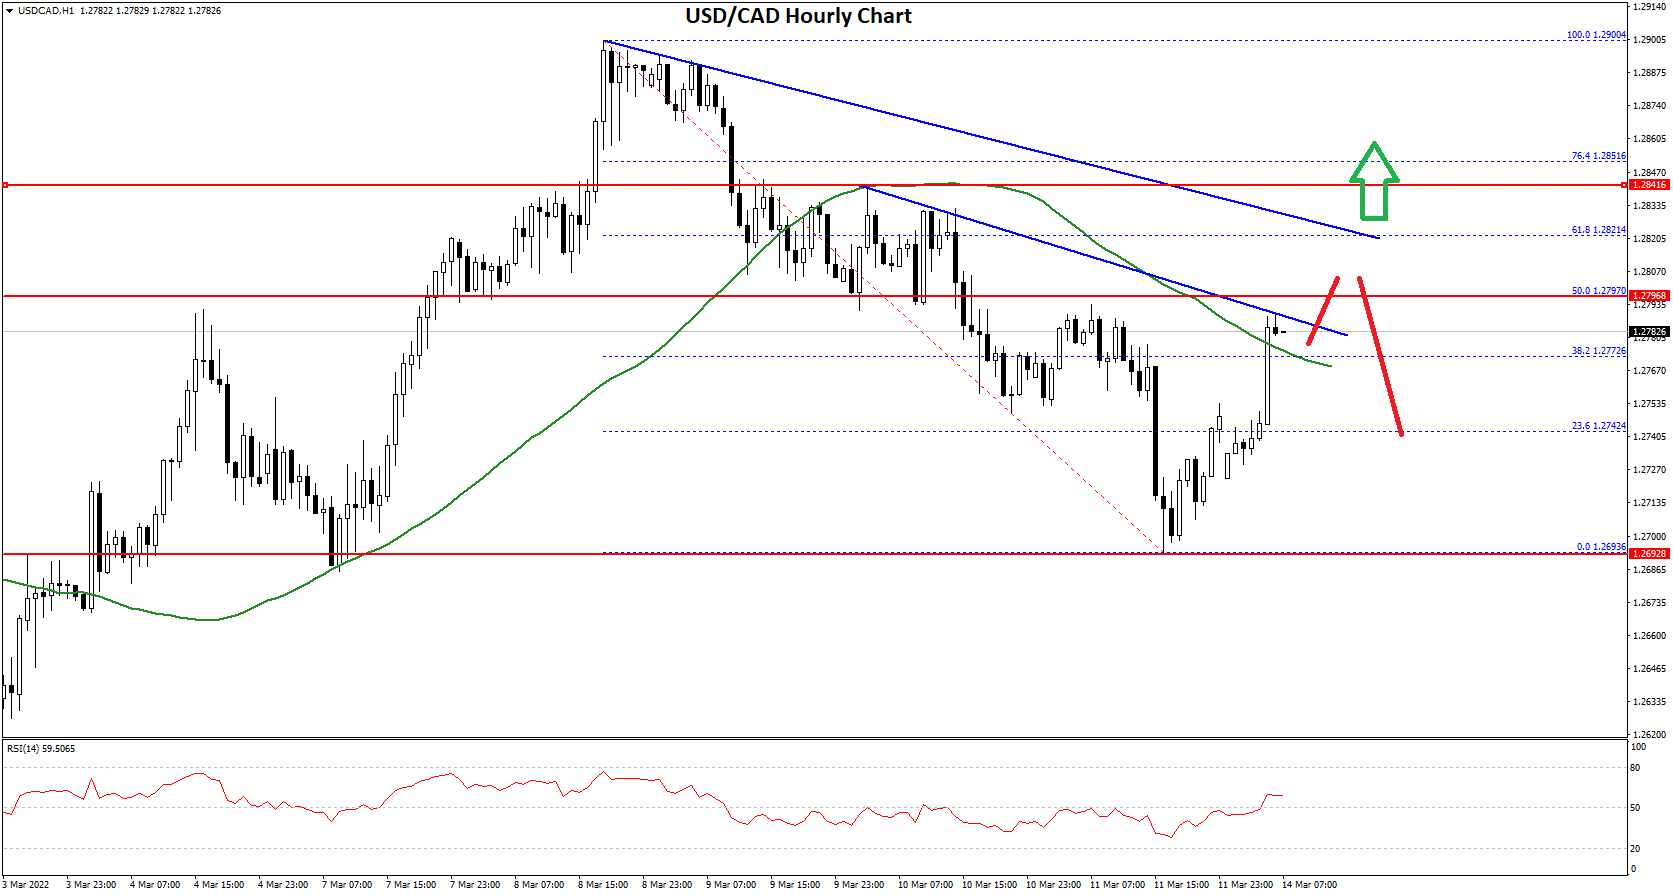
On the upside, the pair is facing hurdles near 1.2790 and 1.2800. There are also two key bearish trend lines forming with resistance near 1.2790 and 1.2820 on the hourly chart.
An intermediate resistance is near the 50% Fib retracement level of the key decline from the 1.2900 swing high to 1.2693 swing low. An upside break above the 1.2820 resistance zone could open the doors for a fresh increase. The next major resistance is near the 1.2900 level, above which the pair could rise towards the 1.3000 level.
On the downside, the pair is likely to find bids near 1.2740. The next major support is near the 1.2700 level. A downside break below 1.2700 support level could push the pair further lower.
The next major support is near the 1.2650 zone, below which the pair could even test 1.2620. Any more losses might call for a move to 1.2580.
This forecast represents FXOpen Markets Limited opinion only, it should not be construed as an offer, invitation or recommendation in respect to FXOpen Markets Limited products and services or as financial advice.

Be the first to comment