

alvarez
Introduction
SFL Corporation Ltd. (NYSE:SFL) released its third quarter 2022 results on November 14, 2022.
Note: This article is an update of my article published on August 19, 2022. I have followed EGO’s quarterly Seeking Alpha results since Sept. 2014.
1 – 3Q22 Results Snapshot
SFL reported a quarterly income of $0.36 per diluted share compared to $0.26 per share in the same quarter a year ago.
It was another solid quarter with a new record in revenues. The company’s total U.S. GAAP operating revenues on a consolidated basis were $166.89 million in 3Q22, compared to $135.45 million in the previous year’s quarter.
Note: This figure is lower than the cash received as it excludes revenues from charter hire, which are not identified as operating revenues U.S. GAAP. More details later in this article. The cash revenues received in 3Q22 were $178.19 million.
The company maintained its quarterly dividend at $0.23 per share this quarter. The dividend yield is now 8.6%.
Adjusted EBITDA on a consolidated basis was $125.58 million, up from $112.25 million posted the same quarter a year ago.
According to the press release: As of September 30, 2022, and adjusted for subsequent transactions, the estimated fixed-rate charter backlog from the Company’s fleet of 78 wholly- or partly-owned vessels and new building under construction was approximately $3.8 billion with a weighted remaining charter term of 6.8 years.
The backlog is increasing quarterly, another positive from a long-term investment perspective.
SFL Quarterly Backlog history (Fun Trading)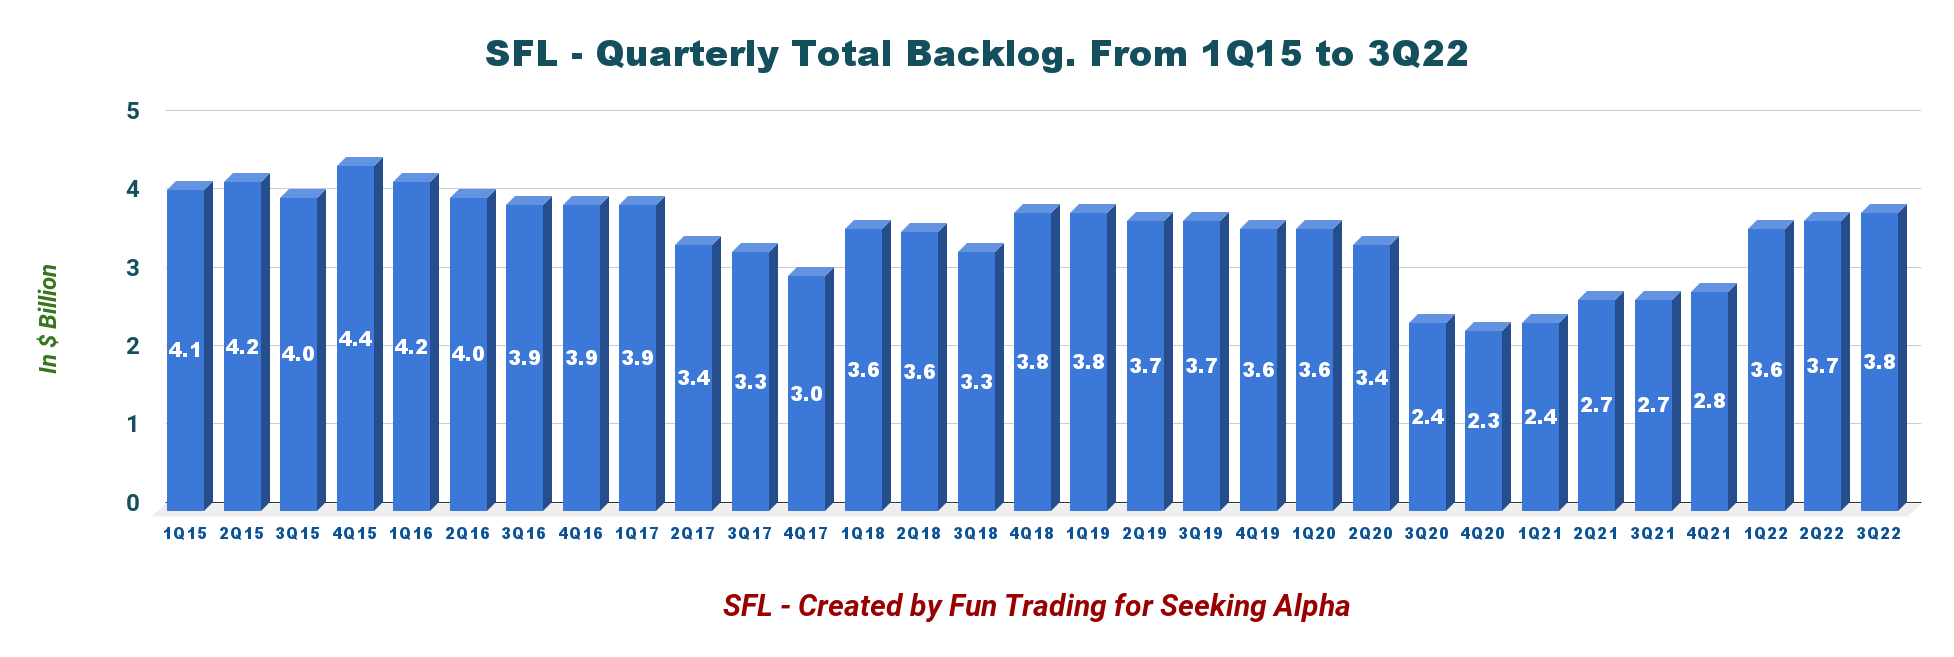
2 – Investment Thesis
I have been an SFL shareholder for years and follow the company through good times and not-so-good times.
However, one constant here is that the management never gave up and always succeeded by making the best out of what the economy had to offer.
CEO Ole Hjertaker said in the conference call:
Over the years, we have gone from a single asset class charter to 1 single customer to a diversified fleet and multiple counterparties, and the fleet composition has varied from 100% tankers to nearly 60% offshore 10 years ago to container vessels now being the largest segment with 53% of the backlog.
The company went through Seadrill’s bankruptcy and shipping crisis with falling rates, but it always survived with innovation that kept the ship afloat.
As I speak, looking at SFL from this management perspective is essential because we are probably entering a new bearish period. The global shipping industry is increasingly facing a new problem – too many containers.
It points to more signs of falling global demand and an impending economic slowdown. Traders and shippers say the decline in global consumer demand is not a sign the global economy is normalizing after a frantic post-lockdown consumption rush but a downward shift in consumption appetites.
Last week, major shipping group Maersk warned in its third quarter results that freight rates have peaked amid easing supply chain congestion and falling demand. The company told investors to expect lower ocean shipping profits.
The Tanker segment is also weakening as we enter 2023. BIMCO’s Chief Shipping Analyst, Niels Rasmussen, is not totally bullish.
Capacity supply in both segments is expected to grow slower than the fleet during 2023 and may even drop by 2-3% compared to 2022 due to reductions in sailing speed arising from EEXI, CII, and ETS implementation.
Thus, the investment thesis continues to be the same as my preceding article, and I recommend SFL as a long-term investment.
However, I suggest trading short-term SFL using at least 30% of your entire position to profit from this volatile and ever-changing industry fully. This two-level strategy has prevailed in my marketplace, “The Gold and Oil Corner,” and I believe it is the most rewarding.
3 – Stock Performance
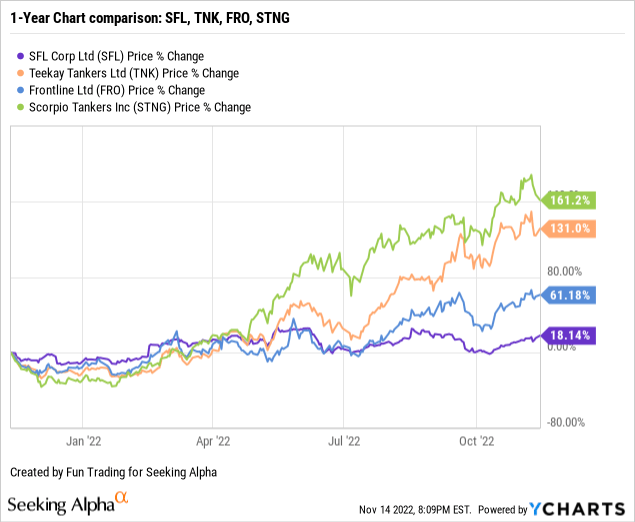
I generally compare SFL to three other companies I follow on Seeking Alpha. Teekay Tankers (TNK), Scorpio Tankers (STNG), and Frontline (FRO).
They are pure Tankers companies and are not entirely comparable to SFL. Still, they give an excellent indication of income. SFL is up 18% on a one-year basis and has underperformed the more specialized Tankers segment. Especially STNG, which is up 161%.
SFL Corp.: The Raw Numbers: Third Quarter Of 2022 And Financials History
| SFL | 3Q21 | 4Q21 | 1Q22 | 2Q22 | 3Q22 |
| Total Revenues in $ Million | 135.45 | 152.06 | 152.39 | 153.30 | 166.89** |
| Net Income in $ Million | 33.21 | 80.12 | 47.02 | 57.41 | 49.89 |
| EBITDA $ Million | 57.88 | 148.52 | 117.10 | 84.93 | n/a |
| Adjusted EBITDA in $ Million | 112.26 | 121.30 | 119.01 | 123.57 | 125.58 |
| EPS diluted in $/share | 0.26 | 0.63 | 0.37 | 0.45 | 0.36 |
| Operating cash flow in $ Million | 77.14 | 91.50 | 81.51 | 85.20 | 79.92 |
| CapEx in $ Million | 411.38 | 146.80 | 186.74 | 8.12 | 179.16 |
| Free Cash Flow in $ Million | -334.24 | -55.30 | -105.24 | 77.08 | -99.25* |
| Total cash $ Million |
275.39 |
166.83 |
173.02 |
244.55 |
188.01 |
| Long-term debt in $ Million | 2,000 | 1,889 | 2,026 | 1,964 | 2,025 |
| Dividend per share in $ | 0.18 | 0.20 | 0.22 | 0.23 | 0.23 |
| Shares outstanding (Basic) in Million | 156.06 | 128.79 | 126.79 | 138.55 | 138.60 |
Source: SFL release
* Estimated by Fun Trading
** Gain on sale of assets and termination charter is not included and was $11.3 million in 3Q22.
Analysis: Revenues, Earnings Details, Free Cash Flow, And Backlog Discussion
1 – Operating revenues were $166.89 million in 3Q22
1.1 – Revenues and others
SFL Quarterly Revenues history (Fun Trading) Operating revenues were another record of $166.89 million compared to $135.45 million in the same quarter a year ago and up from $153.30 million in 2Q22.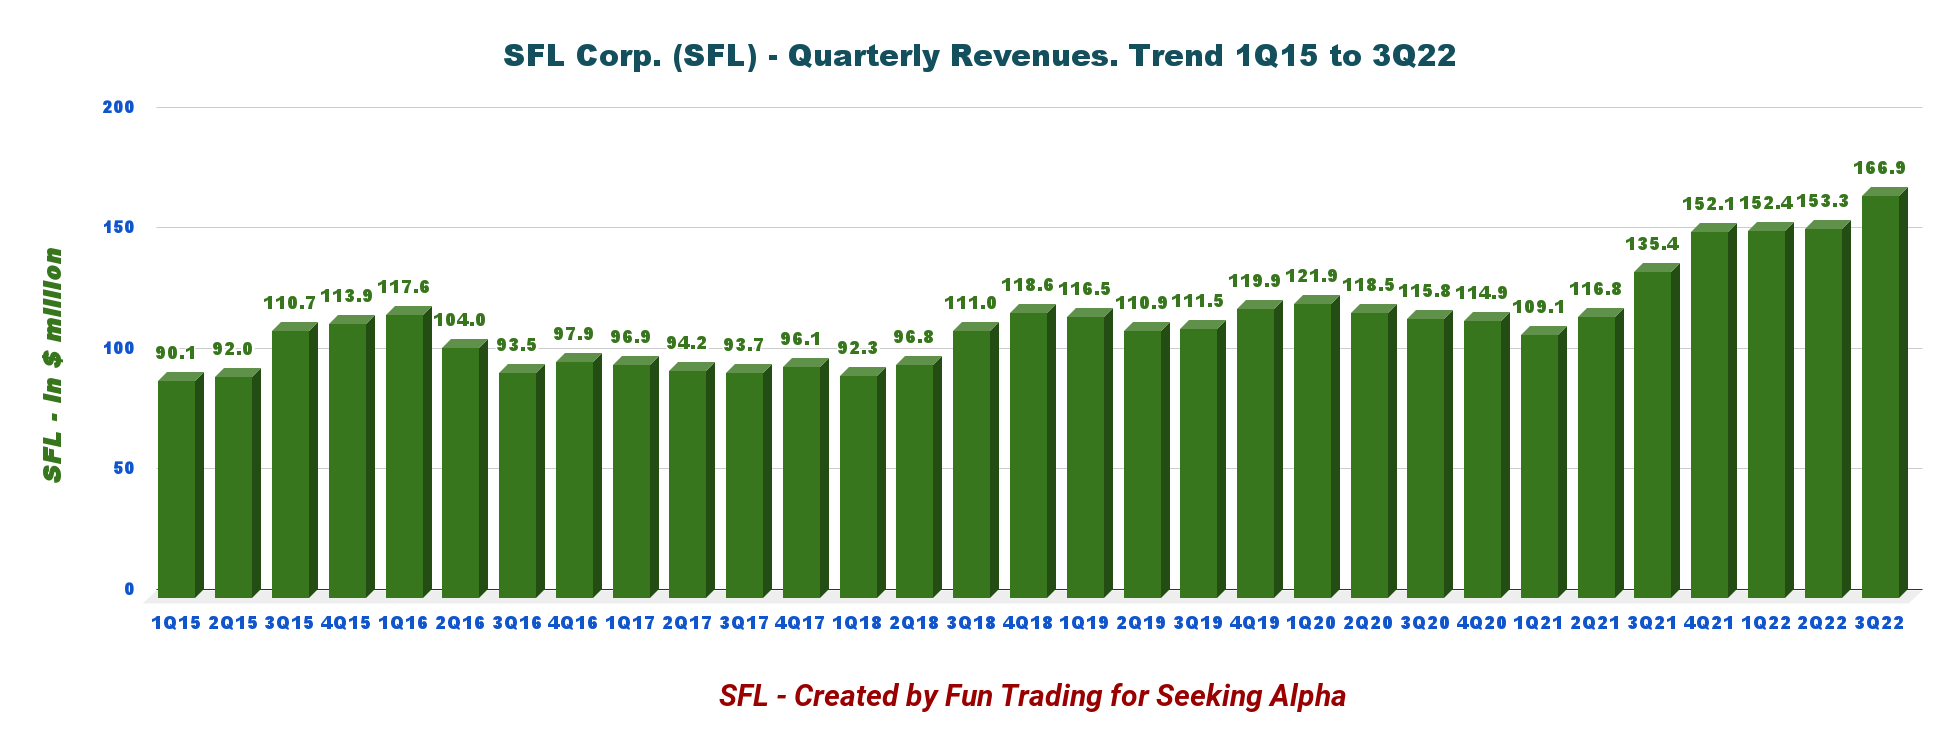
SFL Corp. received a charter hire of approximately $178.19 million from the Company’s vessels and rigs, including $11.30 million in Gain on the sale of assets and termination of charters.
CEO Ole Hjertaker said in the conference call:
The total charter revenues were $178 million in the quarter, which was up 8% compared to the second quarter. The maturity of revenues was from vessels on long-term charters and around 18% for vessels deployed on short-term charters and in the spot market.
The company had $49.89 million in income for the third quarter of 2022, or $0.36 per diluted share (estimated).
Adjusted EBITDA was $125.58 million, up 11.9% from last year.
SFL Quarterly Adjusted EBITDA history (Fun Trading)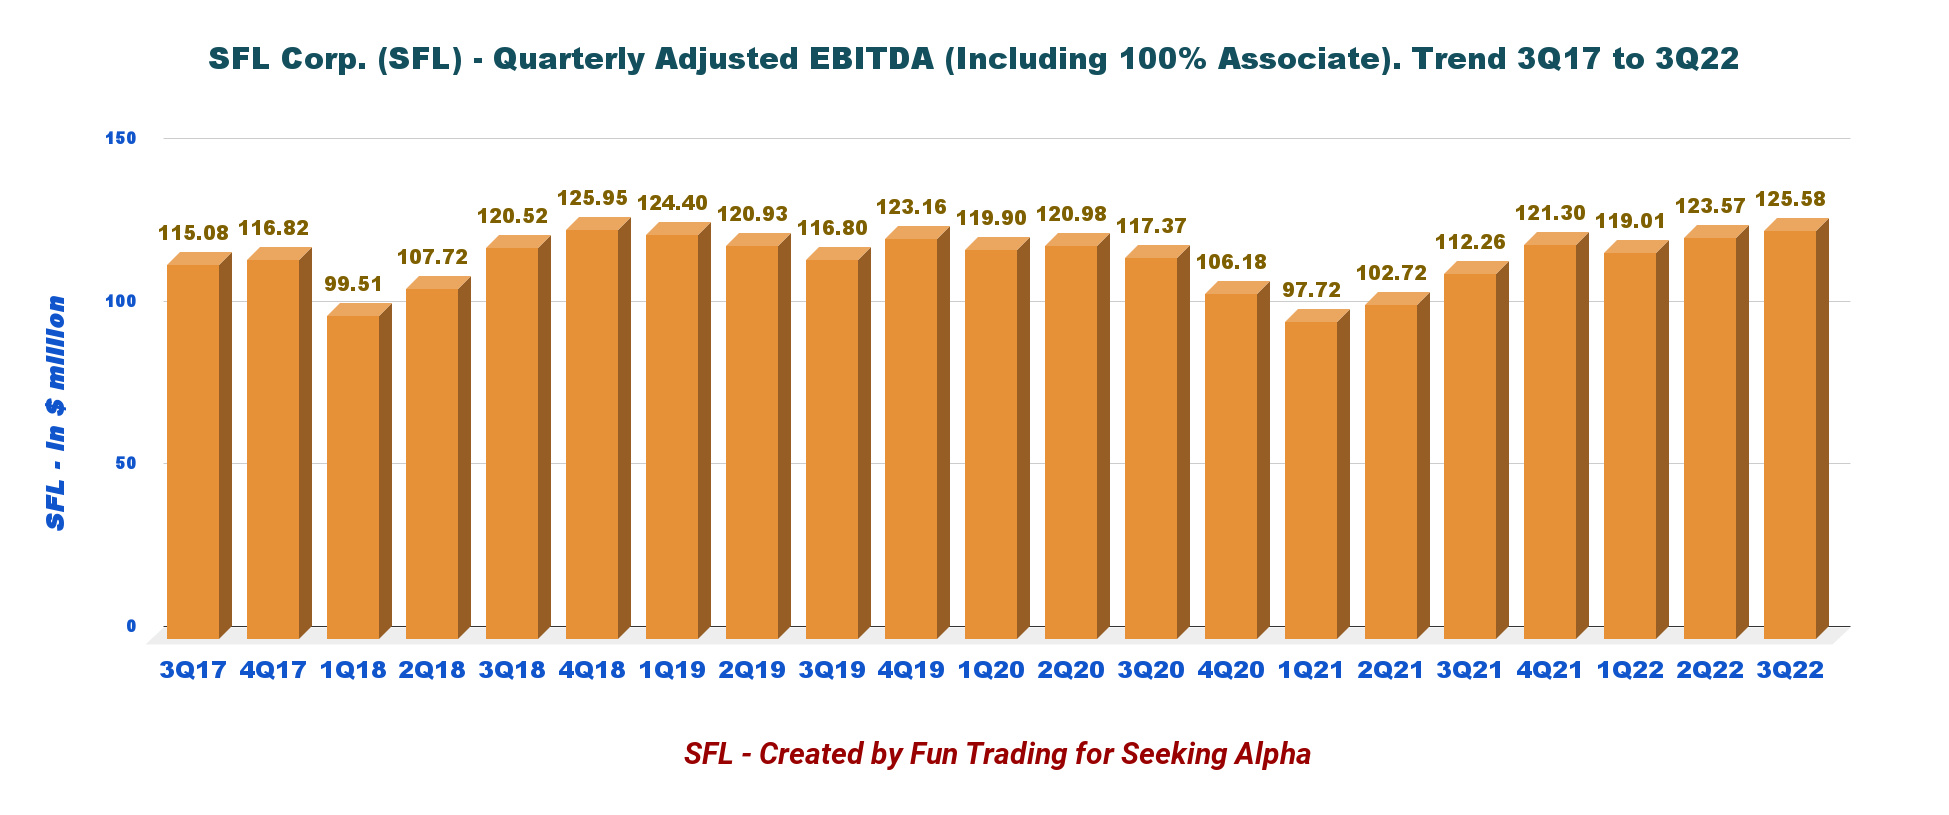
1.2 – Highlights during 3Q22
- 75th consecutive quarterly dividend declared, $0.23 per share
- Net profit of $49.9 million, or $0.39 per share in the third quarter
- Received charter hire of approximately $177.5 million in the quarter from the Company’s vessels and rigs, including $11.3 million of profit share
- Adjusted EBITDA of $117.7 million from consolidated subsidiaries, plus an additional $7.9 million adjusted EBITDA from associated companies
- Acquisition of two newbuilding feeder container vessels with seven-year charters to Maersk and a car carrier with six-year charter to a leading car carrier operator
- Delivery of four modern Suezmax tankers which immediately commenced six-year charters to a subsidiary of Koch Industries, a world-leading industrial conglomerate
Note: source press release.
1.3 – The quarterly dividend is $0.23 per share in 3Q22, unchanged from 2Q22. A slight disappointment here.
It is still a historical low for the company, but we see definitive progress on this side, with a yield now of 8.6%.
SFL Quarterly Dividend history (Fun Trading)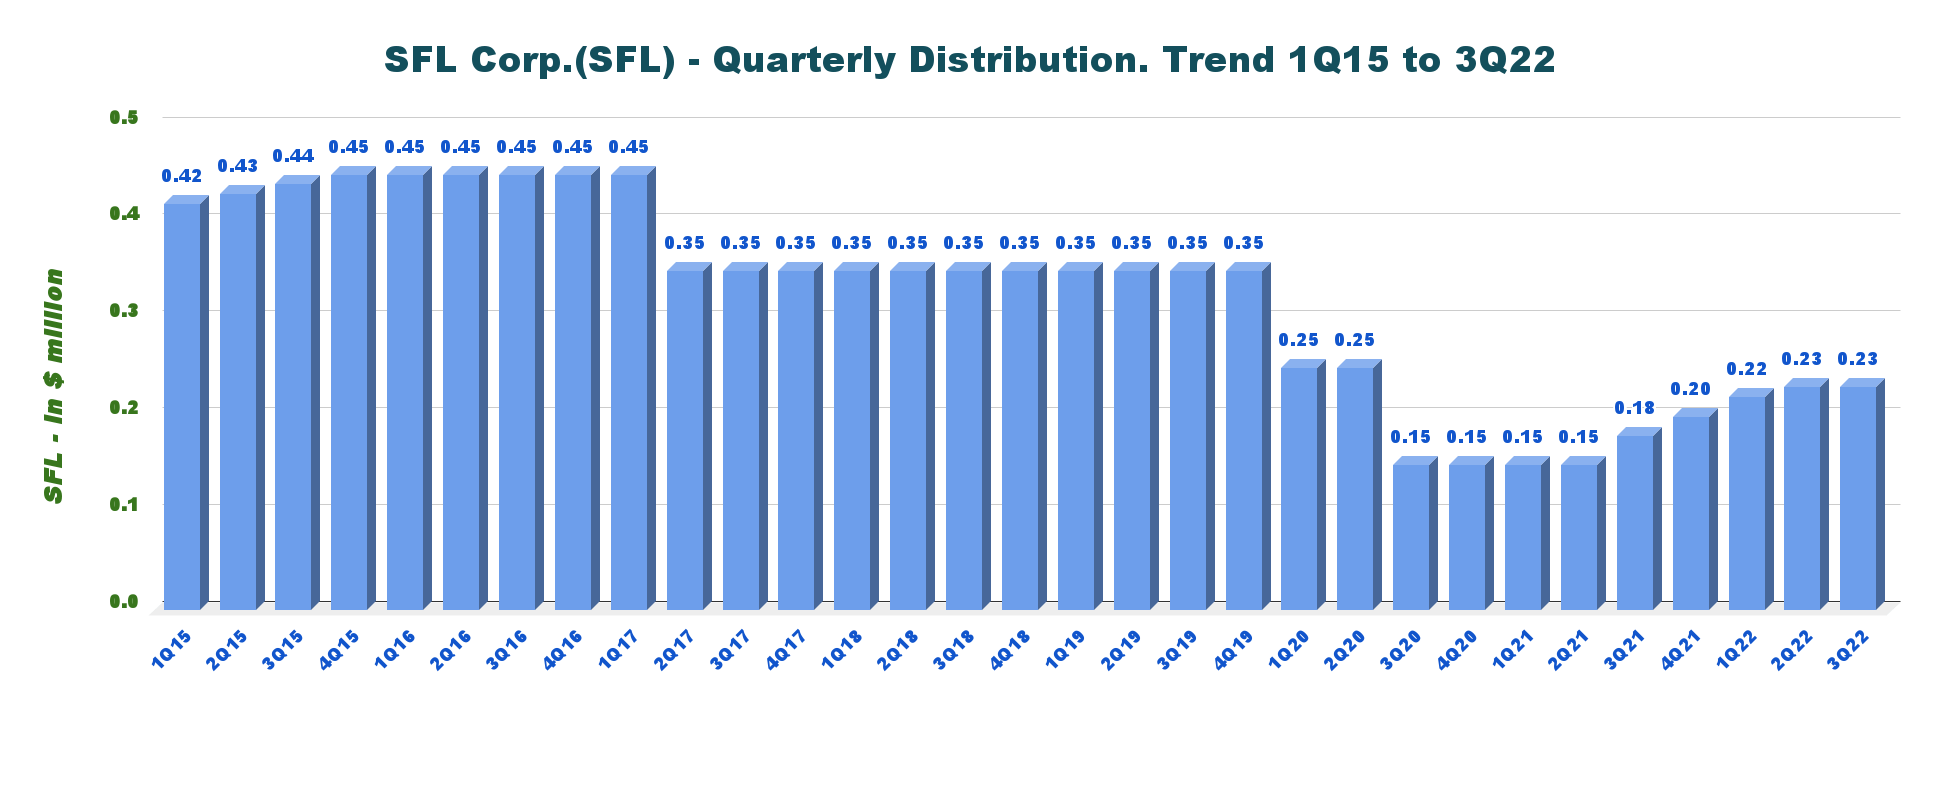
2 – Free cash flow is a loss estimated at $99.25 million in 3Q22
SFL Quarterly Free cash flow (Fun Trading)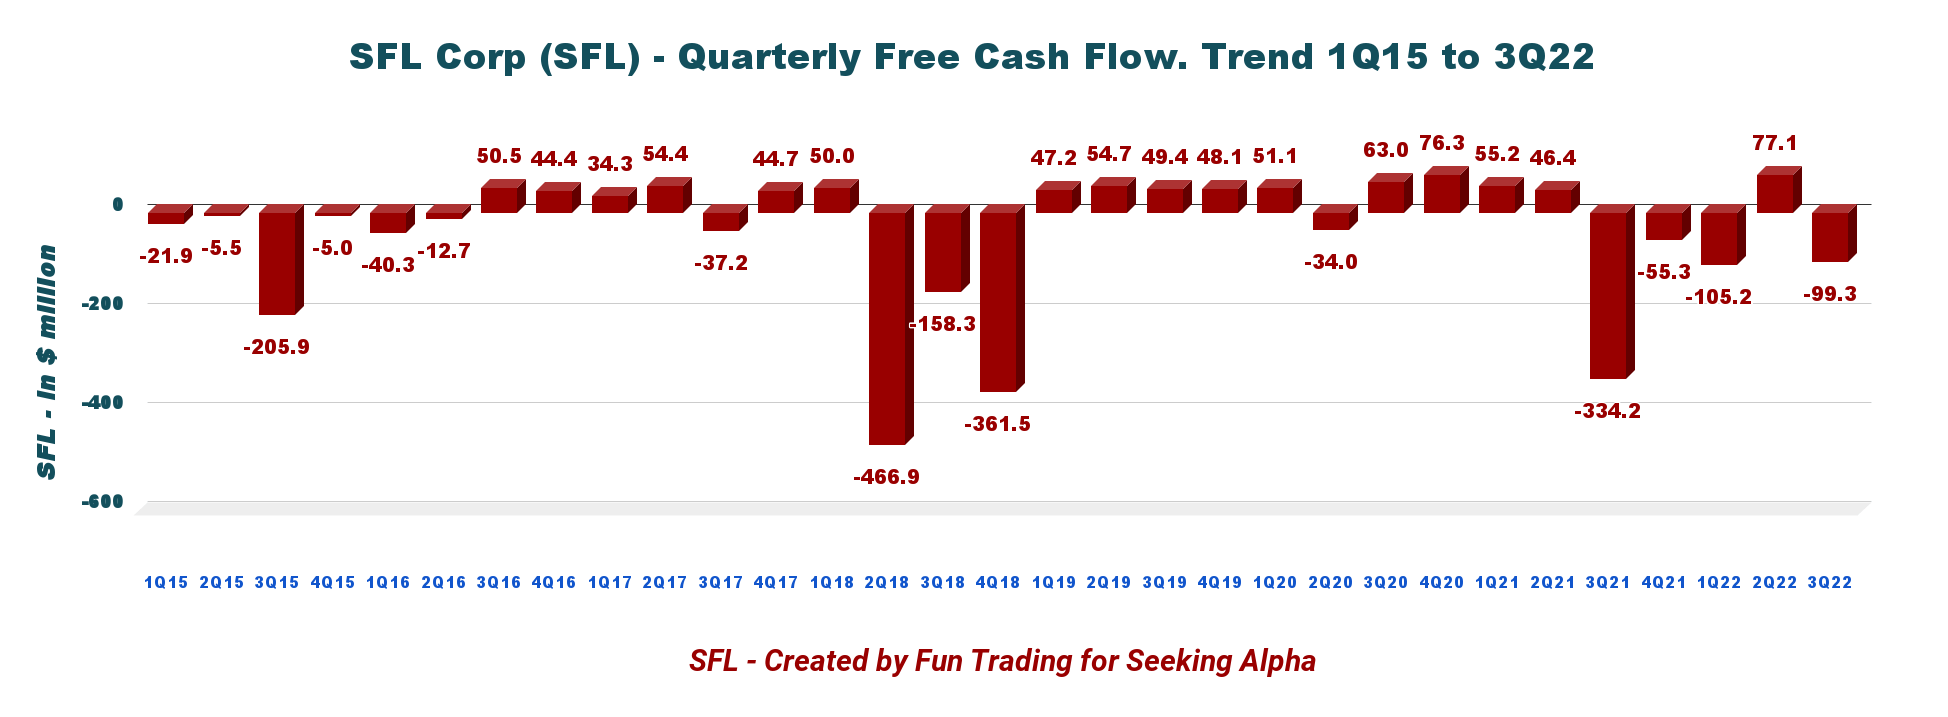
Trailing 12-month free cash flow (“ttm”) is a loss of $182.71 million, with a free cash flow loss estimated at $99.25 million in 3Q22.
The loss in free cash flow can be explained by the significant CapEx used by the company to expand and adapt constantly. In this case, the loss is not necessarily a negative. CapEx was elevated this quarter at $179.16 million.
3 – Debt analysis: Net debt is estimated at $1,837 billion in 3Q22
SFL Quarterly Cash versus Debt history (Fun Trading)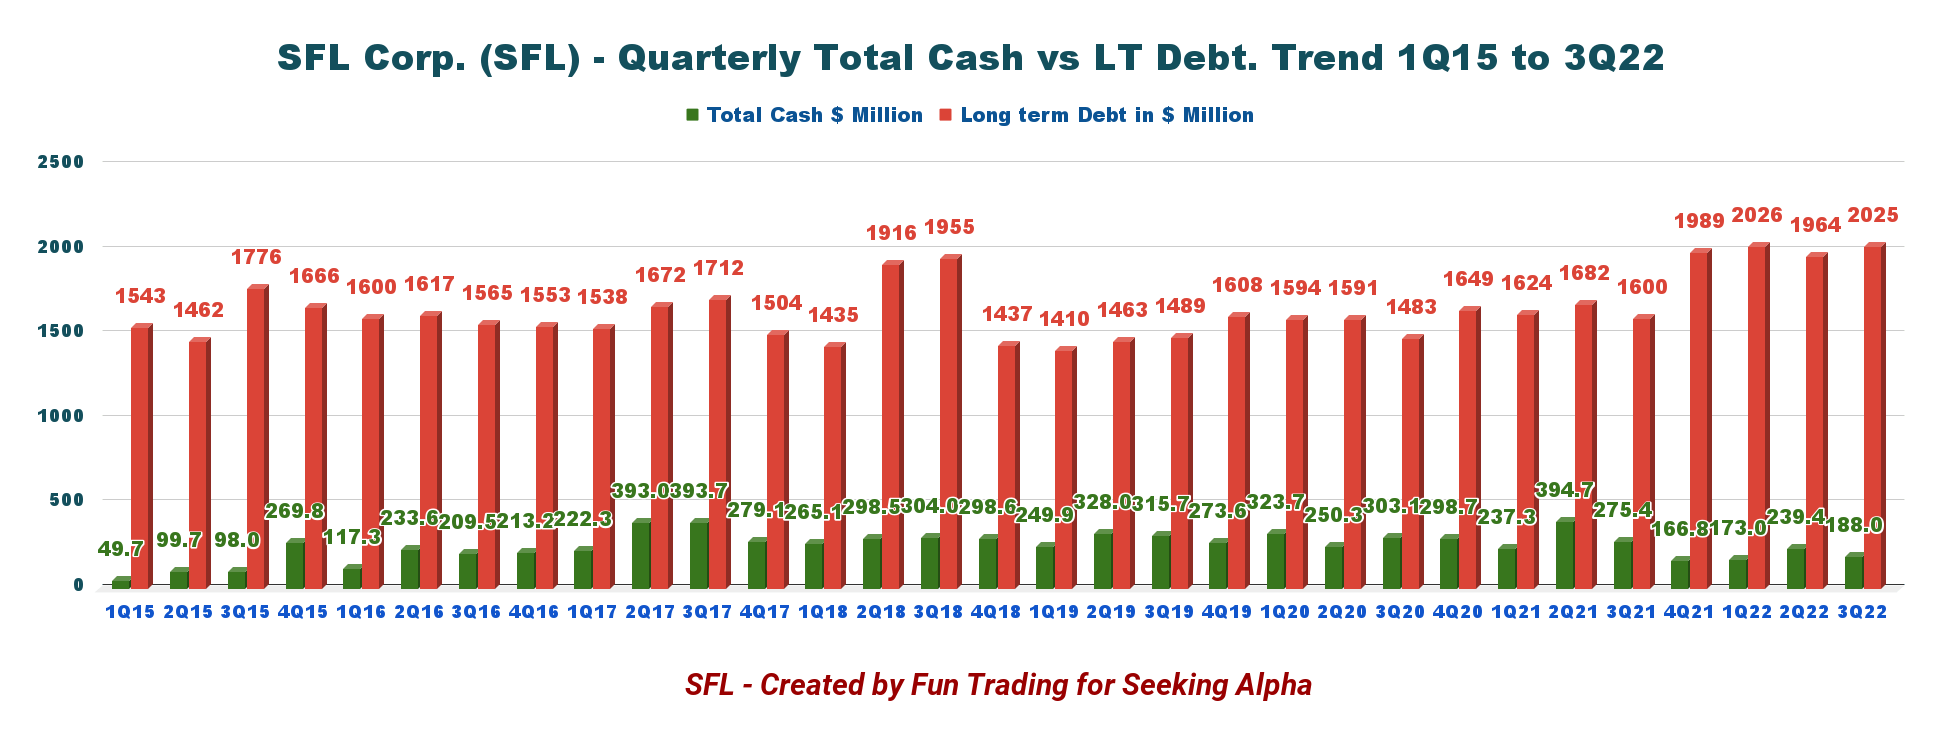
During the third quarter, SFL secured refinancing facilities for its eight Capesize vessels and two kamsarmax vessels for $115 million and $23 million, respectively. The transactions freed up approximately $25 million across the ten vessels.
4 – Segment Analysis
4.1 – The offshore segment. Seadrill has emerged from bankruptcy
SFL owns two HE rigs. The semisub West Hercules and the support jack-up West Linus have been chartered to Seadrill since 2008 and 2014.
During the third quarter of 2022, SFL received a charter hire of $10.7 million of charter hire for the rigs.
The Linus was redelivered from Seadrill and is now managed by Odfjell Technology on behalf of SFL. The rig is under a long-term contract with ConocoPhillips Skandinavia AS until year-end 2028, and the rig works on the greater Ekofisk field, one of the largest oil fields in Norway.
The semi-submersible rig Hercules remains on a bareboat charter to Seadrill, currently estimated to end in December 2022. The rig will then be redelivered to SFL in Norway and, after that, managed by Odfjell Drilling on behalf of SFL.
The rig will undergo its scheduled special periodic survey in 1Q23 and is currently being marketed for new charter opportunities from 2Q23 onwards, which will be an easy task. The cost of the SPS is estimated at $50 million.
4.2 – SFL dry bulk segment
The Company has 15 dry bulk carriers, of which nine were employed on long-term charters in the quarter.
SFL generated approximately $26.5 million in gross charter hire from the dry bulk fleet in the third quarter, including a roughly $1.2 million profit share.
4.3 – Tankers segment
SFL has a fleet of 18 crude oil, product, and chemical tankers, including announced transactions, with the majority employed on long-term charters. The vessels generated approximately $42.4 million in gross charter hire during the quarter.
4.4 – Liners segment
SFL has a liner fleet of 36 container vessels, including announced transactions, and seven car carriers, four under construction.
The liner fleet generated approximately $97.9 million in gross charter hire in the quarter. Roughly $10.1 million of the hire was a profit share from scrubber fuel savings.
As of September 30, 2022, the estimated fixed-rate charter backlog from the wholly- and partly-owned liner fleet was approximately $2.5 billion, with an average remaining charter term of about 4.7 years or 7.4 years if weighted by charter hire.
Technical Analysis (Short Term) And Commentary
SFL TA Chart short-term (Fun Trading StockCharts)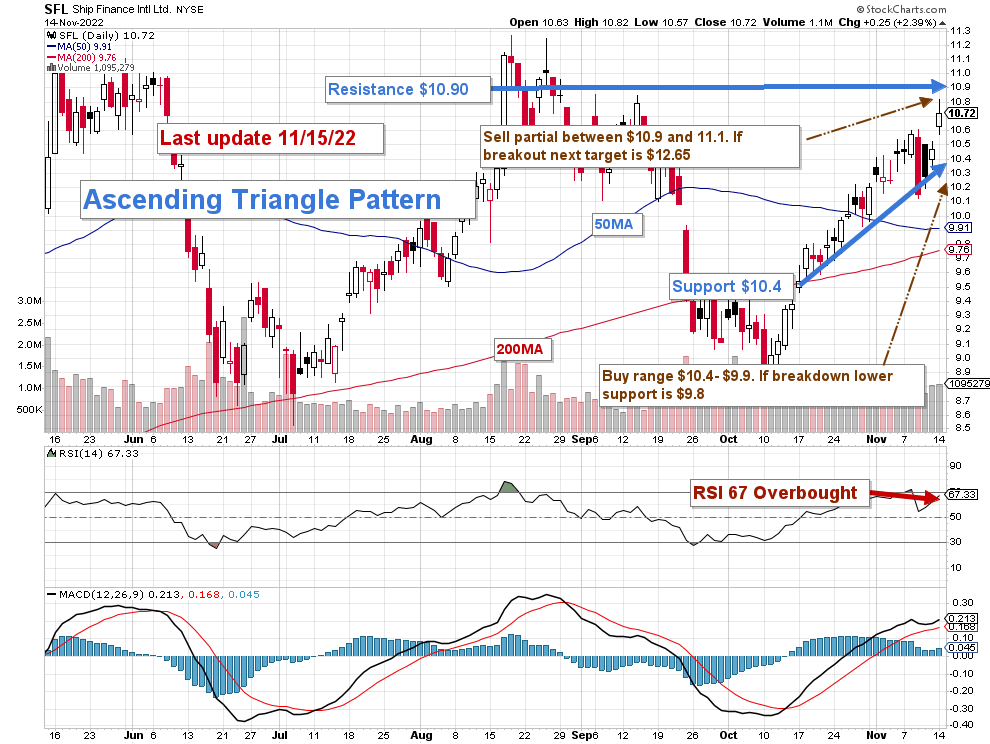
Note: The graph has been adjusted for the dividend.
SFL forms an ascending triangle pattern with resistance at $10.90 and support at $10.4. The ascending triangle pattern is generally bullish and begins during an uptrend as a continuation pattern. Thus, we should expect a breakout soon.
However, on the other hand, the RSI signals an overbought situation at 67, which means a takeout will be challenging to achieve and will necessitate a bullish business environment that may not be here due to a looming recession threat.
The overall strategy that I regularly promote in my marketplace, “The Gold And Oil Corner,” is to keep a core long-term position and utilize about 35% to trade LIFO (see note below) while waiting for a higher final price target for your core position between $14 and $16.
The trading strategy is to sell 35% at or above $10.9 and wait for a retracement between $10.4 and $9.8.
Note: The LIFO method is prohibited under International Financial Reporting Standards (IFRS), though it is permitted in the United States by Generally Accepted Accounting Principles (GAAP). Therefore, only US traders can apply this method. Those who cannot trade LIFO can use an alternative by setting two different accounts for the same stock, one for the long-term and one for short-term trading.
Warning: The TA chart must be updated frequently to be relevant. It is what I am doing in my stock tracker. The chart above has a possible validity of about a week. Remember, the TA chart is a tool only to help you adopt the right strategy. It is not a way to foresee the future. No one and nothing can.
Author’s note: If you find value in this article and would like to encourage such continued efforts, please click the “Like” button below as a vote of support. Thanks.
Be the first to comment