

British Pound (GBP) Price Outlook – GBP/USD and EUR/GBP Chart and Analysis
Recommended by Nick Cawley
How to Trade GBP/USD
For all market-moving data and events, see the DailyFX Calendar
The British Pound is clawing back some of this week’s losses against a buoyant US dollar, keeping the multi-month uptrend intact. The pair have been predominantly influenced by the rally in the US dollar although the ongoing EU/UK vaccination spat continues to weigh on Sterling. While the UK’s vaccination program is hitting its straps, with over 45% of the population having had at least one jab, this success is causing friction at the top of the EU. European Commission President Ursula Von der Leyen wants to restrict vaccine exports to other countries, including the UK, arguing that these exports are holding back the block’s vaccination program.
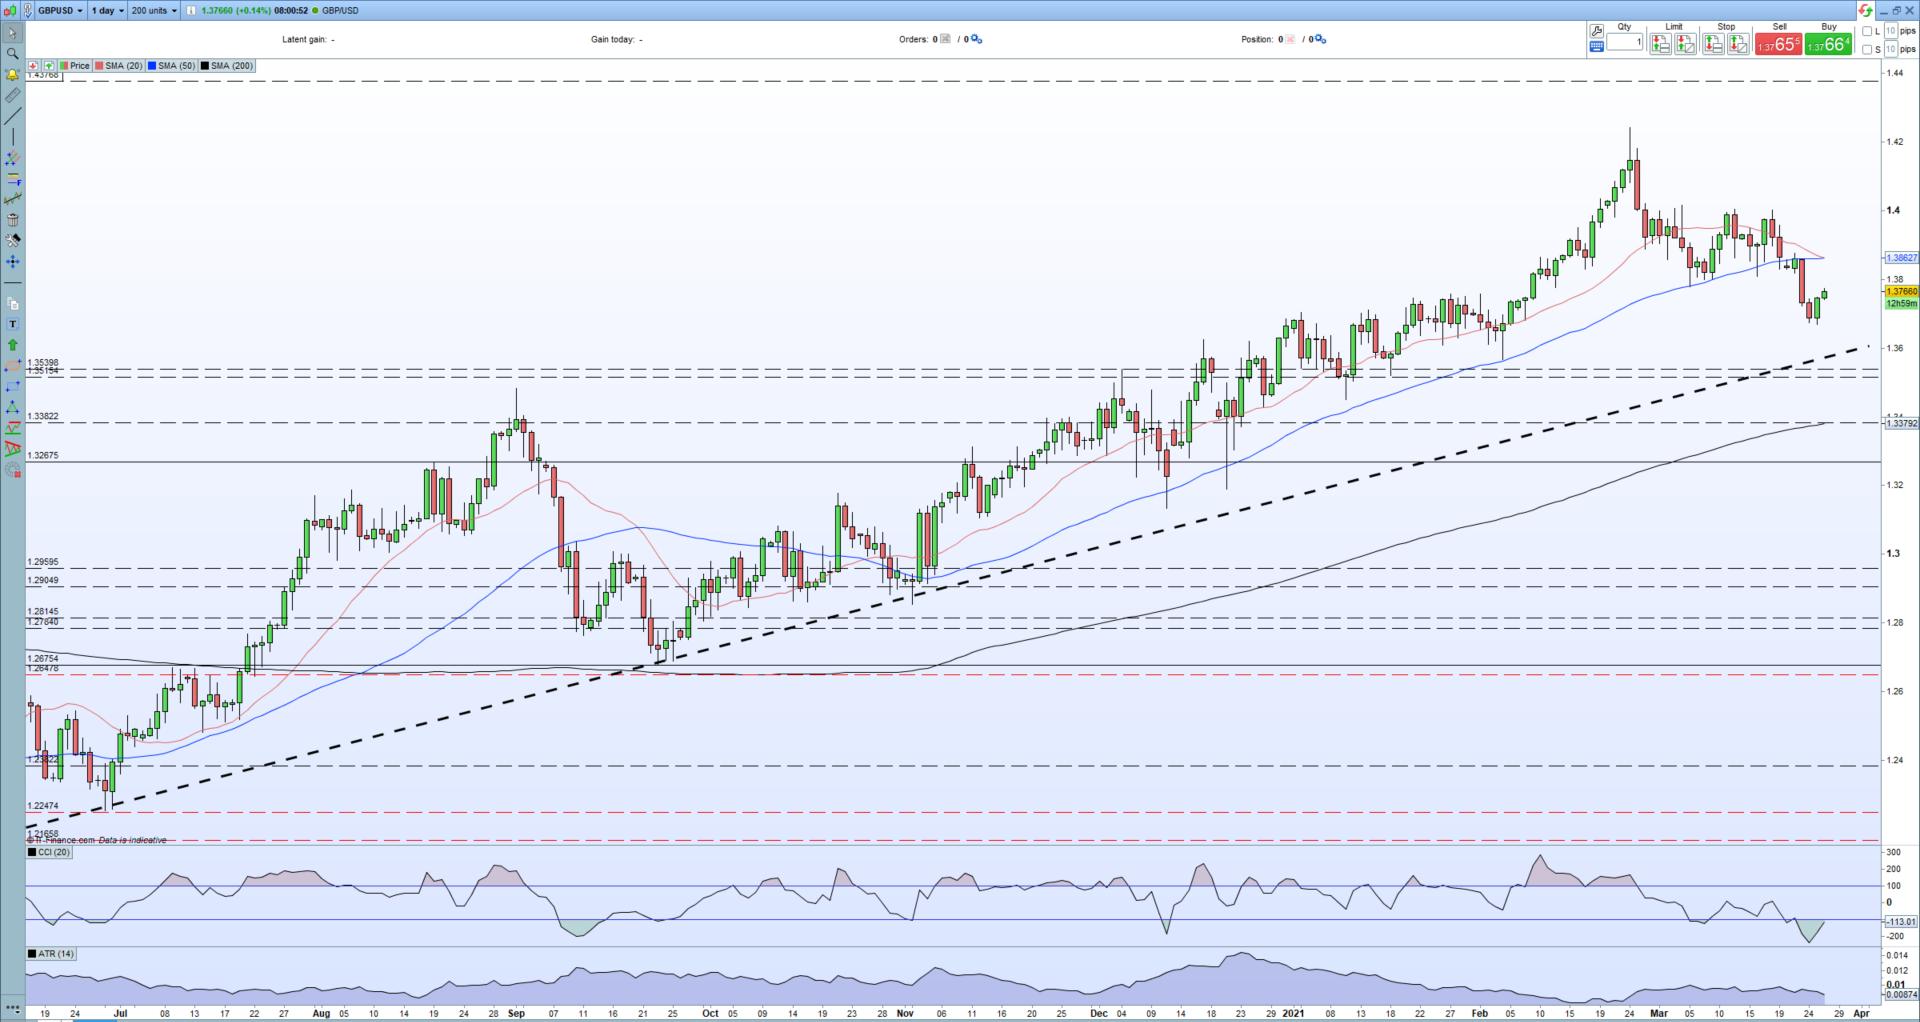
GBP/USD broke below the supportive 50-day simple moving average with conviction on Tuesday after testing and rejecting it over the past few months. This medium-term sma now turns to initial resistance, currently at 1.3863, where it is also joined by the 20-day sma to add further weight to the resistance level. For the pair to turn bullish again, the cluster of prior highs between 1.4000 and 1.4025 needs to be broken and opened above.
Popular Moving Averages and How to Use Them
GBP/USD Daily Price Chart (June 2020 – March 26, 2021)
| Change in | Longs | Shorts | OI |
| Daily | -6% | 2% | -3% |
| Weekly | 19% | -15% | 2% |
Retail trader data show 60.45% of traders are net-long with the ratio of traders long to short at 1.53 to 1.We typically take a contrarian view to crowd sentiment, and the fact traders are net-long suggests GBP/USD prices may continue to fall.Positioning is less net-long than yesterday but more net-long from last week. The combination of current sentiment and recent changes gives us a further mixed GBP/USD trading bias.
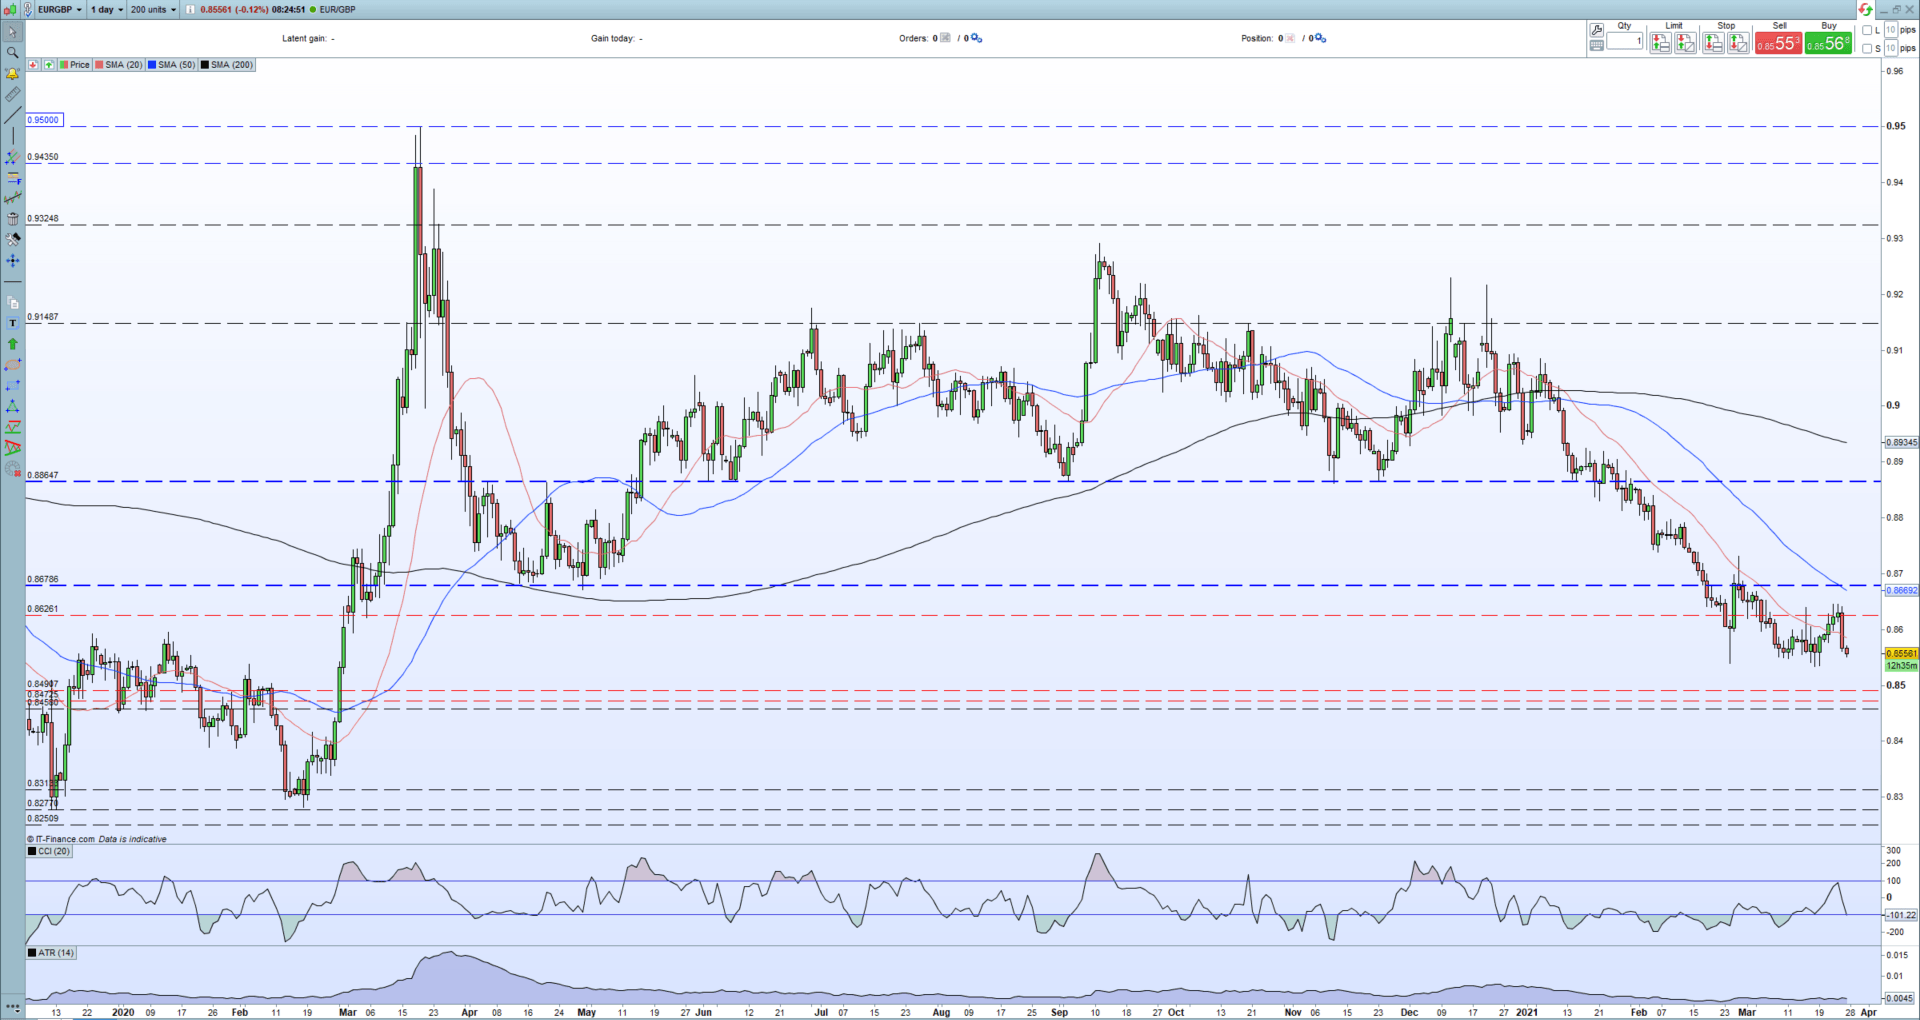
Yesterday’s sharp sell-off in EUR/GBP was sparked primarily by weakness in the Euro and a mild Sterling bid. The pair had been creeping higher after making a recent double bottom around 0.8535, but once again short-term resistance around 0.8640-45 held and the pair fell sharply on Thursday. The chart set-up remains biased towards the downside and a break below0.8533 leaves no real support visible until a pair of old swing lows around 0.8275.
EUR/GBP Daily Price Chart (December 2019 – March 26, 2021)
Traders of all levels and abilities will find something to help them make more informed decisions in the new and improved DailyFX Trading Education Centre
What is your view on GBP/USD and EUR/GBP – bullish or bearish?? You can let us know via the form at the end of this piece or you can contact the author via Twitter @nickcawley1.
Be the first to comment