

GBP price, news and analysis:
- Data for UK GDP in the fourth quarter were revised upwards, and that might have been expected to lift GBP/USD even though the figures are now dated.
- The fact that it didn’t suggests near-term losses for the pair, particularly as the yield on the 10-year UK Government bond continues to rise.
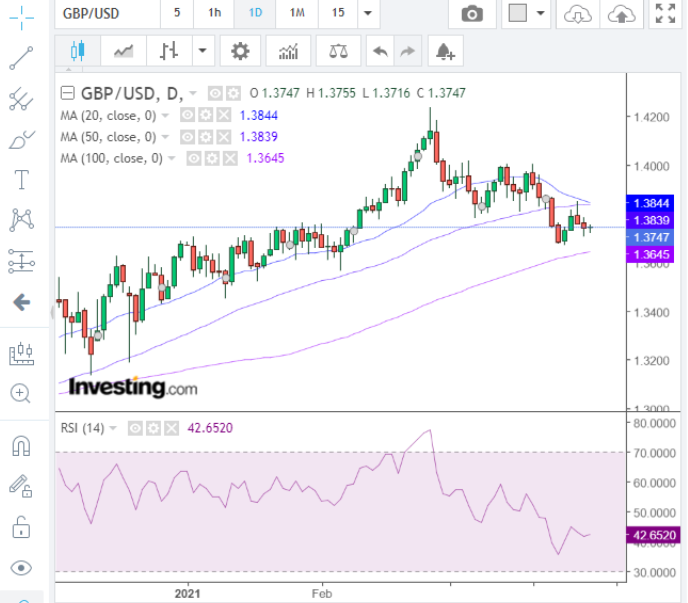
GBP/USD may weaken near term
UK GDP data for the final quarter of last year have been revised upwards but that failed to lift GBP/USD early Wednesday. For sure, the figures are now out of date but Sterling’s failure to respond still suggests it could weaken a tad further near-term, perhaps to the 1.37 level.
GBP/USD Price Chart, Daily Timeframe (December 4, 2020 – March 31, 2021)
Source: Investing.com (You can click on it for a larger image)

Recommended by Martin Essex, MSTA
How to Trade GBP/USD
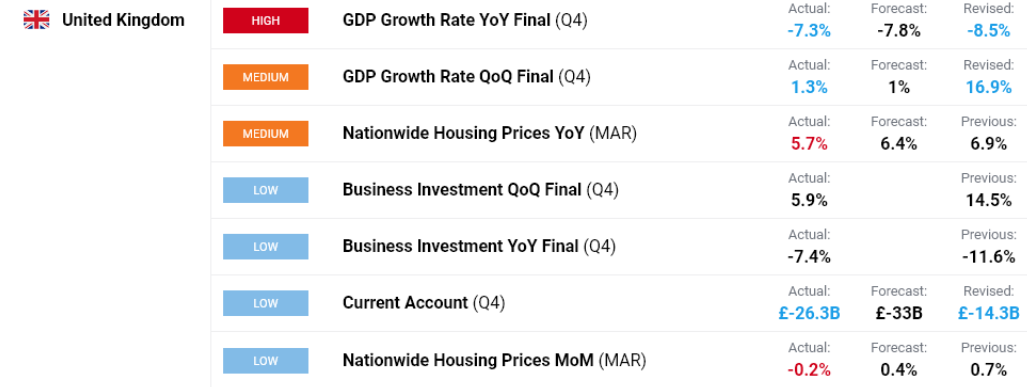
Looking at the GDP data in more detail, the statistics showed the UK economy shrank by 7.3% year/year in Q4 rather than the 7.8% predicted. The quarter/quarter expansion was revised higher too.
Source: DailyFX
Discover what kind of forex trader you are

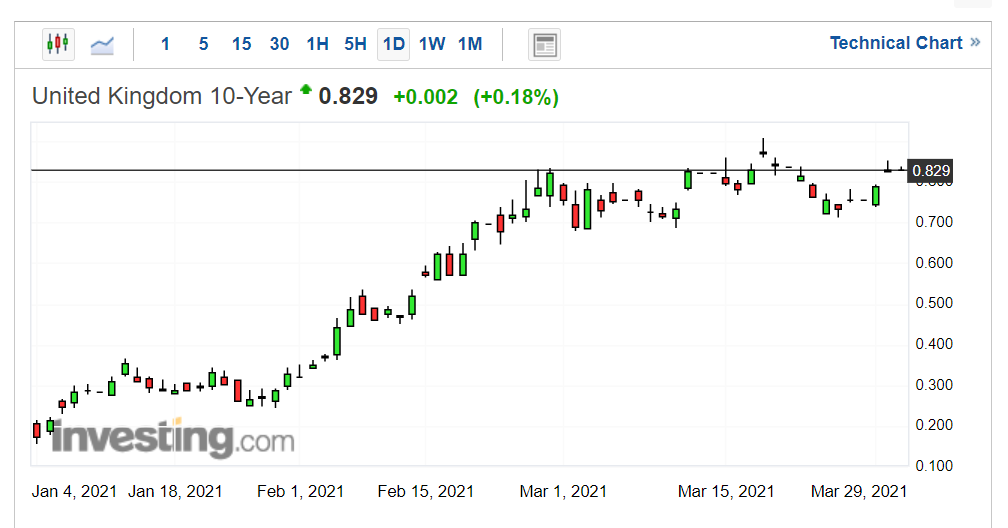
In addition, UK Gilt yields continue to advance and similarly it is significant that GBP/USD is not strengthening in response, also suggesting possible weakness in the next few days.
Source: Investing.com
| Change in | Longs | Shorts | OI |
| Daily | 2% | 8% | 5% |
| Weekly | -11% | 28% | 5% |
You can find out here how to trade after a news release
— Written by Martin Essex, Analyst
Feel free to contact me on Twitter @MartinSEssex
Be the first to comment