

GBP/USD is attempting a recovery wave from the 1.3280 zone. USD/CAD is rising and is showing positive signs above the 1.2700 support.
Important Takeaways for GBP/USD and USD/CAD
· The British Pound found support near 1.3280 and started an upside correction.
· There was a break above a key bearish trend line with resistance near 1.3330 on the hourly chart of GBP/USD.
· USD/CAD started a major increase above the 1.2650 and 1.2700 resistance levels.
· There is a crucial rising channel forming with support near 1.2685 on the hourly chart.
GBP/USD Technical Analysis
After a major decline, the British Pound found support above 1.3250 against the US Dollar. GBP/USD traded as low as 1.3278 on FXOpen and recently started an upside correction.
The pair broke the 1.3320 resistance to move into a short-term positive zone. There was a break above the 23.6% Fib retracement level of the downward move from the 1.3512 swing high to 1.3278 low. Besides, there a break above a key bearish trend line with resistance near 1.3330 on the hourly chart of GBP/USD.
It is now trading above the 1.3330 level and the 50 hourly simple moving average. An immediate resistance is near the 1.3370 level.
The first major resistance is near the 1.3400 level. It is near the 50% Fib retracement level of the downward move from the 1.3512 swing high to 1.3278 low. If there is an upside break above the 1.3400 zone, the pair could rise towards 1.3500.
The next key resistance could be 1.3550, above which the pair could gain strength. On the downside, the first key support is near the 1.3320 area.
If there is a break below 1.3320, the pair could decline extend its decline. The next key support is near the 1.3280 level. Any more losses might call for a test of the 1.3200 support.
USD/CAD Technical Analysis
The US Dollar started a major increase from the 1.2550 zone against the Canadian Dollar. USD/CAD gained pace for a move above the 1.2600 and 1.2650 resistance levels.
The pair even settled above 1.2700 and the 50 hourly simple moving average. The pair even climbed above the 1.2750 level and traded close to 1.2800. A high is formed near 1.2799 and the pair is now correcting lower.
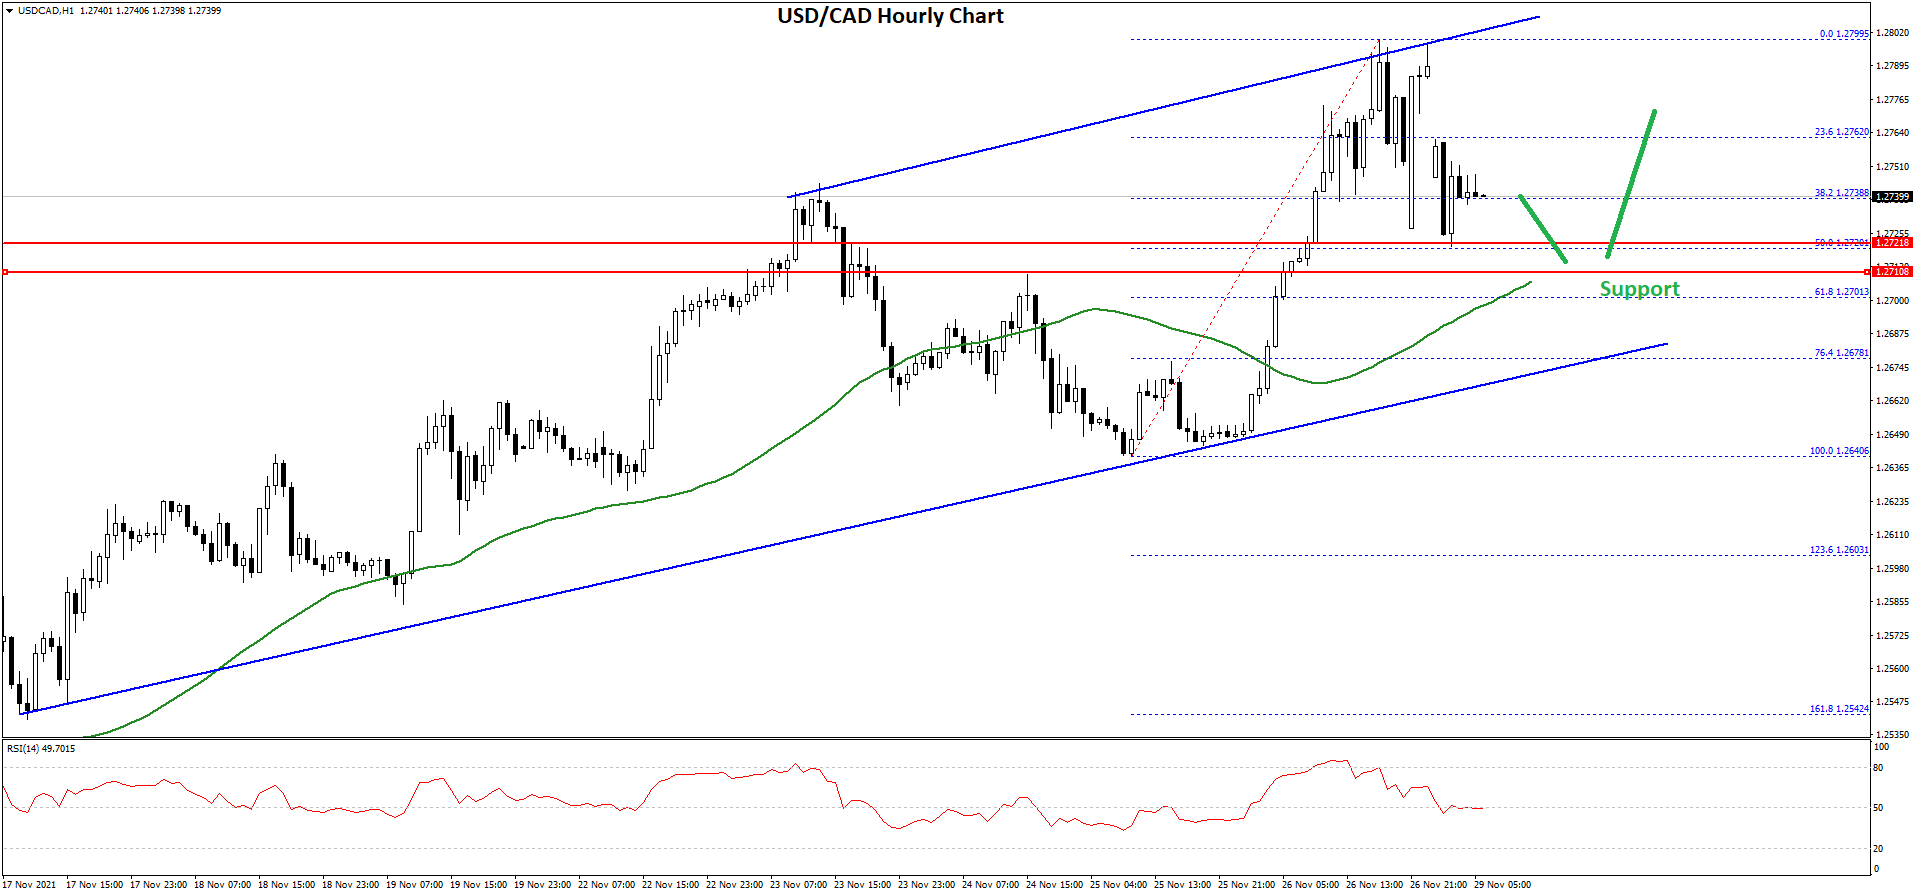
There was a break below the 23.6% Fib retracement level of the upward move from the 1.2640 swing low to 1.2799 high.
An initial support on the downside is near the 1.2725 level. The first major support is near the 1.2700 level. There is also a crucial rising channel forming with support near 1.2685 on the hourly chart. It is close to the 50% Fib retracement level of the upward move from the 1.2640 swing low to 1.2799 high.
The next major support is near the 1.2680 level. Any more losses may possibly open the doors for a drop towards the 1.2620 support.
An immediate hurdle on the upside is near the 1.2765 level. The next major resistance is near the 1.2800 level. A clear break above the 1.2800 level could open the doors for more gains. The next major resistance is near the 1.2950 level. Any more gains could lead the pair towards the 1.3000 zone.
This forecast represents FXOpen Markets Limited opinion only, it should not be construed as an offer, invitation or recommendation in respect to FXOpen Markets Limited products and services or as financial advice.

Be the first to comment