

GBP/USD is gaining pace above the 1.1500 resistance zone. USD/CAD is recovering and might rally if it clears the 1.3635 resistance zone.
Important Takeaways for GBP/USD and USD/CAD
· The British Pound was able to move above the 1.1420 and 1.1500 resistance levels.
· There is a key contracting triangle forming with resistance near 1.1615 on the hourly chart of GBP/USD.
· USD/CAD tested the 1.3500 zone and started a recovery wave.
· There is a major bearish trend line forming with resistance at 1.3625 on the hourly chart.
GBP/USD Technical Analysis
After forming a base above the 1.1200, the British Pound started a steady recovery wave against the US Dollar. GBP/USD gained pace for a move above the 1.1320 and 1.1420 resistance levels.
There was a move above the 1.1500 resistance and the 50 hourly simple moving average. The pair even moved above the 1.1600 level and traded as high as 1.1645 on FXOpen. It is now consolidating gains above the 1.1600 zone.
Recently, there was a move below the 1.1600 and 1.1580 support levels. The pair declined below the 23.6% Fib retracement level of the upward move from the 1.1259 swing low to 1.1645 high.
It is now trading above the 1.1600 level and the 50 hourly simple moving average. An immediate resistance is near the 1.1615 level. There is also a key contracting triangle forming with resistance near 1.1615 on the hourly chart of GBP/USD.
The next resistance is near the 1.1650 level. The main resistance is near the 1.1700 level. If there is an upside break above the 1.1700 zone, the pair could rise towards 1.1880. The next key resistance could be 1.2000, above which the pair could gain strength.
On the downside, an initial support is near the 1.1550 area. The next major support is near the 1.1450 level. It is near the 50% Fib retracement level of the upward move from the 1.1259 swing low to 1.1645 high.
If there is a break below 1.1450, the pair could extend its decline. The next key support is near the 1.1322 level. Any more losses might call for a test of the 1.1250 support.
USD/CAD Technical Analysis
The US Dollar started a fresh decline from well above the 1.3800 zone against the Canadian Dollar. USD/CAD declined below the 1.3700 and 1.3600 levels.
It even spiked below the 1.3500 level and traded as low as 1.3495. Recently, it started a recovery wave above the 1.1540 level. The pair even climbed above the 1.3575 level and the 50 hourly simple moving average.
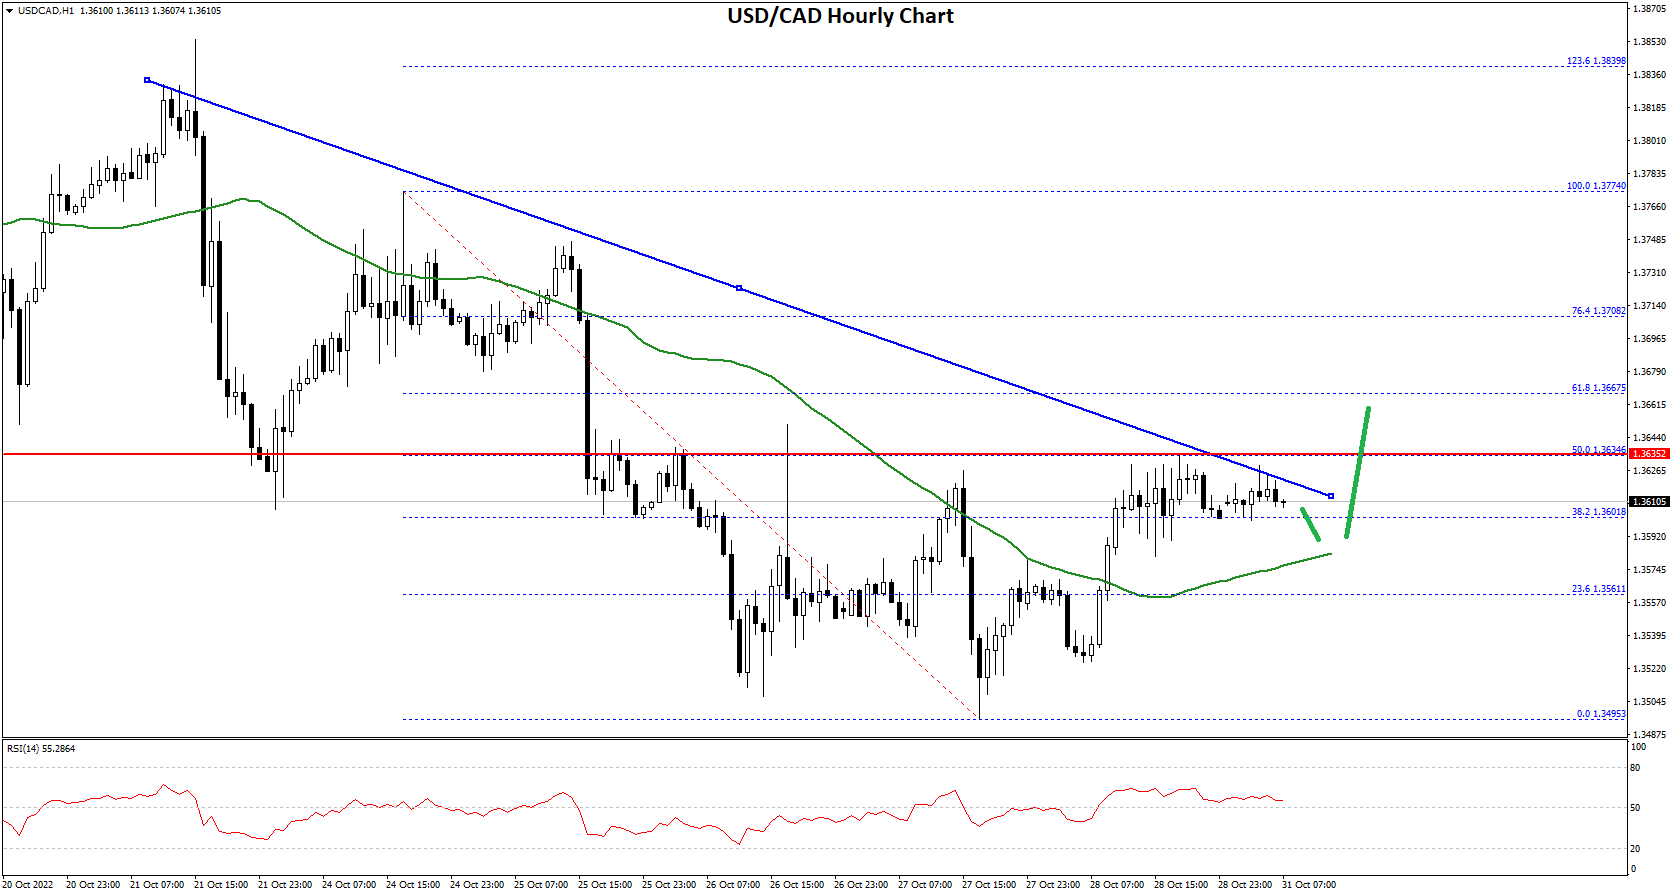
There was a move above the 38% Fib retracement level of the downward move from the 1.3774 swing high to 1.3495 low. It is now facing resistance near the 1.3620 zone.
There is also a major bearish trend line forming with resistance at 1.3625 on the hourly chart. The 50% Fib retracement level of the downward move from the 1.3774 swing high to 1.3495 low is just above the trend line resistance.
The next major resistance is near the 1.3665 level. A clear break above the 1.3665 level could open the doors for more gains. The next major resistance is near the 1.3770 level, above which USD/CAD could rise steadily towards the main 1.3900 resistance zone.
An immediate support is near the 1.3580 level. The first major support is near the 1.3500 level. Any more losses may possibly open the doors for a drop towards the 1.3380 support zone in the near term.
This forecast represents FXOpen Companies opinion only, it should not be construed as an offer, invitation or recommendation in respect to FXOpen Companies products and services or as financial advice.
Trade global forex with the best ECN broker of 2021*.
Choose from 50+ forex markets 24/5.
Open your FXOpen account now or learn more about making your money go further with FXOpen.
* FXOpen International, best ECN broker of 2021, according to the IAFT

Be the first to comment