


Make sure to consider expense ratios when you’re adding it all up.
LordHenriVoton
Gabelli Dividend & Income Trust (NYSE:GDV.PK) is a closed-end fund (CEF) with an objective “to seek a high level of total return with an emphasis on dividends and income.” As the name implies, it is one of the Gabelli Funds run by GAMCO Asset Management where you can have famed value investor Mario Gabelli as your portfolio manager. Mr. Gabelli shares the alma mater of the Columbia Business School with Warren Buffett and is an advocate of the classical Benjamin Graham and David Dodd value investing style.
The stock currently trades at $18.88 with a net asset value (NAV) $22.64 as of October 6th, a -16.6% discount. Data from CEFConnect suggests this is slightly above the five-year average discount of -9.85%.
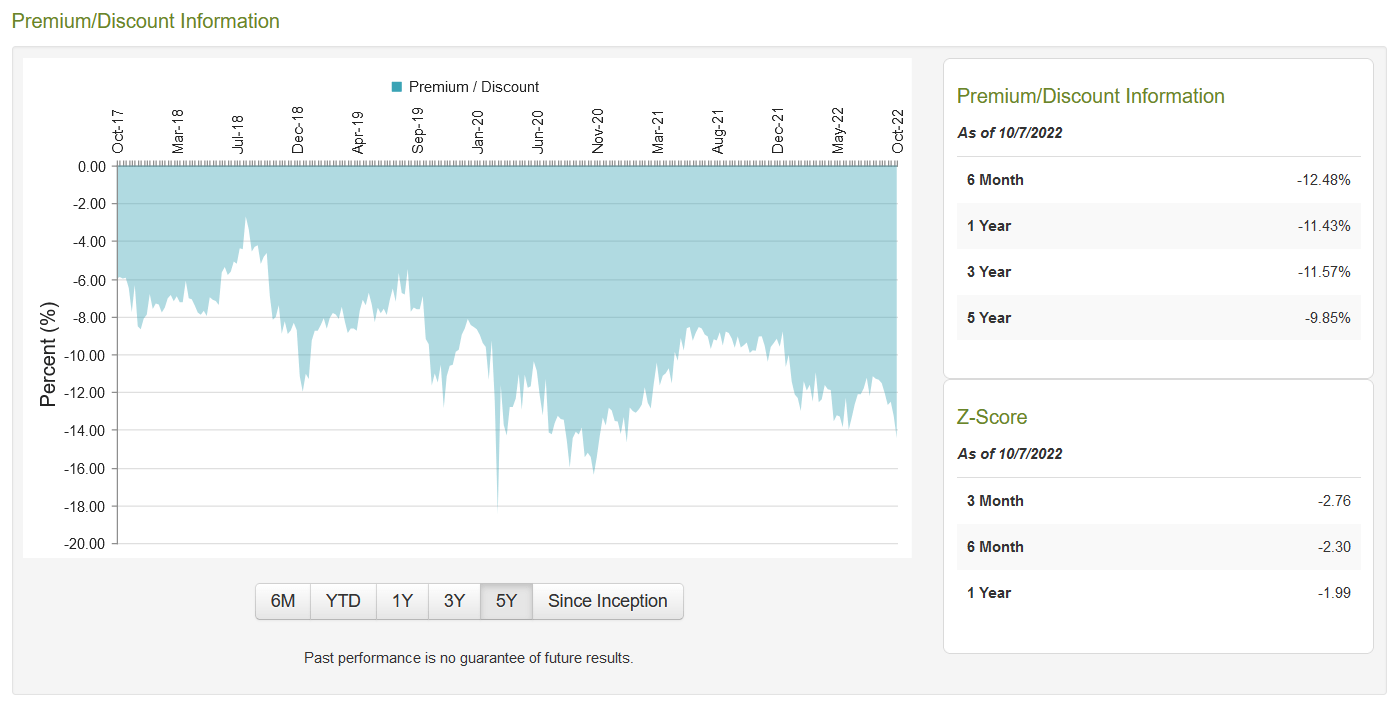
CEF Connect: GDV Premium/Discount Information
If we look at performance data provided from their September 2022 certified shareholder report we can see that the funds have under-performed relative to the S&P 500 Index by 2.01% since inception. In fact the total investment return for GDV has under-performed in every time period versus the S&P 500.
|
Six Months |
1 Year |
5 year |
10 year |
15 year |
Since Inception (11/28/03) |
|
|
NAV Total Return |
-19.42% |
-14.76% |
6.07% |
9.27% |
5.91% |
7.53% |
|
Investment Total Return |
-22.05 |
-17.82 |
5 |
9.84 |
6.56 |
7.25 |
|
S&P 500 Index |
-19.96 |
-10.62 |
11.31 |
12.96 |
8.54 |
9.26 |
|
Dow Jones Industrial Average |
-14.46 |
-9.09 |
10 |
11.68 |
8.35 |
8.99 |
In that context, a discount to NAV perhaps makes sense given one could generate better returns simply by investing in an S&P 500 indexed ETF. When we consider that GDV has an expense ratio of 1.3% then we get even more of a picture of the extra costs that a CEF bears versus a passive-indexed ETF. For instance, SPY only has an expense ratio of 0.09%. To put that another way, the cost of SPY’s returns are 93% less than the cost of GDV’s worse performance.
A Seeking Alpha article from 2012 reviewed data for 566 CEFs and found that expense ratios didn’t seem to be tied to performance or size. Instead, the expense ratio amongst CEFs seems to come simply from comparison of peers, or as the author puts it “Give Me Your Watch and I’ll Tell You The Time.” In terms of our review of GDV this data suggests that it pays to be skeptical of high expense ratios as ultimately “the only thing that a CEF’s expense ratio predicts is how much the investment manager is being paid.”
Let’s consider Russel Kinnel’s work for a moment to help contextualize this further. Kinnel is a researcher and writer over at Morningstar and back in 2010 he published an article highlighting just how important expense ratios are when evaluating different funds. This article was backed by a review of data from 2005-2010 which found that “in every single time period and data point tested, low-cost funds beat high-cost funds.”
What was notable about the article was that Kinnel was comparing the expense ratio indicator against Morningstar’s own star indicator system. Their review of the data suggested that expense ratios are a better predictor of fund success than their own system.
Five years later, Mr. Kinnel followed his work up with a review of data from 2010-2015. From this data he showed that the cheapest funds had a 62% total-return success rate; the most expensive funds only had a 20% success rate.
It’s important to note that this research and data is focused on open-ended funds as opposed to closed-end. Yet, as mentioned in the 2012 article above, expense ratios for closed end funds seem to have no economical grounding. That would make them even more susceptible to being indiscriminately expensive versus an indexed ETF.
So with all that said, I think from a long-term buy-and-hold perspective that owners of GDV would be likely better served simply rotating their holdings into a lower expense ratio vehicle. The recommendation at this point is based on underperformance of GDV compared to the S&P 500 and GDV’s high expense ratio compared to an indexed ETF.
Let’s take a moment to turn to their portfolio directly though to see if there is anything of particular note there.
Gabelli Dividend and Income Trust Portfolio
Here is a table of the fund’s top ten positions as of September 29th, 2022:
|
SWEDISH MATCH AB |
3.10% |
|
MASTERCARD INC |
2.00% |
|
MICROSOFT CORP |
1.90% |
|
ALPHABET INC |
1.80% |
|
AMERICAN EXPRESS CO |
1.70% |
|
GENUINE PARTS CO |
1.50% |
|
JPMORGAN CHASE & CO |
1.50% |
|
SONY GROUP CORP |
1.40% |
|
HONEYWELL INTERNATIONAL INC |
1.40% |
|
MONDELEZ INTERNATIONAL INC |
1.30% |
|
% of total assets |
17.60% |
Most of these names are likely familiar to people. A few notably are not like their largest position, Swedish Match (OTCPK:SWMAF). It’s a Swedish tobacco company which Gabelli held in the fund prior to Philip Morris announcing a takeover for $16.1b back in May 2022. But activist investor Elliott Management has built a greater than 5% stake in Swedish Match and opposes the merger.
Fellow Seeking Alpha contributor Librarian Capital recently wrote about the situation overall. Their thesis is that Swedish Match is undervalued by the Philip Morris bid, but a higher one is unlikely. Further, Philip Morris may even walk away entirely which could cause the stock to decline as those involved from the arbitrage side abandon the trade.
Notably, the author highlights that the bid required 90% shareholder approval and Elliott seems to have assembled a 10% cadre of owners who oppose it. The result of this opposition will force action one way or the other in the near future which could materially impact the fund’s performance given the relatively high 3.10% allocation.
If we zoom out a bit we can look at the portfolio overall:
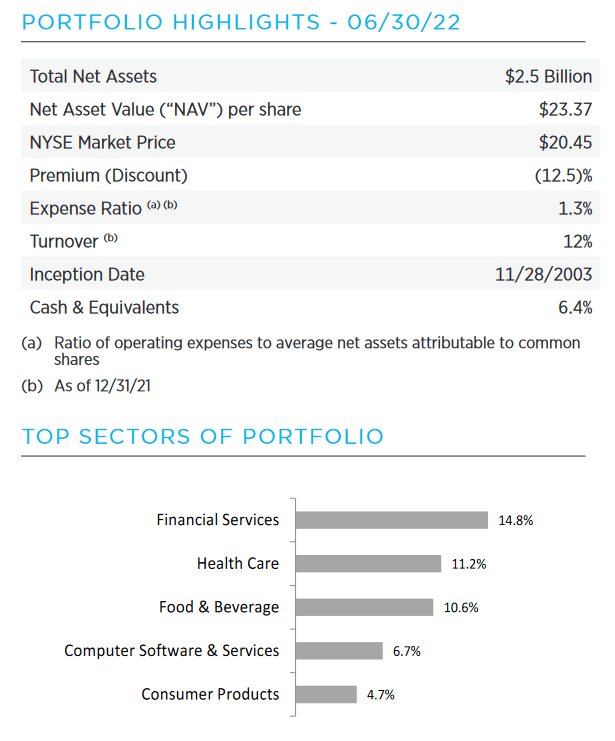
GDV Q2’22 Fact Sheet: Portfolio Highlights
The fund has seen only 12% turnover this year. It’s also nearly fully invested, but does have 6.4% in cash and cash equivalents. This equaled $136.757m from their last report and $103.330m is in foreign currency. The common stock dividend is currently at $1.32 per share which translates to $119.16m annually as an expense. Their cash position then could theoretically cover that. Of note though is that depending on which foreign currency, the strength of the US dollar may be adversely affecting its value.
We can see that overall their portfolio is concentrated in Financial Services (14.8%), Health Care (11.2%), and Food & Beverage (10.6%). Each of these sectors could have an argument made for them as being good recessionary environment picks.
Upon review of the portfolio nothing stood out in particular to me that would suggest unique out performance. It does not seem that the 6.99% dividend yield is at risk in the near-to-mid term as their cash position is sizable. Additionally it seems they could sell out of their Swedish Match position anytime in the near term and realize a sizable gain.
The Gabelli Dividend and Income Trust Preferred Shares
Beyond the common equity slice of the capital stack are two tradable preferred shares: GDV.PK and NYSE:GDV.PH, both have par value of $25.00. Here’s a table with some high level data.
|
Current Price |
Dividend Yield |
Shares Outstanding |
Issue Date |
1st Call Date |
|
|
GDV.PH |
$24.08 |
5.58% |
2,000,000 |
6/5/2019 |
6/7/2024 |
|
GDV.PK |
$19.01 |
5.59% |
6,000,000 |
10/4/2021 |
10/7/2026 |
For income investors who are invested in GDV common stock who remain interested in the fund, it may pay to put these on your watchlist as well. The dividend yield is slightly lower but you are granted a more secure ownership slice. The dividends are cumulative and paid out quarterly.
Something of note is that if the fund continues their near twenty-year pattern of NAV growth then both preferred shares are likely worth par value and will be called. The K preferred shares were actually issued as financing to retire a previous G preferred share. And in the past the fund has retired two other series of preferred shares.
So there is a history of preferreds being retired at par value over the long term. GDV.PK has more capital appreciation potential in the event of an eventual call – though we must factor in that the first call date isn’t for another four years. If we assume eventual call at par of the preferred, then at some points the total return proposition may rival the commons.
The board has authorized repurchases of GDV.PH at prices below $25.00 on the market. As far as filings go they have not repurchased any this year though. Management also has an open common stock repurchase program anytime the NAV discount is -7.5% or more. During the first six months of this year they retired 130,793 shares which is less than 1% of shares outstanding.
In Conclusion
Based on my review of the Gabelli Dividend and Income Trust I’d argue that most would be served better with a lower expense index based ETF as a long term holding. There just doesn’t seem to be anything differentiated enough about the fund to justify its high expense ratio. And research data suggests that the higher the expense ratio, the lower chance of total return success.
From a trading perspective there may be a near-term opportunity given the fund is trading at a 68% greater NAV discount than normal. And with a long term history of NAV growth then this may be a good time to enter a position in the fund if you are still interested. For those that are, I’d offer that they may benefit from keeping the two preferred shares in mind as well as they offer stable dividends as well and a more secure position in the capital stack.
But again, ultimately, my best advice here is just to buy an indexed ETF and don’t let expenses eat into your long term returns. This CEF may be a speculative vehicle to trade around, but long-term total return results seem likely to continue to lag the S&P 500.
Be the first to comment