

Baris-Ozer
That sounds like a contradictive title, and it is. A weak economy compared to that of another country should drive a currency lower. Yet the yen has been in a continuous bull trend against the US dollar since it reached its recent low at 151.944 on October 21, 2022.
So, will this bull trend for the yen continue? Or will the Japanese currency revert to its long-term bear trend? Yet this could still be a good time to go long on Invesco CurrencyShares Japanese Yen Trust ETF (NYSEARCA:FXY) and capture the yen rally if it continues. Let’s investigate further the factors that are driving the reversal and the trend for yen appreciation.
When we look at GDP expansion in Japan and the United States we can see how the US economy has outperformed the Japanese economy. The last data we have for GDP growth in Japan showed a decline of 0.2% quarter on quarter for Q3 2022.
While GDP growth for the same quarter in the US was a positive 3.2% For Q1 2023, the US showed an increase of 2.9% in GDP. And at the time of writing, expectations for the next figure for GDP growth for Q1 2023 in Japan stand at 0.5%.
That number for GDP in Japan would close the gap between the two economies. However, there is still a spread of 2.4% of GDP growth in the US’s favor. Hardly I would say, a sole reason for yen bullishness. So, it must be coming from somewhere else.
Interest Rates
Central bank interest rates are still negative, although the recent action by the BoJ to allow 10-year bond yields to have a wider range of 0.50% above or below zero, from the previous range of 0.25% above or below zero has helped the yen gather momentum.
Still, the spread for bond and treasury yields between the two countries is extremely wide and in favor of US securities.
Worldgovernmentbonds.com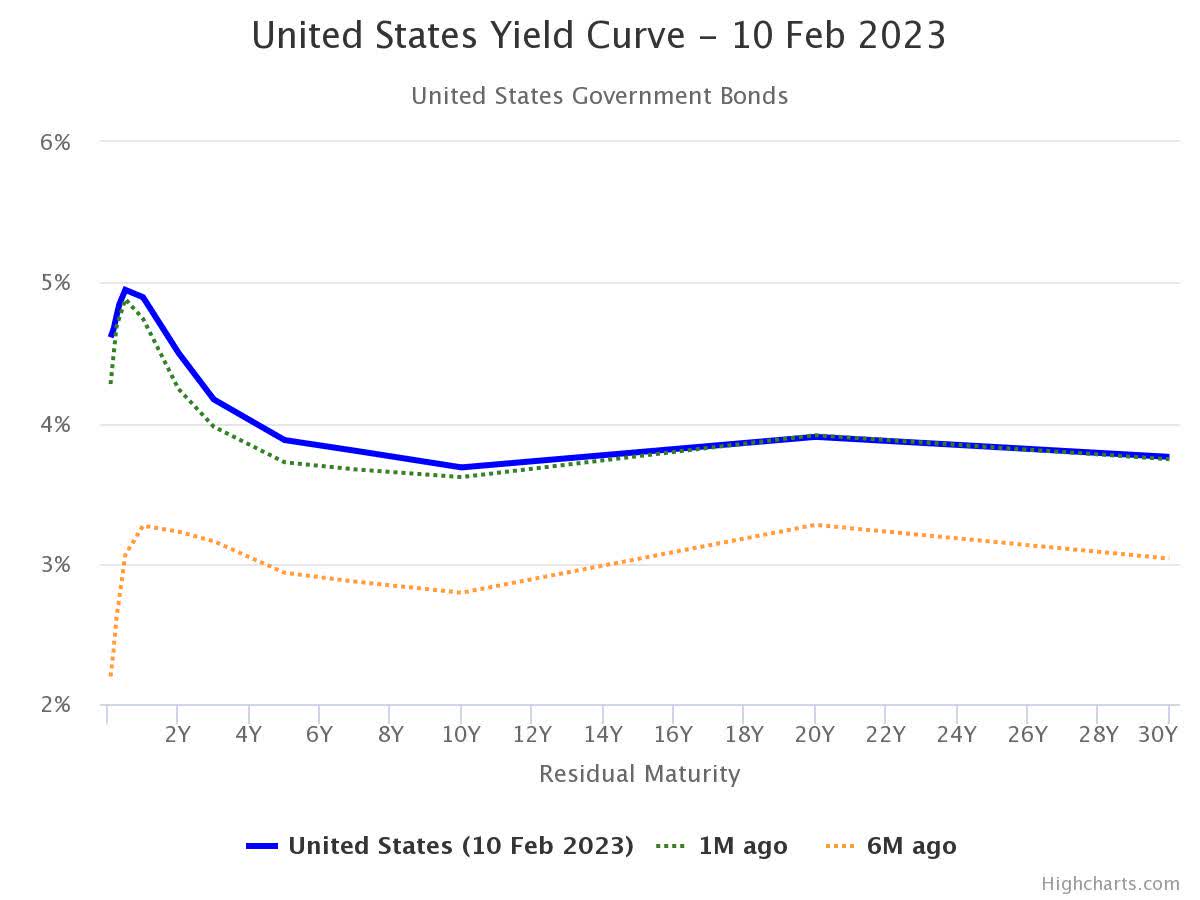
The chart above shows the United States yield curve from 1-month T-bills to 30-year bonds. The chart below shows the same curve for Japanese securities. We can see that the yield curve for the US is 5.044% higher than the Japanese yield curve for 6-month T-bills and 2.118% higher for 30-year bonds.
Worldgovernmentbonds.com
The sharp spread in government bond yields is a big factor in currency rates. However, despite the large positive skew for US assets, the FX market may have pushed this currency pair too far. What we may be seeing now is a retracement and consolidation to levels that are more appropriate with the fundamentals.
Purchasing Price Parity
This is a concept that tends to hold for many currency pairs of two countries with similar economies. Similar in the sense of how developed they are. Japan and the United States certainly sit in the league of the most developed countries.
So, in theory, the same products in both countries should cost about the same once the exchange rate is taken into account. However, differences may persist over time for various reasons. Yet it seems obvious to me that goods in one country should have similar prices in the other.
This metric tends to revert over long periods of time as other factors eventually bring purchasing price parity (PPP) into line. Also known as the Big Mac index, literally because the basket of goods used to determine the PPP index can be simplified by using the McDonald’s Big Mac as a proxy.
So looking at the average price of a Big Mac in the US and comparing it to the price of the same burger in Japan can give us an idea of how expensive the burger is in one country compared to the other.
Or, in other words, how overvalued one currency may be compared to the other when it comes down to buying fast food. The exchange rate for USDJPY given by the two prices below equals ¥87.04. That’s a far stretch for anyone, I believe, to seriously consider the possibility of USDJPY reaching that level anytime soon.
McDonald’s McDonald’s
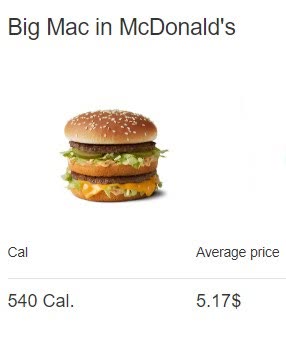
However, it does tell us the Big Mac is extremely expensive in the US for a Japanese buyer when the exchange rate is taken into account. The US Big Mac would cost ¥677 at the current exchange rate of 131.00.
While the Big Mac is extremely cheap for an American buyer that would purchase the burger for $3.44. This difference in prices indicates that the PPP is out of line and the dollar is overvalued when compared to the purchasing power of US dollars exchanged into yen.
Does this factor alone justify the last few months of bullish momentum in the yen, not at all. However, it does indicate that the PPP is out of line and should eventually revert to more neutral levels, even if parity is not achieved.
Technical View
The medium-term chart for USDJPY using monthly candles shows an ongoing bull trend which started back in January 2021, after touching a low of 102.59. However, the market has already printed a candle with a small body for January 2023.
This denotes sideways action, and the current candle, although it’s still early, may print something similar. For now, the Ichimoku system is showing a bullish trend is still intact. However, the first sign of weakness is coming from the RSI which pierced below 70, and its moving average, and looks like it may decline further.
TradingView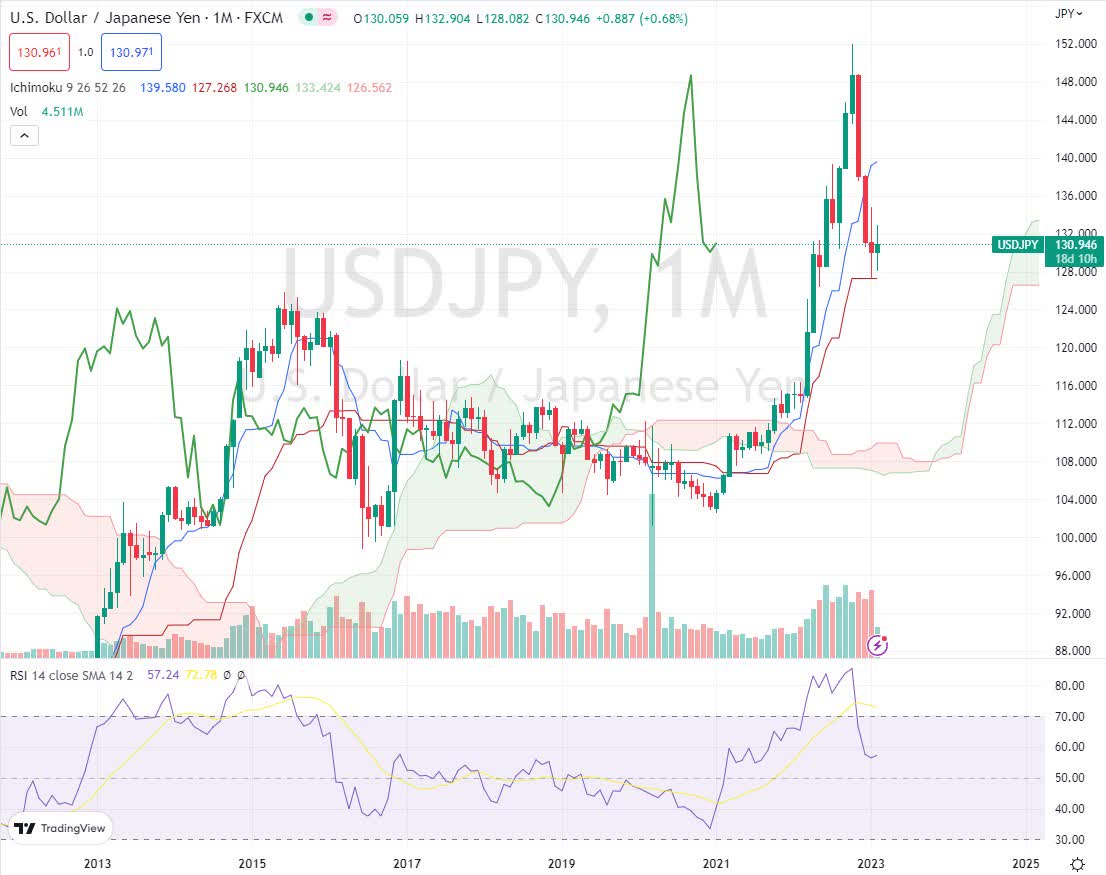
For the long-term bull trend of USDJPY to show signs of reversal would take several months. But it does look like the retracement from its high in October 2022 may continue to levels close or near to the cloud.
The medium-term chart below shows how the recent retracement in price has found support in the cloud over the past 4 weeks. The cloud acts as a support only when price moves away from the cloud after having touched or traded into it. Only then, do we know the support level was valid.
TradingView
For now, the market is still close to and almost in the cloud. We would need to see the next candles move away quickly from the cloud to indicate new bullish momentum for the US dollar. Another indication of momentum weakness comes from the RSI.
The RSI below its moving average and well below 50 indicates there may be more downward momentum on its way. The next level of support is on the lower side of the cloud around the 128 area.
TradingView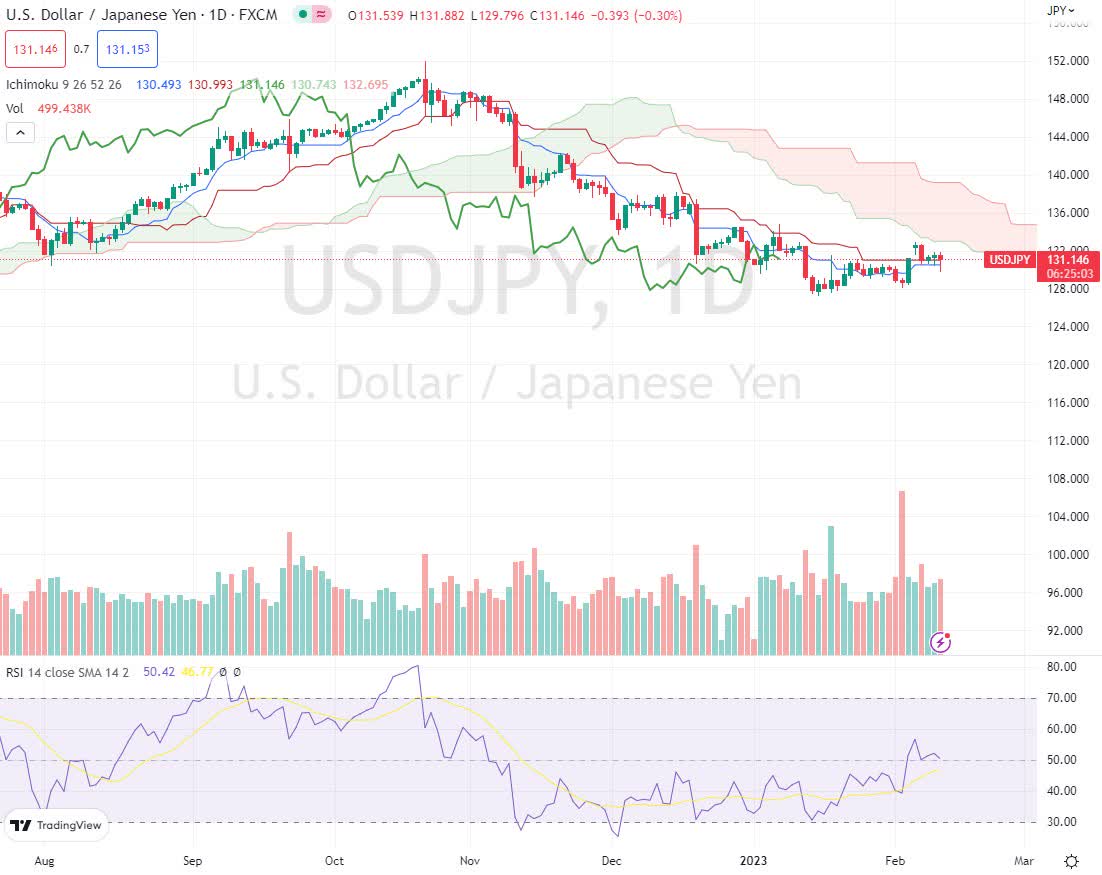
From the daily chart above, we can see a clear short-term bear trend with price action below the cloud. The moving averages are bearish, and the forward cloud is red completing the picture.
The RSI has just moved above 50 and its moving average which may lead to more upwards price action. However, the overall picture for the short term is bearish for USDJPY.
Central Banks
The next monetary policy meeting for the BoJ is March 9, while the next FOMC meeting isn’t till March 31. The BoJ isn’t expected to touch interest rates or take further action on the bond yield range.
However, I believe they may feel that they have done enough for now at their meeting in December 2022. From the day of that meeting, the yen has gained 4.2% from 136.91 to 131.20.
In their January meeting, they maintained the current stance on easing and also stated a willingness to continue guiding the yield curve. From the minutes of the January meeting, I find this point revealing:
“Given developments in economic activity and prices, it is appropriate for the Bank to continue with the current monetary easing, including the conduct of yield curve control.”
My understanding here is that going forward there will be further actions taken to allow bond yields to rise. Eventually, I presume they would also be obligated in turning the central bank interest rate to positive again.
The increase in the yield of domestic assets could have a dramatic effect on the USDJPY exchange rate. As more Japanese investors begin to find domestic securities more attractive as yields rise. This would create further downward pressure on the USDPY FX rate.
Conclusion
In my opinion, the yen is set to strengthen further as the BoJ is way behind the Fed in its monetary tightening policy. Not only, but the Fed will increase the Fed Fund target rate in smaller hikes and is expected to stop hiking by June 2023.
This creates a scissor effect in the interest rate differential and bond yield spreads. I would presume a large shift of capital back into the yen and away from the US dollar. Having said that, it doesn’t mean that the USDJPY is headed down in freefall.
I can expect the exchange rate to make some kind of recovery, however, in the medium term, I see the yen gaining ground again. I see FXY ETF as a medium to long-term buy, even though the timing might not be the best at the moment.
Be the first to comment