

Chesky_W/iStock via Getty Images
This ETF review series aims at evaluating products regarding the relative past performance of their strategies and metrics of their current portfolios. As holdings and weights change over time, updated reviews are posted when necessary.
FVD strategy and portfolio
The First Trust Value Line Dividend Index Fund (NYSEARCA:FVD) has been tracking the Value Line Dividend Index since 08/19/2003. FVD has 176 holdings, a 12-month distribution yield of 1.91% and a total expense ratio of 0.67%. It pays quarterly dividends.
As described on Value Line website, “The Value Line Safety Rank measures the total risk of a stock relative to the approximately 1,700 other stocks. It is derived from a stock’s Price Stability rank and from the Financial Strength rating of a company, both shown in the lower right hand corner of each page in Ratings & Reports. Safety ranks are also given on a scale from 1 (Safest) to 5 (Riskiest).”
To be eligible in FVD underlying index, companies must be listed in the U.S., have more than $ 1 billion in market capitalization, a higher dividend yield than the S&P 500 (SPY), and a Value Line Safety Rank of 1 or 2. Investment companies and limited partnerships are excluded from the universe. Holdings are rebalanced in equal weight every month.
FVD holds mostly U.S. based companies (86.5% of asset value). It also invests in Canada (7.3%), the U.K. (1.7%) and Switzerland (1.7%). Other countries are below 1%. The portfolio is balanced between large / mega-cap companies (about 52%), and small / mid-caps (about 48%).
The top sectors are utilities (22.1%), consumer staples (15.7%), industrials (13.3%) and financials (12.7%). Compared to the S&P 500, FVD overweights these four sectors, along with real estate and materials. It underweights technology, communication, consumer discretionary, healthcare and almost ignores energy.
Sector breakdown (chart: author; data: First Trust and SSGA)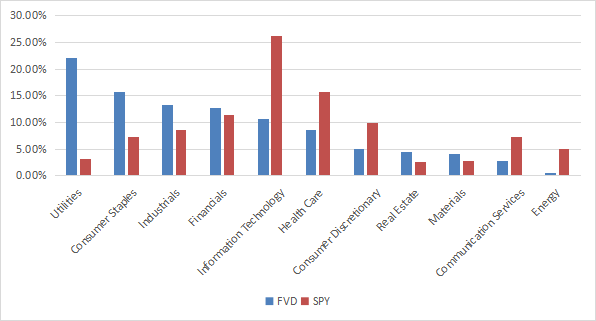
Constituents are frequently rebalanced in equal weight, but weights may drift with price action. The next table lists the top 10 holdings as of writing. None of them weights more than 0.67%, so risks related to individual stocks are very low.
|
Ticker |
Name |
Weight% |
EPS growth %TTM |
P/E TTM |
P/E fwd |
Yield% |
|
Cal-Maine Foods, Inc. |
0.67% |
7662.72 |
11.02 |
6.23 |
5.49 |
|
|
MAXIMUS, Inc. |
0.67% |
-29.53 |
21.66 |
26.65 |
1.57 |
|
|
Exelon Corp. |
0.63% |
26.65 |
19.43 |
18.60 |
3.21 |
|
|
Fidelity National Information Services, Inc. |
0.63% |
319.86 |
44.16 |
10.19 |
2.78 |
|
|
Avista Corp. |
0.62% |
-20.11 |
23.56 |
22.20 |
4.18 |
|
|
Campbell Soup Co. |
0.62% |
-16.26 |
21.39 |
18.77 |
2.63 |
|
|
Conagra Brands, Inc. |
0.61% |
-51.88 |
32.27 |
15.65 |
3.43 |
|
|
Evergy, Inc. |
0.61% |
-9.39 |
17.89 |
17.36 |
3.95 |
|
|
Pfizer Inc. |
0.61% |
54.14 |
9.88 |
7.92 |
3.20 |
|
|
Sanofi |
0.61% |
7.92 |
15.78 |
10.96 |
3.70 |
Past performance
Since inception in August 2003, FVD has underperformed SPY and the equal-weight S&P 500 (RSP) in total return and risk-adjusted return (Sharpe ratio). It shows a slightly lower risk measured in maximum drawdown and standard deviation of monthly returns (named “volatility” in the table below).
|
Total Return |
Annual.Return |
Drawdown |
Sharpe ratio |
Volatility |
|
|
FVD |
331.13% |
7.86% |
-52.05% |
0.55 |
13.55% |
|
SPY |
454.69% |
9.27% |
-55.42% |
0.6 |
14.95% |
|
RSP |
538.12% |
10.07% |
-59.90% |
0.58 |
17.22% |
FVD vs. SPY and RSP since inception (Portfolio123)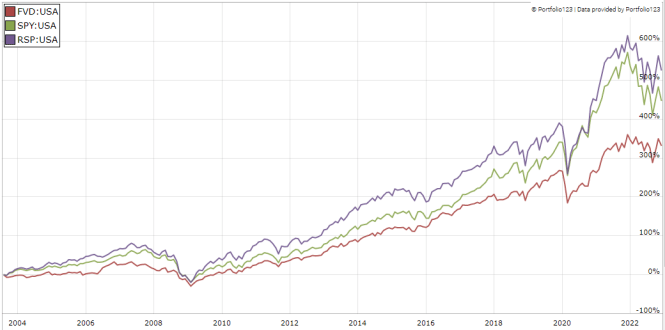
FVD has beaten SPY year-to-date (see next chart). Compared to other dividend ETFs with quality criteria, in 2022 it beats the Vanguard Dividend Appreciation Index Fund (VIG), it is almost tie with the WisdomTree U.S. Quality Dividend Growth Fund (DGRW), and it is shortly behind the Schwab U.S. Dividend Equity ETF (SCHD).
FVD vs. SPY and competitors in 2022 (Portfolio123)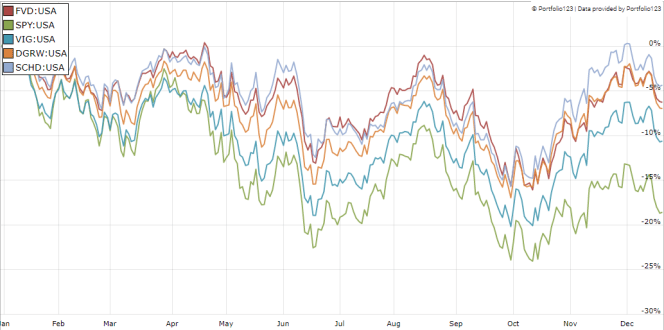
In previous articles, I have shown how three factors may help cut the risk in a dividend portfolio: Return on Assets, Piotroski F-score, and Altman Z-score.
The next table compares FVD with a subset of the S&P 500: stocks with an above-average dividend yield, an above-average ROA, a good Altman Z-score, a good Piotroski F-score and a sustainable payout ratio. The subset is rebalanced annually to make it comparable with a passive index.
|
Total Return |
Annual.Return |
Drawdown |
Sharpe ratio |
Volatility |
|
|
FVD |
331.13% |
7.86% |
-52.05% |
0.55 |
13.55% |
|
Dividend & quality subset |
853.43% |
12.38% |
-43.59% |
0.81 |
14.64% |
Past performance is not a guarantee of future returns. Data Source: Portfolio123
FVD underperforms the dividend quality subset by 4.5 percentage points in annualized return. However, ETF performance is real and the subset simulation is hypothetical. My core portfolio holds 14 stocks selected in this subset (more info at the end of this post).
Scanning FVD portfolio
FVD is slightly cheaper than SPY regarding aggregate valuation ratios (see next table).
|
FVD |
SPY |
|
|
Price/Earnings TTM |
19.11 |
20.15 |
|
Price/Book |
2.65 |
3.82 |
|
Price/Sales |
1.99 |
2.4 |
|
Price/Cash Flow |
14.45 |
15.04 |
I have scanned holdings with the quality metrics described in the previous paragraph. I consider that risky stocks are companies with at least 2 red flags among: bad Piotroski score, negative ROA, unsustainable payout ratio, bad or dubious Altman Z-score, excluding financials and real estate where these metrics are less relevant. With these assumptions, 21 stocks out of 176 are risky and they weigh about 12% of asset value, which is acceptable.
Based on my calculation, the aggregate return on assets, Altman Z-score and Piotroski F-score are a bit below the S&P 500 values. These metrics point to a portfolio quality slightly inferior to the benchmark.
|
FVD |
SPY |
|
|
Atman Z-score |
2.92 |
3.44 |
|
Piotroski F-score |
5.55 |
5.72 |
|
ROA % TTM |
7.03 |
7.84 |
Takeaway
FVD implements a dividend strategy with a quality filter and an equal-weight methodology. Constituents are screened with a safety ranking system based on technical and fundamental factors. The heaviest sectors in the portfolio are utilities, consumer staples, industrials and financials. The sector breakdown and the equal-weight rebalancing result in a better diversification than in the S&P 500. Aggregate valuation metrics are a bit better than the benchmark, and quality is a bit lower. Performance since inception is disappointing: FVD has lagged SPY by 1.4 percentage point in annualized return. However, it shows a slightly lower risk in drawdown and volatility. It means the Value Line Safety Ranking may provide some downside protection in a bear market. It did this year: FVD has outperformed SPY in 2022. For transparency, a dividend-oriented part of my equity investments is split between a passive ETF allocation (FVD is not part of it) and my actively managed Stability portfolio (14 stocks), disclosed and updated in Quantitative Risk & Value.
Editor’s Note: This article discusses one or more securities that do not trade on a major U.S. exchange. Please be aware of the risks associated with these stocks.
Be the first to comment