

shutter_m
This article will be divided into three sections: Fundamentals, Technicals, and Tactics. In the section on tactics, it will explore a simple structure of partial covered calls with SPXL, a leveraged S&P ETF, to show how options protection can enable large gains with relative safety. And since some like to keep it simple, we’ll also look at how a simple SPY investment would have produced gains in this miserable 2022 market.
Fundamentals
The first thing to understand is that despite the spin, a strong jobs market at the start of a recession is not, and has never been, a reason to believe the economy is healthy. In the next graph, recessions are shaded in grey and the unemployment rate is the line. Without exception, unemployment lags the start of each recession. This one will be no exception.
Unemployment lags recession (US Bureau of Labor Statistics)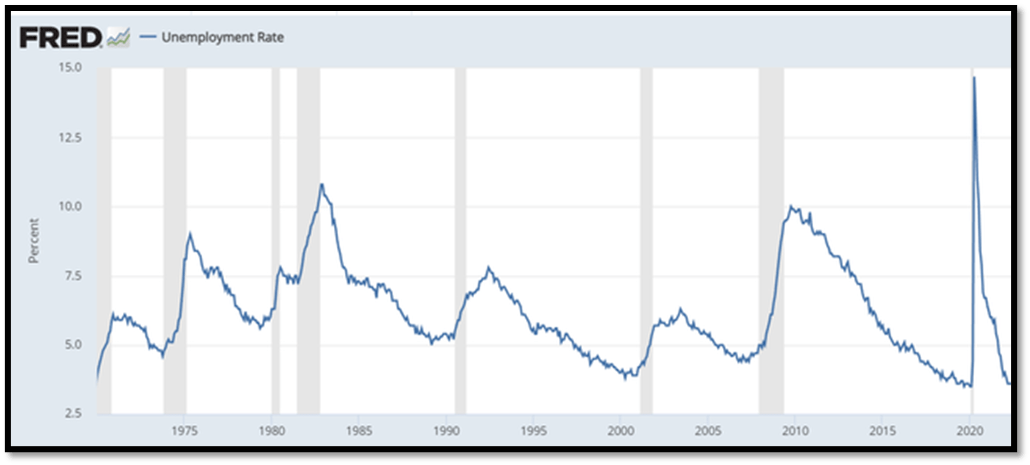
I’ve been around this stuff for a long time and recessions have always been measured as declines in GDP; that’s why they’re called recessions. The National Bureau of Economic Research will ultimately decide to label it, but that delay just provides temporary cover for political spin. If you want to see historical details from NEBR, this link will provide it.
For me, one of the saddest things is watching J. Powell, who should be independent, adopt the language of the political class. After spending years fueling the worst inflation since 1980, he’s now trying to behave like Paul Voelker, except he doesn’t seem up to it. His talk of a soft landing is nonsense, and in his last presser this quote caught my attention: “Russia’s war on Ukraine has boosted prices for gasoline and food” (page 2 of the transcript). Spinning the causes of the inflation surge after he and his predecessor monetized ballooning US debt for years does not inspire confidence.
So, this is one likely scenario, in broad terms, for how the economy and markets plays out from here.
- We’re in a recession. We’ve had two downward GDP quarters, a seriously inverted yield curve, and commodity prices are beginning to crash despite continued supply issues. Houses are no longer selling at competing bids over asking prices, and some other silly premiums are collapsing. (A new Corvette was worth $25k+ over MSRP until just recently.)
- I do not expect the Fed to back off from its inflation fight until the beast is slain. The good news is that by inducing a recession the inflation battle will be won, maybe by Q2 of 2023 as the downturn grows in severity. By then, the quantitative tightening will have extracted much liquidity, and hiked rates might just reach equilibrium with easing inflation somewhere in the mid-single digit region.
Markets anticipate fundamentals by about 6 months. I don’t think this rally signals a market bottom, but I’m also aware that fundamental factors, while providing context, are a terrible market-timing tool. And that brings me to technicals.
Technicals
Investopedia defines technical analysis, in part, as “analyzing statistical trends gathered from trading activity, such as price movement and volume.” I’ve never been a big fan of charting, but I’ve found that implied volatility (“IV”) of options, and changing trends in implied volatility, are excellent indicators of coming market risk. Fortunately, VIX, and the VIX futures (VX) term structure are available to provide real insights into how implied volatility is expected to evolve in the future. VIX is an index reflecting the implied volatility of S&P options directly; VX or VIX futures reflect the market perception of future implied volatility.
It might be worth connecting a few dots. Volatility and risk are synonymous, but by itself, observed volatility is non-directional. In other words, a high observed volatility means prices swing widely, but it does not necessarily indicate prices will fall. But implied volatility indicates that options are trading at a premium, and options are deployed with a hedging bias. If you question that, look at how IVs grow as strike prices progress downward. This table from Fidelity shows how implied volatility grows substantially with lower strikes for Jan-23 options, both calls and puts. Among 20 strikes, the high-end exhibits 17% IVs and the bottom 26% IVs.
Implied Volatility Skew (Fidelity)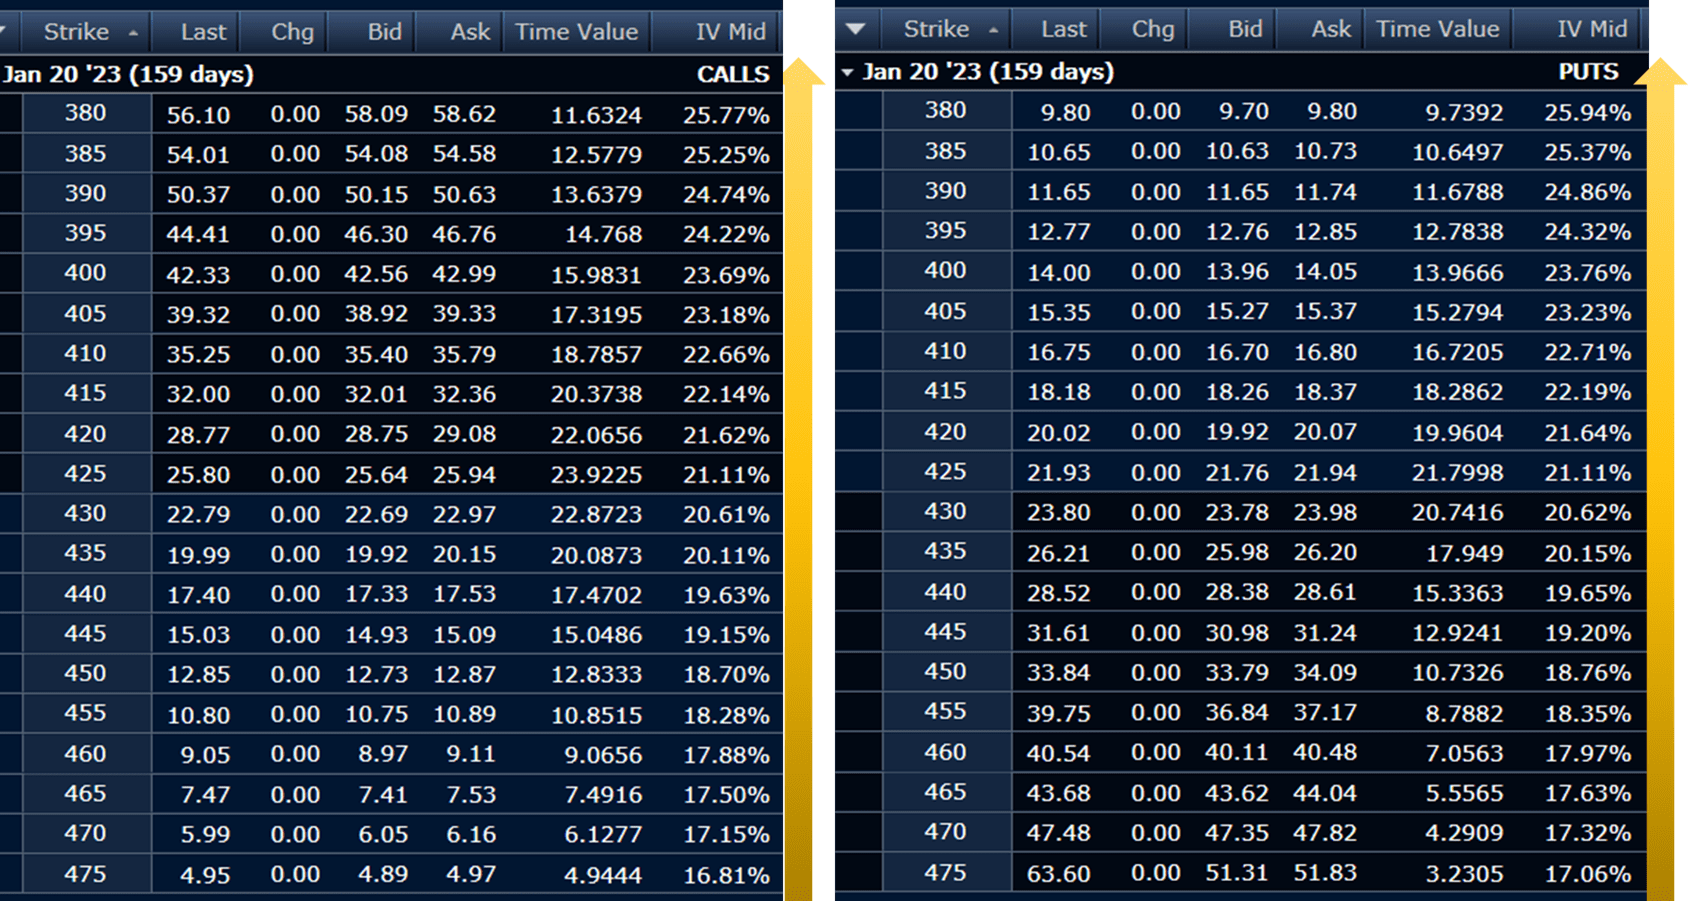
The IV-skew phenomenon dates back to the flash crash of 1987 when traders began bidding up deeper strikes, paying more for protection against negative surprises. That skew continues today.
So, when implied volatility rises, it signals a perception of coming price declines, or perhaps declines have already begun stoking greater fear; that’s why VIX rises when markets are stressed. But to exploit any predictive value, we need a window on the future and that’s why the VIX futures curve is so important. This is the VIX futures curve as it evolved since early August. As the futures quote for the first contract month (prompt month) falls, it signals a lowering of imminent risk perceptions; when it rises, higher risk perceptions. But are risk levels sufficient to warrant a buy or a sell?
VIX term Structure, Recent Changes (Barchart.com)
To answer that question, it is necessary to put the changes in a historical context. By measuring the shape of the curve and how it changes over multiple look-back periods, and then comparing that data to historical market inflection points, it is possible to identify periods when fear is an appropriate response, quantitatively and statistically, not just emotionally.
This next graph shows three metrics used in the model governing recent buy and sell signals at EZV Algorithms; they indicate how the shape of the curve (SHAPE) changed along with two different slope readings.
SHAPE & Slope Metrics (EZV Algorithms; Data Sources: Fidelity, CBOE, Barchart.com)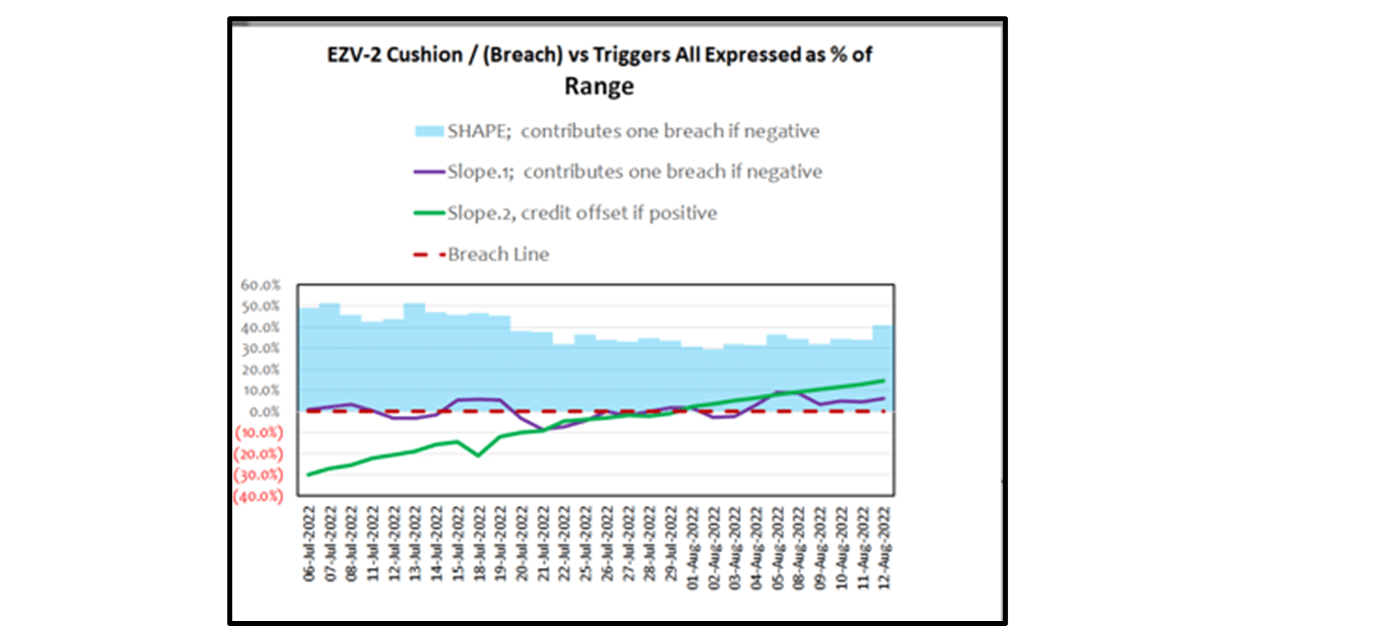
I won’t go into detail, but the term structure (“SHAPE”) has been contango, i.e., early months discounted vs. later months, and that’s a positive. The Slope metrics have been improving gradually and the longer-period Slope.2 has been improving steadily.
As the slopes exceeded breach levels on July 28th, a buy signal was generated. You can also see the prior sell signal when Slope.1 breached in mid-July. Using this signal methodology produced good YTD results, particularly in a turbulent bearish market.
YTD Performance (EZV Algorithms; Data Sources: Fidelity, CBOE, Barchart.com)
The first column of numbers is probably self-explanatory. It shows that SPY, if held this year, produced a (10.1%) loss while EZV.SPY, as governed by the signals, generated a 2.6% gain. Signals are composed of buy or sell using a variable commitment level on buy intervals.
The last two columns require explanation, and that brings us to tactics.
Tactics
Fundamentals are a poor timing device, but they provide a context which cannot be ignored. This section will be divided into Commitment Levels and Option-Protected Structures.
Commitment Levels
Before the 2022 market fell into correction territory or bear-market territory some things were obvious.
- In January EZV members were advised of Nasdaq vulnerability, including a chart of how growth stocks would be disproportionately affected by Fed rate hikes. It’s in the Appendix to this article.
- It makes no sense to remain 100% committed to any strategy when markets are so obviously fraught with risk. We’ve been varying buy-signal commitments in accordance with quantitative factors including volatility (observed and implied), market drawdowns, prices of QQQ growth vs. SPY indices, and market resilience measured as the comparative size of any rebound in S&P prices following a daily decline greater than 1%.
Because of these factors our model portfolio has held no Nasdaq positions and constrained S&P-related commitments to zero during sell intervals, and as low as 25% of normal levels during some buy intervals in the worst periods in 2022.
Option-Protected Structures
My own favorite trading vehicle has been SPXL, a 3X-leveraged ETF, held in smaller portfolio portions than would typically be devoted to S&P-type investments. In normal times I’ll devote 30% of my portfolio to SPXL. There are three reasons for this. First, it frees the remainder of my portfolio for yield investments which will be paying decent dividends by year end 2022. Second, the algorithm, by constraining drawdowns, turns volatility decay into a positive. Third, by using covered calls in conjunction with the algorithm, compound growth in the neighborhood of 60% on the invested portion is attainable with reasonable drawdown exposure.
Structures can be customized to any risk-reward appetite using a Monte Carlo tool available to EZV members. This is the risk profile of my current structure using 50% short-call coverage.
Monte Carlo of Structure Outcomes (Michael Gettings; Data Sources: Fidelity, CBOE, Barchart.com)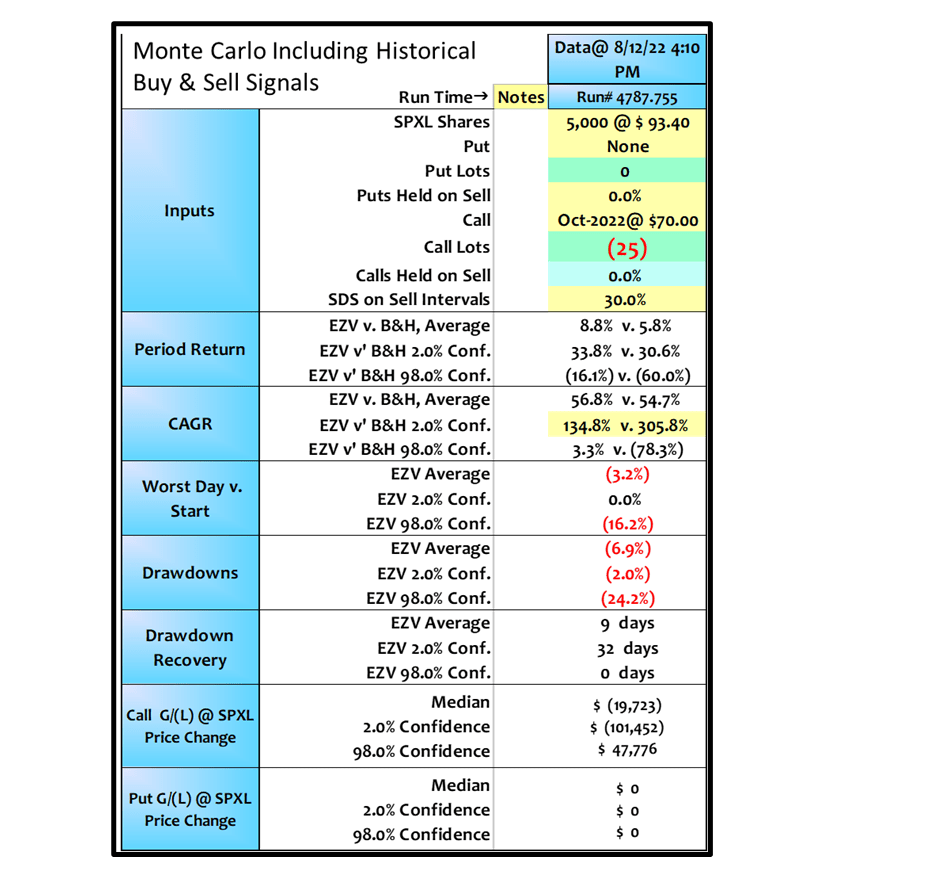
Remember, at a 30% portfolio commitment, the 56.8% CAGR shown above would contribute 17% average gains per year at the portfolio level. The drawdown would be very small (2%) in the average case, but even at 98% confidence (one in 50 outcomes) drawdowns of (24%) would translate to (7%) at the portfolio level.
And that brings me back to the YTD performance:
YTD Performance (EZV Algorithms; Data Sources: Fidelity, CBOE, Barchart.com)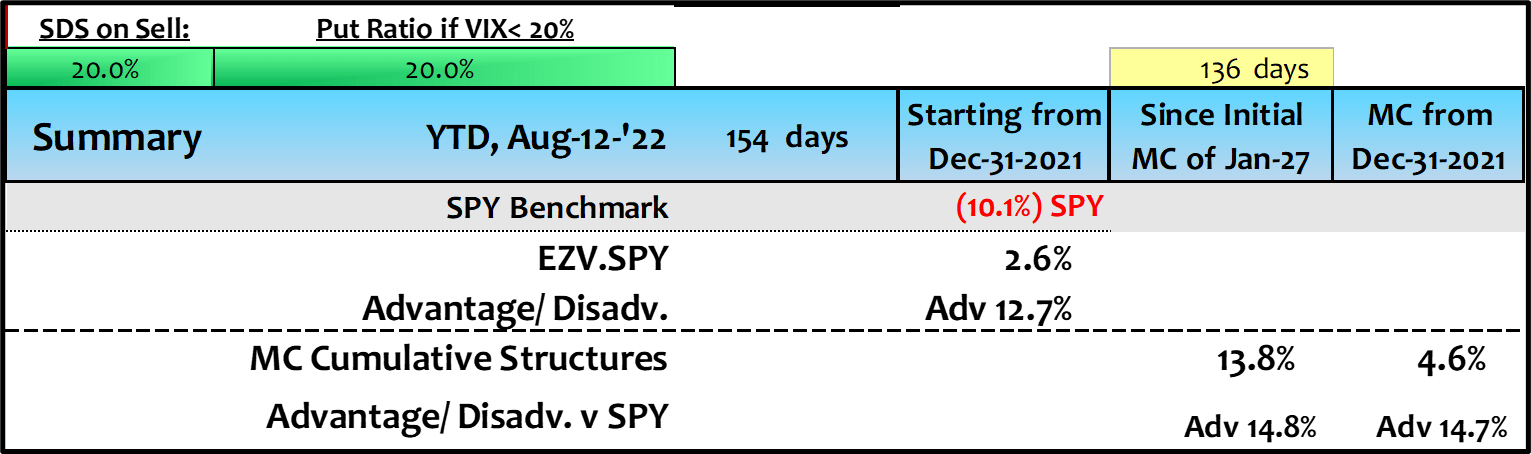
The “MC” in that table is an abbreviation for ‘Monte Carlo Strategies’, the most recent of which is depicted in the earlier Monte Carlo table. The right-most column includes a 2021 carry over structure that earned gains overall, but lost money in January. The column labeled ‘Since Initial MC of Jan-27’ includes all structures initiated this year.
I’m not sure it’s a fair assessment to extrapolate a six-month experience, but the 13.8% gain since Jan 27th would extrapolate to a 26.8% gain over 252 trading days. That would fit neatly between the 98%-confidence CAGR and the average in the Monte Carlo assessment; in fact, it falls almost precisely at one standard deviation below average. Given the ugliness of 2022 YTD markets, that’s a favorable outcome.
Closing
The short calls and the Monte Carlo assessments add some complexity, but on balance I believe this particular market calls for the extra effort. Both returns and risk characteristics have borne that out. I’ve got a bevy of statistics that indicate drawdown potential will be tolerable without the option protection once this market has bounced off a definable bottom, and unmitigated returns are likely to be better.
The VIX has declined now to less than 20 and I’ve become slightly more aggressive in recent weeks. The 50% short-call coverage had been 100% in the prior structure through the sell signal in mid-July. Also, the commitment model has progressed from 25% of normal to 100% although I’ve been implementing that gradually.
Market participants have now largely digested the two negative GDP quarters and the current Fed posture, tightening into 2023. I expect the recession to deepen, but even that will become apparent in the next few months. There are always black swan possibilities, but I think grey swans are of particular concern these days, particularly as relates to China. Ultimately, the algorithm will tend to beat market returns with diminished risk, but now, given the grey swan concerns, I’ll also deploy some mitigation via the Monte Carlo-derived structures.
Thanks for reading. — Mike Gettings
Appendix
This chart is reprinted from a post of January 11, 2022.
Growth Stock Vulnerability To Rates (Michael Gettings; Data Sources: Fidelity, CBOE, Barchart.com)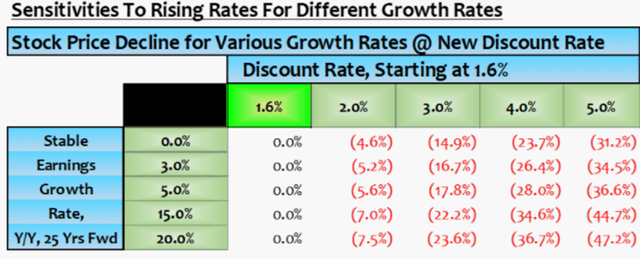
Be the first to comment