

syahrir maulana
AVUV strategy and portfolio
The Avantis U.S. Small Cap Value ETF (NYSEARCA:AVUV) invests in small cap companies with value and profitability characteristics. The fund has 690 holdings, a distribution yield of 1.46% and a total expense ratio of 0.25%.
As described in the prospectus by Avantis Investors,
The portfolio managers define “value characteristics” mainly as adjusted book/price ratio (though other price to fundamental ratios may be considered). The portfolio managers define “profitability” mainly as adjusted cash from operations to book value ratio (though other ratios may be considered). The portfolio managers may also consider other factors when selecting a security, including industry classification, the past performance of the security relative to other securities, its liquidity, its float, and tax, governance or cost considerations, among others.
In this article, AVUV will be compared to two small cap value ETFs tracking passive indexes: the iShares S&P Small-Cap 600 Value ETF (IJS) and the iShares Russell 2000 Value ETF (IWN).
Aggregate Price/Earnings and Price/Cash Flow ratios of AVUV are much lower than for its two competitors. The difference in Price/Book and Price/Sales is less significant.
|
AVUV |
IJS |
IWN |
|
|
Price / Earnings TTM |
6.98 |
11.05 |
9.45 |
|
Price / Book |
1.29 |
1.31 |
1.18 |
|
Price / Sales |
0.65 |
0.66 |
0.93 |
|
Price / Cash Flow |
4.75 |
8.53 |
7.8 |
Source: Fidelity
The top 10 holdings, listed below with their weights and valuation ratios represent about 8% of asset value. No holding weighs more than 1%, so risks related to individual stocks are very low.
|
Ticker |
Name |
Weight |
P/E ttm |
P/E fwd |
P/Sales |
P/Book |
P/FCF |
Yield% |
|
Triton International Ltd |
0.92% |
6.62 |
6.02 |
2.36 |
1.69 |
N/A |
3.86 |
|
|
Ryder System Inc |
0.83% |
5.97 |
5.57 |
0.39 |
1.49 |
N/A |
2.99 |
|
|
Commercial Metals Co |
0.82% |
4.98 |
4.95 |
0.63 |
1.71 |
N/A |
1.28 |
|
|
SM Energy Co |
0.80% |
5.93 |
4.98 |
1.51 |
2.15 |
5.43 |
0.05 |
|
|
Murphy USA Inc |
0.79% |
13.38 |
13.23 |
0.33 |
9.31 |
11.61 |
0.42 |
|
|
Cabot Corp |
0.72% |
30.43 |
12.37 |
1.05 |
4.84 |
N/A |
1.94 |
|
|
Chemours Co |
0.72% |
6.85 |
6.53 |
0.84 |
4.82 |
17.27 |
2.73 |
|
|
Air Lease Corp |
0.71% |
N/A |
N/A |
1.95 |
0.69 |
N/A |
1.85 |
|
|
Louisiana-Pacific Corp |
0.69% |
3.71 |
4.74 |
1.06 |
3.33 |
4.25 |
1.44 |
|
|
Mueller Industries Inc. |
0.68% |
5.87 |
6.74 |
0.94 |
2.56 |
9.02 |
1.46 |
Ratios: Portfolio123
The next chart compares sector weights in AVUV, IJS and IWN. There is a common pattern: financials come first and industrial are in second position. Compared to its competitors, AVUV overweights energy (massively), financials, and consumer discretionary. It underweights healthcare, technology, communication and almost ignores real estate and utilities.
AVUV sectors (chart: author; data: Fidelity)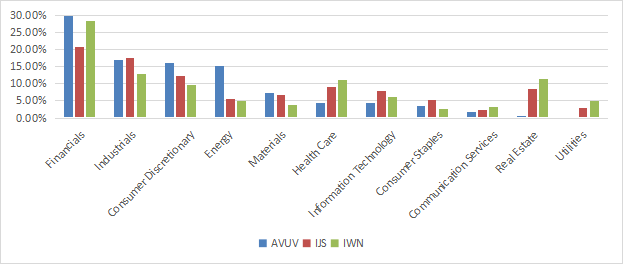
Performance
AVUV has a short history: less than 3 years. Since October 2019, AVUV has outperformed IJS and IWN (see next table). It also beats the large cap benchmark S&P 500, which has a total return about 50% in the same time frame. The risk measured in drawdown and volatility is higher, but AVUV is leading also in risk-adjusted performance (Sharpe ratio).
|
since 10/1/19 |
Total Return |
Annual Return |
Drawdown |
Sharpe ratio |
Volatility |
|
AVUV |
62.80% |
18.49% |
-48.69% |
0.63 |
32.08% |
|
IJS |
38.84% |
12.10% |
-45.43% |
0.46 |
28.57% |
|
IWN |
38.71% |
12.07% |
-44.61% |
0.43 |
28.04% |
Data calculated with Portfolio123
A note of caution though: this period is too short to evaluate the strategy.
The next chart shows that AVUV also outperforms its competitors in 2022 to date:
AVUV vs. IJS vs. IWN in 2022 (Portfolio123)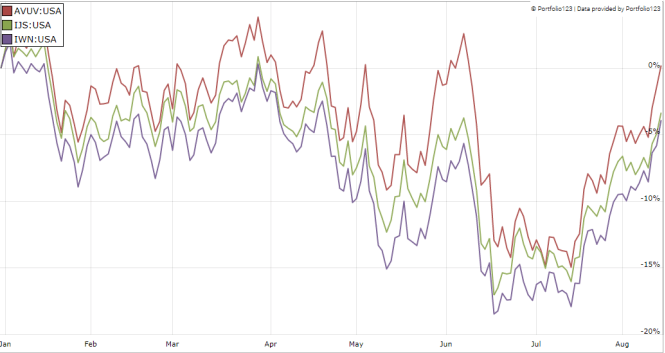
Comparing AVUV with my Dashboard List model
The Dashboard List is a list of 80 stocks in the S&P 1500 index, updated every month based on a simple quantitative methodology. All stocks in the Dashboard List are cheaper than their respective industry median in Price/Earnings, Price/Sales and Price/Free Cash Flow. After this filter, the 10 companies with the highest Return on Equity in every sector are kept in the list. Some sectors are grouped together: energy with materials, communication with technology. Real estate is excluded because these valuation metrics don’t work well in this sector. I have been updating the Dashboard List every month on Seeking Alpha since December 2015, first in free-access articles, then in Quantitative Risk & Value.
The next table compares IJS underlying index since inception with the Dashboard List model, with a tweak: the list is reconstituted quarterly instead of once a month to make it comparable to a passive index.
|
since 10/1/19 |
Total Return |
Annual Return |
Drawdown |
Sharpe ratio |
Volatility |
|
AVUV |
62.80% |
18.49% |
-48.69% |
0.63 |
32.08% |
|
Dashboard List |
56.90% |
16.98% |
-39.85% |
0.69 |
23.78% |
Past performance is not a guarantee of future returns. Data Source: Portfolio123
AVUV outperforms the Dashboard List by about 1.5 percentage points in annualized return but lags a bit in risk-adjusted performance due to a much higher volatility. Moreover, the drawdown is deeper by 9 percentage points. However, the fund’s price history is real and the model performance is hypothetical.
I like the idea of combining the size factor with various ratios to select stocks like AVUV does. Among them, the price/book ratio (P/B) is the historical value factor from the Fama-French three-factor model. However, statistics in the last two decades show that it may add some risk in the strategy. The next table shows the return and risk metrics of the cheapest quarter of the S&P 500 (i.e., 125 stocks) measured in price/book, price/earnings, price/sales, and price/free cash flow. The sets are reconstituted annually between 1/1/1999 and 4/20/2021 with elements in equal weight.
|
Annual Return |
Drawdown |
Sharpe ratio |
Volatility |
|
|
Cheapest quarter in P/B |
9.61% |
-72.62% |
0.46 |
21.32% |
|
Cheapest quarter in P/E |
11.13% |
-65.11% |
0.56 |
19.15% |
|
Cheapest quarter in P/S |
12.41% |
-65.66% |
0.59 |
20.70% |
|
Cheapest quarter in P/FCF |
12.55% |
-63.39% |
0.62 |
19.34% |
Data calculated with Portfolio123
This explains my choice of using P/E, P/S, P/FCF, but not P/B in the Dashboard List model. It may also explain why AVUV drawdown and volatility point to a higher risk.
AVUV strategy is not fully disclosed, but I guess it may have another shortcoming, which is usual in value funds: classifying all stocks on the same criteria. It means the valuation ratios are considered comparable across industries. A consequence is to privilege sectors where valuation ratios are naturally cheaper, especially financials.
Takeaway
AVUV is invested in 690 small caps companies selected for their valuation and profitability. The strategy makes a lot of sense: it combines size and value, two of the three original factors of the Fama-French model, then adds profitability. However, the strategy is difficult to evaluate from its description and short history. Investing in an actively managed fund needs a lot of trust in the management team. AVUV shareholders must also be comfortable with a heavy exposure to financials (almost 30% of asset value). Moreover, the fund is more volatile than its more popular competitors, probably because the price/book ratio is the prominent metric in the strategy. My Dashboard List model uses three valuation metrics in equal importance, but not P/B because I consider it too risky.
Be the first to comment