

Key Talking Points:
- The reflation trade is looking exhausted, earnings season to offer a glimpse into economic recovery
- FTSE 100, IBEX 35, CAC 40 Key Levels to Watch

Recommended by Daniela Sabin Hathorn
Get Your Free Equities Forecast
Financial markets have been discounting the reopening of economies for several months now, allowing for a reflation trade that aided smaller businesses and financial institutions. But these small-cap stocks are now underperforming bigger, more secure stocks again, which could be hinting at the fact that the actual economic recovery may be harder than initially expected. With the start of the earnings season in the US focusing on banks, it can be seen as a reveal of how the recovery is going so far and what are the potential surprises that haven’t been priced into the markets.
As always, European equities are likely to be highly sensitive to the effect of the earnings season on the stock market. These are the key levels to watch out for:
FTSE 100 Levels
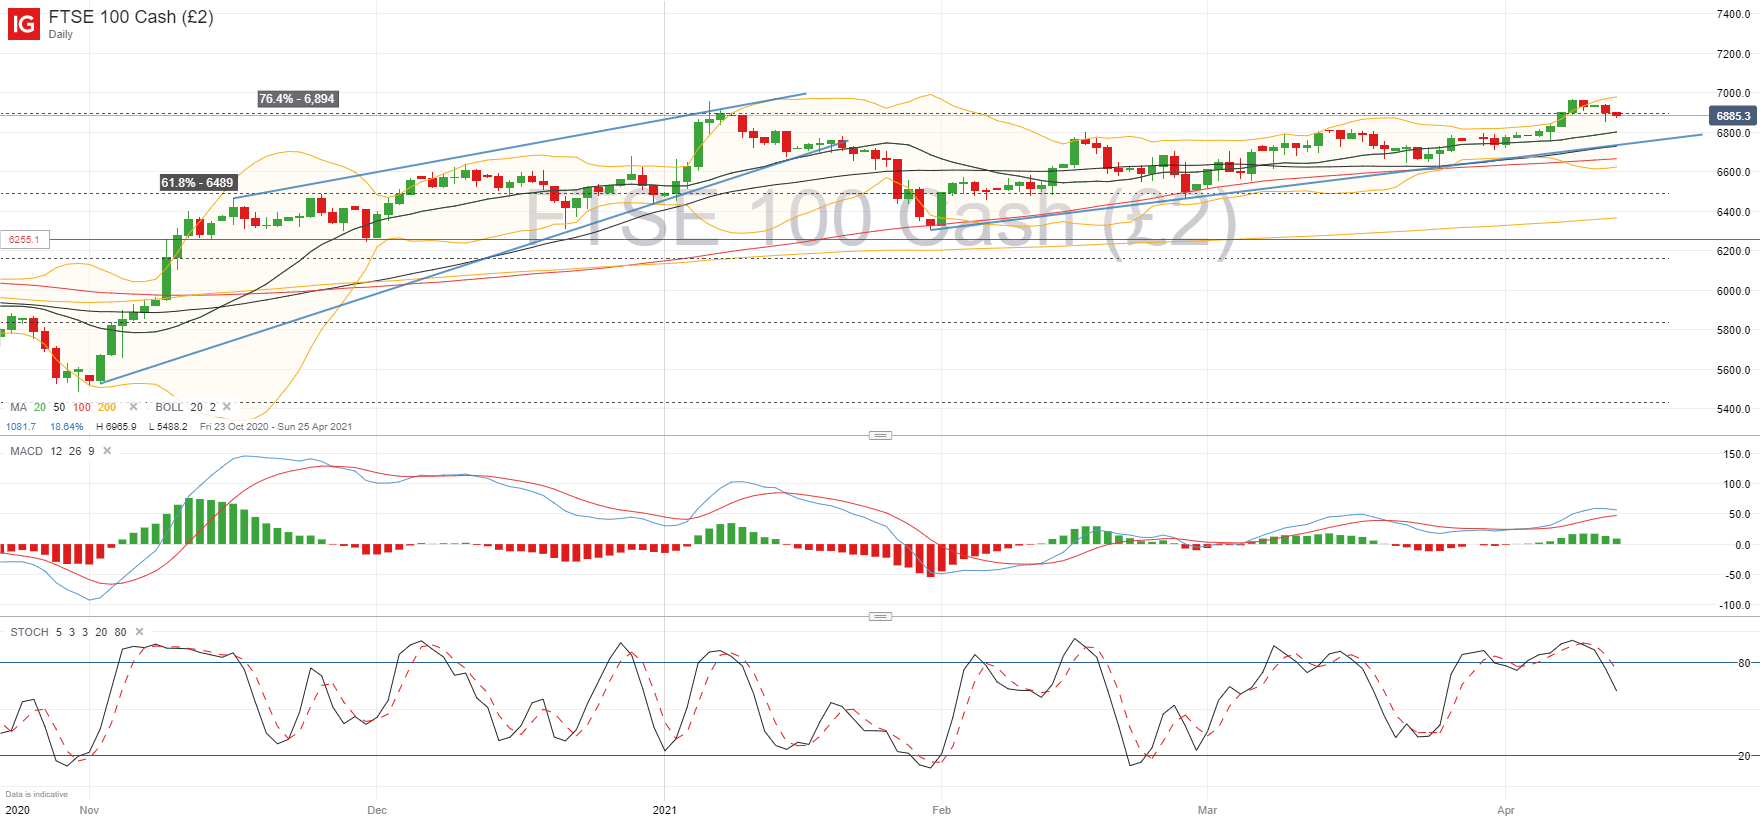
The FTSE 100 has been riding out the ascending trendline but the slope is minimal which means that the moves in the last few months have been mostly sideways with a slight bullish tendency. Although this remains, resistance levels on the attempted push towards the 7,000 mark are making the British index retrace back towards its mean-reverting level within its Bollinger band range.
Current price has now fallen below the 76.4% Fibonacci (6,894) which is putting the short-term bullish trend at risk. For now, buyers should be safe as long as price remains above the 6,790. A break below this area puts the ascending trendline at focus as the next support area, now at 6,730, at which point there would be a greater risk for a reversal towards the 6,600 mark. If sentiment turns upward to finish the session, a break above 6,940 would put buyers in a good place for a new attempt at the 7,000 mark.
FTSE 100 Daily chart
Discover what kind of forex trader you are

IBEX 35 Levels
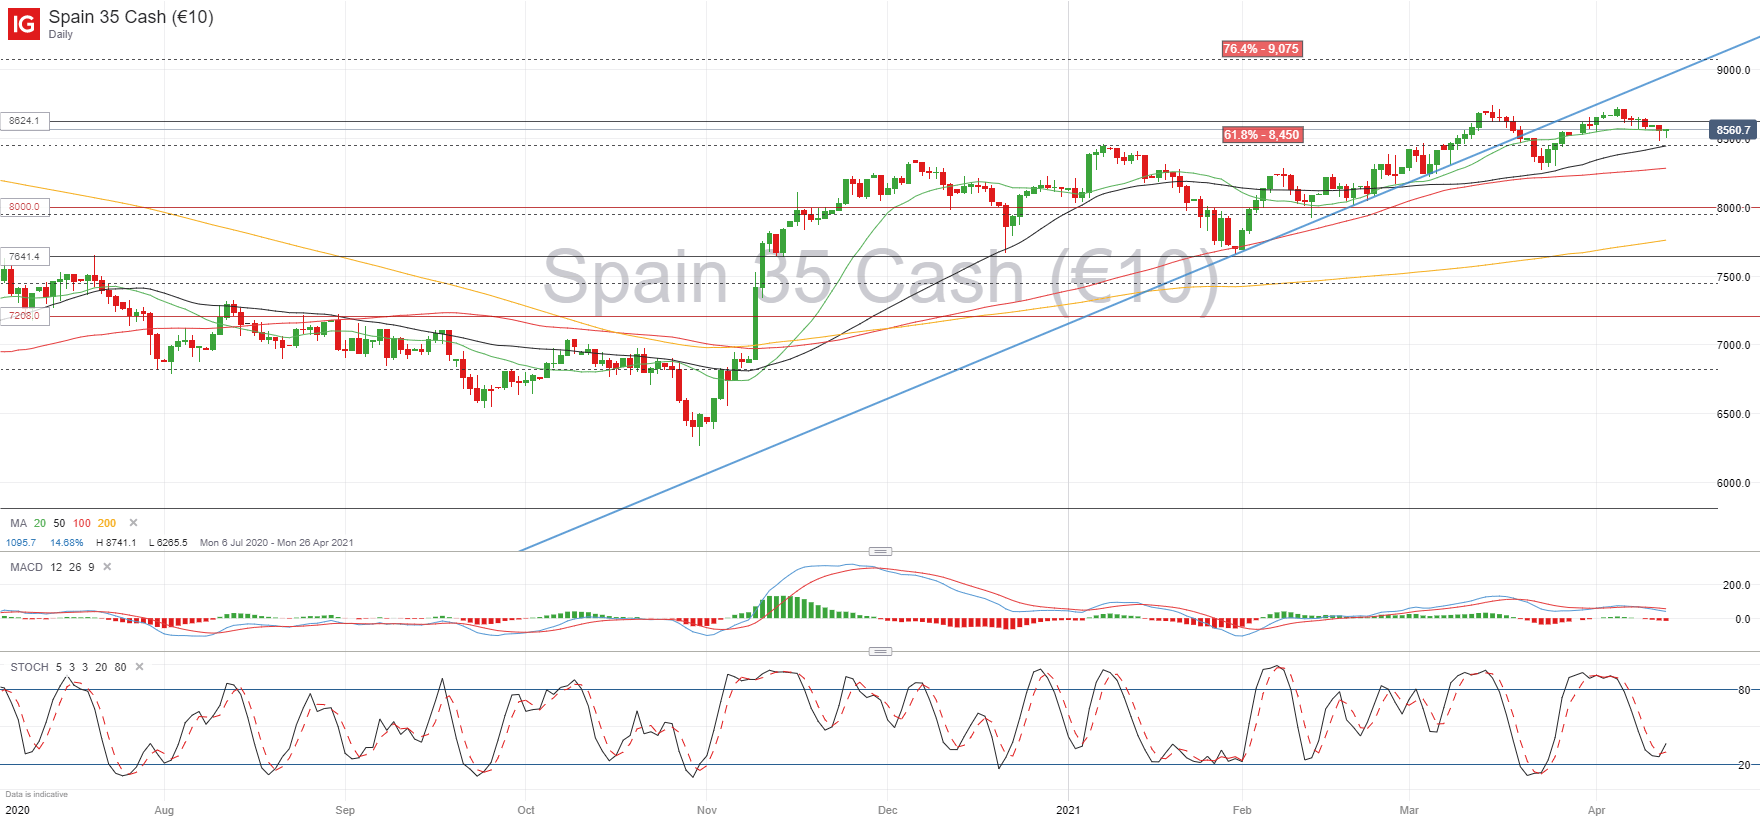
The Spanish stock index has been struggling to find bullish momentum since it dropped below the ascending trendline back at the end of March. The current picture on the daily chart seems to be suggesting the possibility of a double-top pattern, which would be signaling increased bearish pressure in the short term. The 61.8% Fibonacci could may well still offer some support at 8,450, but a fall below this level is likely to see the double-top pattern consolidate, meaning that sellers would bring the price below its support level at 8,265. At this point, the IBEX 35 would be in a limbo between two key Fibonacci levels and there would be a greater risk of a retracement towards the 8,000 mark.
IBEX 35 Daily Chart
CAC 40 Levels
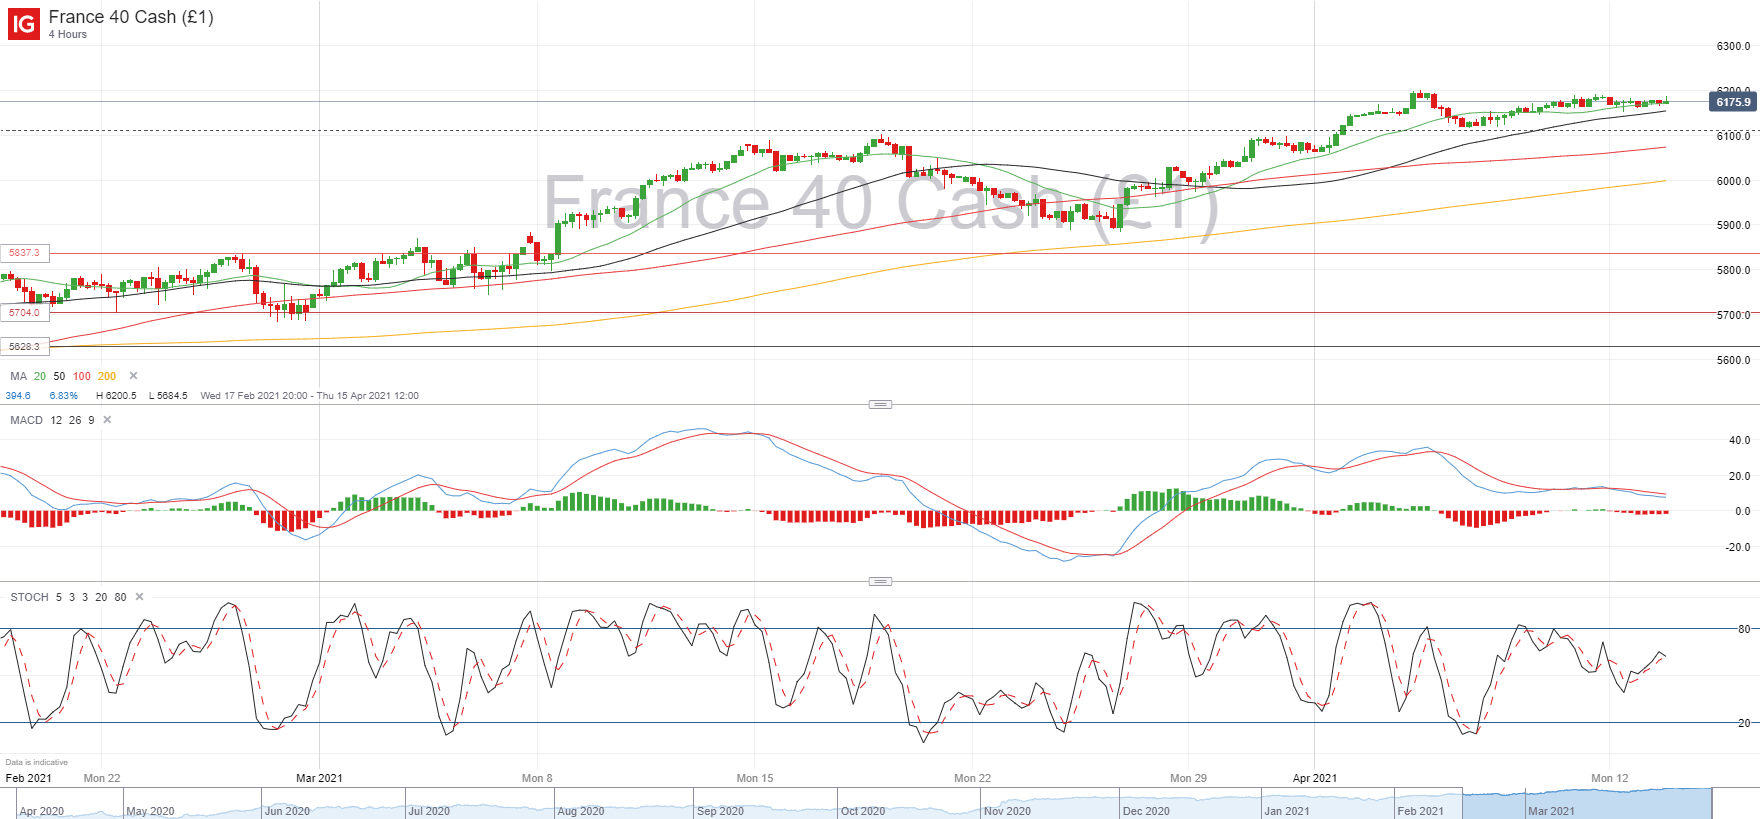
The CAC 40 has been losing its bullish momentum since it crossed over the line that marked its full recovery from the Covid-19 stock market meltdown. The French index has been outperforming relative to some of its European peers since it started its recovery back in March 2020, but the 6,200 horizontal line has been showing strong resistance. Its price has been moving sideways for the last week, which has allowed momentum indicators to reset their overbought conditions, allowing for more buyers to come in at current levels. That said, if the CAC is unable to break above the 6,200 mark in the next few sessions, it risks a bearish reversal as buying momentum wears out, at which point the 6,100 is the key support area.
CAC 4-hour chart
Learn more about the stock market basics here or download our free trading guides.
— Written by Daniela Sabin Hathorn, Market Analyst
Follow Daniela on Twitter @HathornSabin
Be the first to comment