

Khanchit Khirisutchalual
FTRI strategy and portfolio
The First Trust Indxx Global Natural Resources Income ETF (NASDAQ:FTRI) has been tracking the Indxx Global Natural Resources Income Index since 3/11/2010. As of writing, it has 50 holdings (excluding cash), a 12-month distribution yield of 8.9% and a total expense ratio of 0.70%. It pays quarterly distributions.
As described by First Trust, eligible stocks must be classified into five sectors or subsectors: energy, materials, agriculture, water and timber. They are screened regarding certain criteria, in particular liquidity, size and dividend history. Then, the top 50 companies by dividend yield are selected as constituents, and they are weighted based on free float adjusted market capitalization. The number of securities in each of the five categories is capped at 30%. The Index is reconstituted annually in June and is rebalanced quarterly.
Large and mega-caps represent 68% of asset value. North America is the heaviest region (33%), followed by Asia (23%) and South America (21%). The top 5 countries are the U.S. (23.6%), Brazil (19.6%), Australia (14%), the U.K. (12.8%) and Canada (10.8%). Other countries weigh no more than 4% individually and 20% together. The next chart plots the top 10 countries, which represent 95% of asset value.
FTRI countries (chart: author; data: First Trust)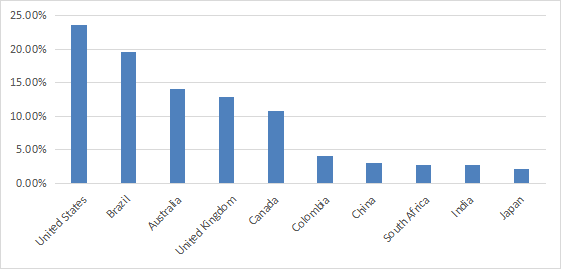
The portfolio is very concentrated in basic materials (58%), followed by energy (30%). The heaviest industries are metals/mining (39%) and oil/gas (27%).
FTRI sectors (chart: author; data: First Trust)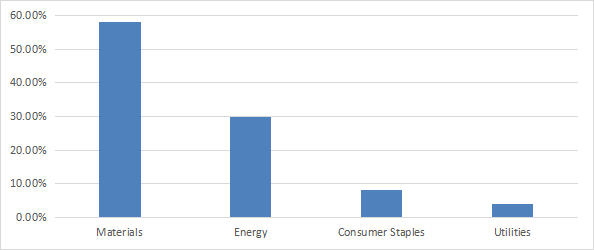
FTRI is much cheaper than the US benchmark S&P 500 (SPY) regarding valuation ratios (next table). However, metrics are biased by the sector and geographical breakdown. Every country and industry has different averages. In particular, materials have cheaper valuation ratios than other sectors, with an average price-to-earnings about 14 in the U.S. market. Broad market ratios also are much lower in the top countries excluding the US: the aggregate P/E is about 5 in Brazil, 9.5 in the U.K., 12 in Australia and Canada.
|
FTRI |
SPY |
|
|
Price / Earnings TTM |
4.99 |
19.63 |
|
Price / Book |
1.53 |
3.72 |
|
Price / Sales |
0.97 |
2.4 |
|
Price / Cash Flow |
3.67 |
14.98 |
The portfolio is quite concentrated in the top 10 holdings, which represent 65.8% of asset value. They are listed below with some fundamental ratios. Each of the top 4 names weighs over 8%. Risks related to other holdings are moderate.
|
Ticker |
Name |
sector |
Weight |
EPS growth %TTM |
P/E TTM |
P/E fwd |
Yield% |
|
Vale S.A. |
Materials |
10.89% |
23.74 |
3.52 |
4.27 |
20.24 |
|
|
Rio Tinto |
Materials |
10.43% |
-4.77 |
5.22 |
6.34 |
13.02 |
|
|
BHP Group Ltd. |
Materials |
10.33% |
N/A |
5.67 |
8.59 |
12.70 |
|
|
Petroleo Brasileiro S.A. |
Energy |
8.44% |
62.89 |
3.01 |
2.85 |
44.25 |
|
|
Suncor Energy, Inc. |
Energy |
4.86% |
541.23 |
6.34 |
4.53 |
4.17 |
|
|
Archer-Daniels-Midland Co. |
Consumer Staples |
4.40% |
54.69 |
13.47 |
12.40 |
1.87 |
|
|
Coterra Energy, Inc. |
Energy |
4.34% |
424.94 |
8.16 |
5.74 |
2.05 |
|
|
Nutrien Ltd. |
Materials |
4.17% |
633.78 |
6.76 |
4.99 |
2.29 |
|
|
Ecopetrol S.A. |
Energy |
4.00% |
201.52 |
3.04 |
2.94 |
14.31 |
|
|
CF Industries Holdings, Inc. |
Materials |
3.96% |
478.28 |
8.59 |
5.60 |
1.53 |
FTRI vs. competitors
The next table compares the fund’s performance and risk metrics with other non-hedged international dividend funds since 1/1/2016: First Trust S&P International Dividend Aristocrats Fund (FID), Schwab Fundamental International Large Co. ETF (FNDF), iShares International Select Dividend ETF (IDV), Invesco FTSE RAFI Developed Markets ex-U.S. ETF (PXF), First Trust Dow Jones Global Select Dividend ETF (FGD), SPDR S&P Global Dividend ETF (WDIV), Xtrackers MSCI EAFE High Dividend Yield Equity ETF (HDEF).
|
since Jan.2016 |
Total Return |
Annual.Return |
Drawdown |
Sharpe ratio |
Volatility |
|
FTRI |
96.87% |
10.54% |
-44.01% |
0.5 |
20.92% |
|
FID |
14.82% |
2.07% |
-38.96% |
0.2 |
17.30% |
|
FNDF |
34.89% |
4.53% |
-40.09% |
0.29 |
16.76% |
|
IDV |
22.65% |
3.06% |
-41.64% |
0.21 |
18.00% |
|
PXF |
29.97% |
3.95% |
-41.56% |
0.26 |
17.32% |
|
FGD |
29.93% |
3.95% |
-43.26% |
0.24 |
18.59% |
|
WDIV |
32.59% |
4.26% |
-40.11% |
0.27 |
16.76% |
|
HDEF |
18.11% |
2.49% |
-36.87% |
0.19 |
15.17% |
Data calculated with Portfolio123
As a reference, SPY has an annualized return of 11.6% in the same period. FTRI has beaten all ETFs in the list since 2016. It also shows a higher risk measured in drawdown and standard deviation of monthly returns (volatility), but it stays on the top of the pack in risk-adjusted performance (Sharpe ratio). In 2022 to date, FTRI has even beaten SPY by over 20 percentage points (see next chart).
FTRI vs. SPY in 2022 to date (Portfolio123)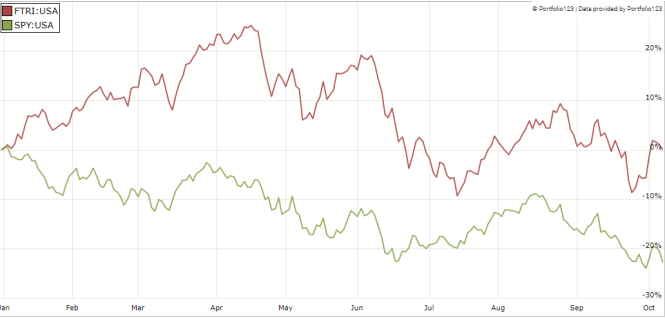
In this inflationary environment, hard assets and natural resource producers look relatively safer investments. Unlike most high-yield funds, FTRI has done a good job this year to preserve not only distributions, but also asset value per share.
Takeaway
FTRI holds 50 global high-yielding stocks of large and mid-size companies, mostly in materials and energy. Over 40% of asset value is in the top 2 countries: the U.S. and Brazil. It is also quite concentrated regarding holdings: about 40% is in the top 4 companies. Past performance since 2016 is attractive relative to diversified global high-yield ETFs. FTRI is a good choice for investors seeking a fund whose capital and distribution are likely to resist inflation better than the broad market. For transparency, a dividend-oriented part of my equity investments is split between a passive ETF allocation (FTRI is not part of it as of writing this) and my actively managed Stability portfolio (14 stocks), disclosed and updated in Quantitative Risk & Value.
Be the first to comment