

SDI Productions
Fidelity MSCI Consumer Staples Index ETF (NYSEARCA:FSTA) is an exchange-traded fund that provides investors with direct exposure to characteristically defensive stocks in the consumer staples sector. The fund carries a low expense ratio of just 0.08%, and was launched in October 2013. Today, Fidelity reports net assets under management (for FSTA) of $1.1 billion, making the fund quite popular. However, the strategy of investing in consumer staples is quite basic, and the fund is also geographically limited to the United States. Net fund flows over the past year have been positive, which is not surprising given where the United States has been in its present business cycle.
Fidelity.com
According to Fidelity research as of Q4 2022, the United States has been heading into a recessionary phase.
Fidelity.com
As markets tend to lead the real economy by about 2-4 quarters, it makes sense that defensive stocks like those FSTA prefers would out-perform. FSTA has fallen by -5.67% year-to-date at the time of writing, against the S&P 500 U.S. equity index’s -16.89% (on a price- or level-only basis, in both cases). While FSTA has fallen, the out-performance is material. Staples have been a good place to be. The five-year historical beta for FSTA is also lower at just 0.63x; indeed, part of the appeal of FSTA’s portfolio is its stronger earnings predictability (lower volatility). This translates into lower price volatility.
However, funds like FSTA are generally going to under-perform for similar reasons during more bullish phases of the business cycle. With U.S. year-over-year inflation beginning to tail off (perhaps speaking optimistically; see below) it is possible that the U.S. will be heading into a soft decline and/or recession. This should coincide with a market-bottoming process, with markets leading the real economy by 6-12 months, and this should also mean that FSTA will naturally begin to under-perform once again relative to broader equity indices.
TradingEconomics.com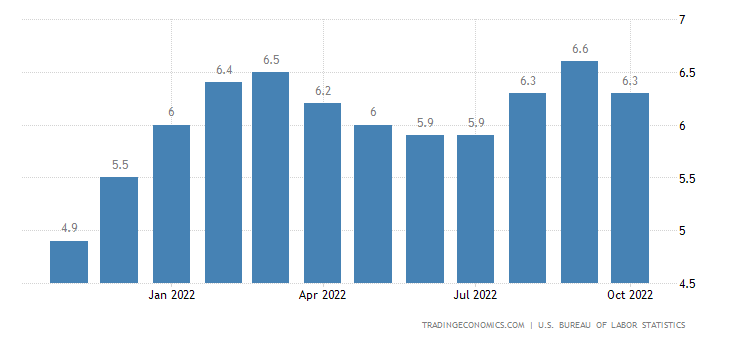
Nevertheless, we can still value FSTA at this present juncture. FSTA seeks to track the performance of its chosen benchmark index, the MSCI US IMI Consumer Staples 25/50 Index. This is a capped version of the uncapped Consumer Staples Index from MSCI. While information is not available for the capped version, whose index composition is indeed different to the regular version, the regular version offers (as of October 31, 2022) trailing and forward price/earnings ratios of 22.46x and 20.03x, with a price/book ratio of 5.84x. That implies a forward return on equity of 29.16%. The forward earnings yield is 5%. The latter is relatively low, but the forward return on equity is very good.
Having said that, in spite of the high ROE, these are not classic growth businesses. Dividend distribution rates are higher than average, and the larger companies in the index have buyback programs that reduce the carrying value of their book equity (brought forward each year). This results in a lower earnings growth rate over time, because these companies simply cannot out-grow their staid industries. That is not a bad thing, so long as we factor this into any valuation.
Using Morningstar data, which in fact implies a lower return on equity (resulting from the less favorable portfolio composition following FSTA’s benchmark’s capping methodology) of 22%. With a trailing dividend yield of 2.53%, we can also surmise that the trailing distribution rate of profits into dividends (excluding buybacks) is about 57%. For now, I will assume a buyback rate of about 50% of annual net income going forward, and a steady decline in the return on equity to about 20% (I am assuming a high degree of stability). My resulting three- to five-year average earnings growth rate is 4.50-6.20%, which compares to Morningstar’s consensus analyst estimate of 6.26% for the same period, so it would seem that these projections are roughly in line with forecasts.
The end result is that my implied IRR for FSTA is about 7.38%. With a current U.S. 10-year yield (“risk-free rate”) of 3.83%, that implies an underlying equity risk premium of 3.55%, which is low, but would be worth 5.64% on a beta-adjusted basis. This also implies a steady terminal earnings multiple.
Author’s Calculations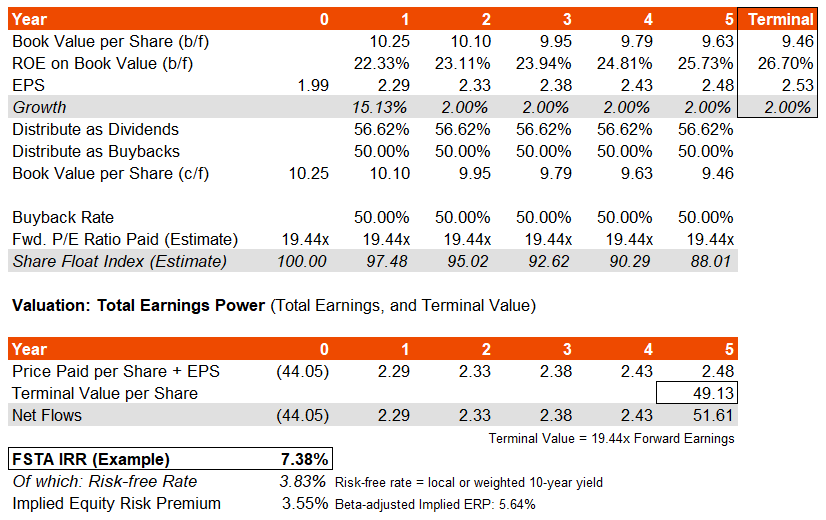
In the United States, I would argue for an average ERP of 4.2-5.5% on beta of 1.00x (i.e., on equity funds that are historically about as volatile as the S&P 500). Therefore, with a beta-adjusted ERP of 5.64% (roughly speaking, based on my basic inputs and assumptions), FSTA is probably priced for perfection, or potentially a little cheap. However, a slightly out-of-range ERP is fine, especially for funds like FSTA that offer low long-term returns in general. As capital is finite, it makes sense that less exciting funds (as opposed to growth and tech stocks, for instance) will earn a more expensive cost of equity. Few investors want to hold lower-yielding instruments in the long run.
With where the United States is in its current business cycle, and given FSTA’s defensive focus and valuation, I would remain neutral on the fund going forward. I do not think it is expensive; if anything, it might be trading on the cheaper side. In any event, I do not expect FSTA will return considerably more than 7-8% over the next five years or so (on average) based on the current share price.
Also, I would say that the terminal earnings multiple is also potentially on the higher side, so that would present a long-term risk should the FSTA portfolio’s underlying return on equity drop more considerably in the long run. Cyclically speaking, I think that FSTA has served its purpose, but is no longer attractive.
Be the first to comment