

Diy13/iStock via Getty Images
While the First Trust High Income Long/Short Fund’s (FSD) 11.7% current distribution yield is attractive, investors are reminded that the fund’s portfolio does not earn sufficient income to pay the distribution. In most years, a significant part of the distribution is simply investor’s own capital being paid out as distribution. If investors are intent on owning a levered credit fund into an economic downturn, there may be better alternatives such as the PIMCO Dynamic Income Fund (PDI).
Fund Overview
The First Trust High Income Long/Short Fund is a closed-end fund (“CEF”) that provides investors with high current income. The fund primarily invests in non-investment grade corporate fixed income securities to achieve its objective. The FSD fund intends to maintain both long and short positions. Gross longs may total 130% of fund assets, while shorts may total up to 30% of assets. The fund currently has $411 million in net assets.
Portfolio Holdings
The First Trust website provides a lot of summary statistics on the FSD portfolio. As discussed above, the portfolio is predominantly non-investment grade corporate bonds, with ~85% of the portfolio rated BB or lower. As of August 31, 2022, the portfolio is net long 88% (101% long, 13% short), with the shorts primarily being treasuries. Effective duration is moderate at 5.1 years (Figure 1).
Figure 1 – FSD Portfolio Statistics (First Trust)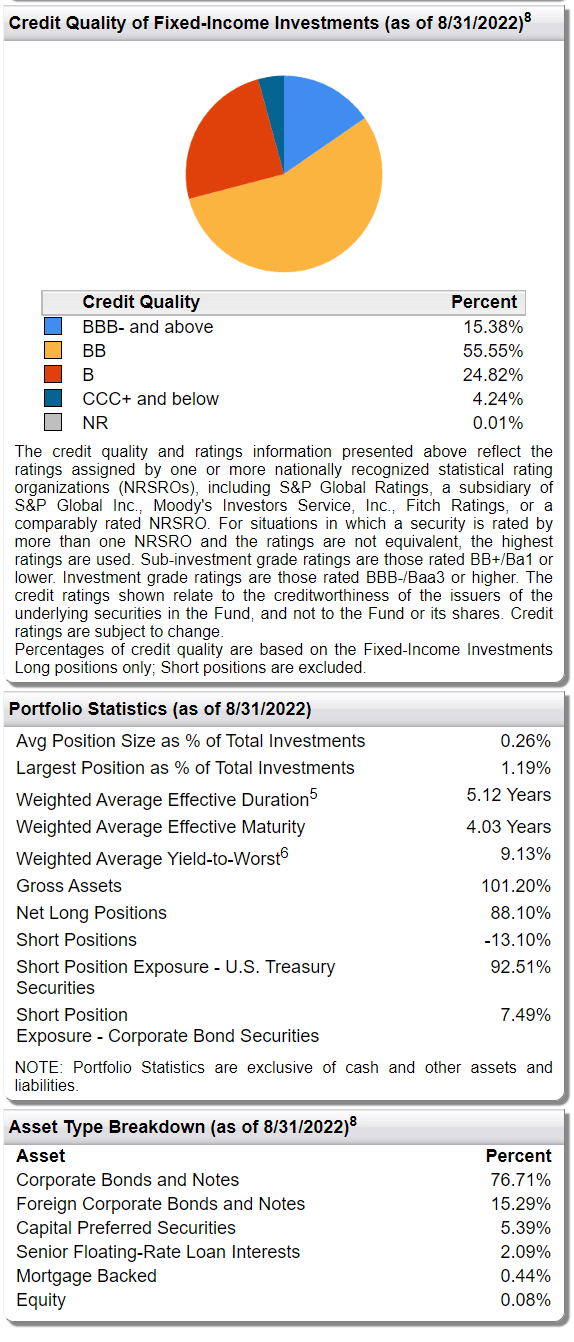
Returns
The FSD fund’s long-term returns have been mediocre. It has 3/5/10 Yr average annual returns on NAV of -1.2%/1.3%/4.3% respectively (Figure 2). YTD, the fund is down 17.1% to September 30, 2022.
Figure 2 – FSD Returns (First Trust)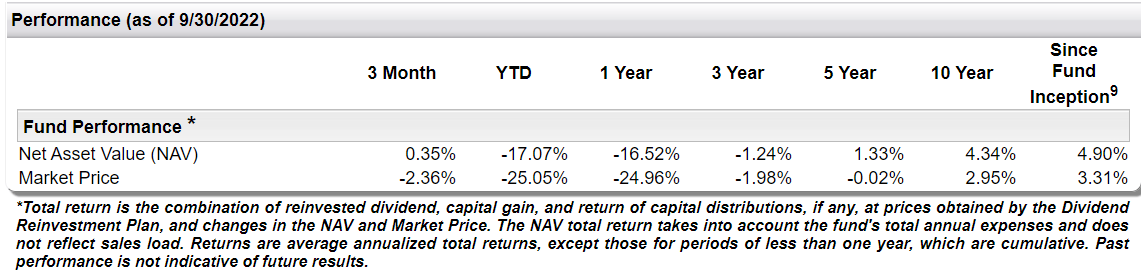
Distribution & Yield
The main attraction of the FSD fund is its high current distribution yield. The fund currently pays a monthly distribution of $0.105, which is a 11.7% current yield. The distribution was cut in October 2021 from $0.11 / month previously. The monthly distribution has been erratic since inception. The monthly distribution was $0.1335 for a few years initially before gradually being cut to a low of $0.08 in 2016 (Figure 3).
Figure 3 – FSD Historical Monthly Distribution (cefconnect.com)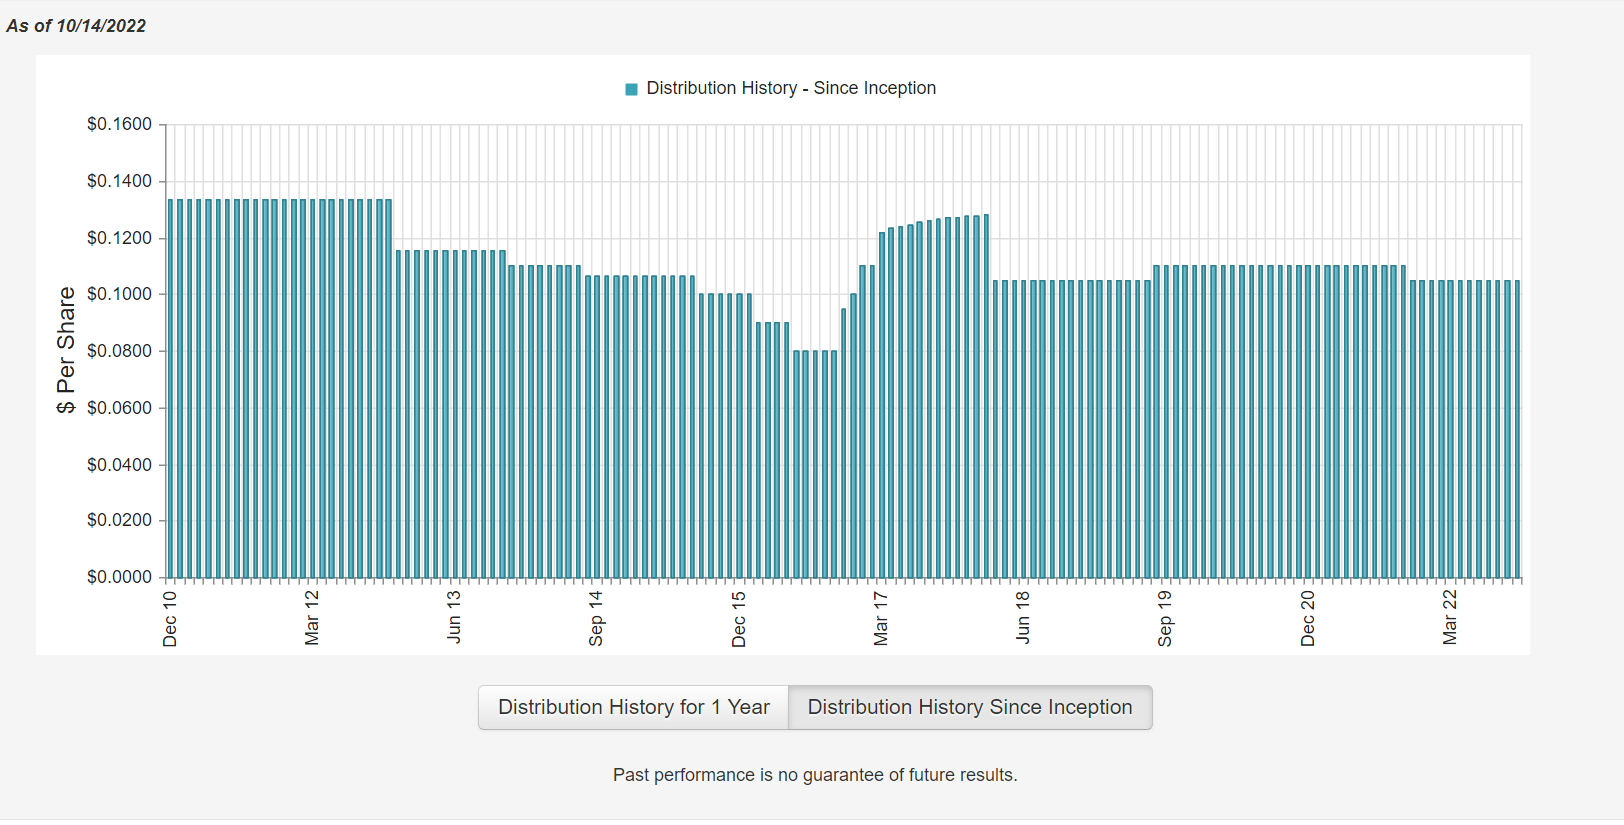
In any event, the distribution was historically not fully covered by Net Investment Income (“NII”). A significant percentage (28% in 2021, 30% in 2020) of the distribution in recent years had been from return of capital (“ROC,” highlighted in Figure 4 below).
Figure 4 – FSD Financial Highlights (FSD Semi-Annual Report, April 2022)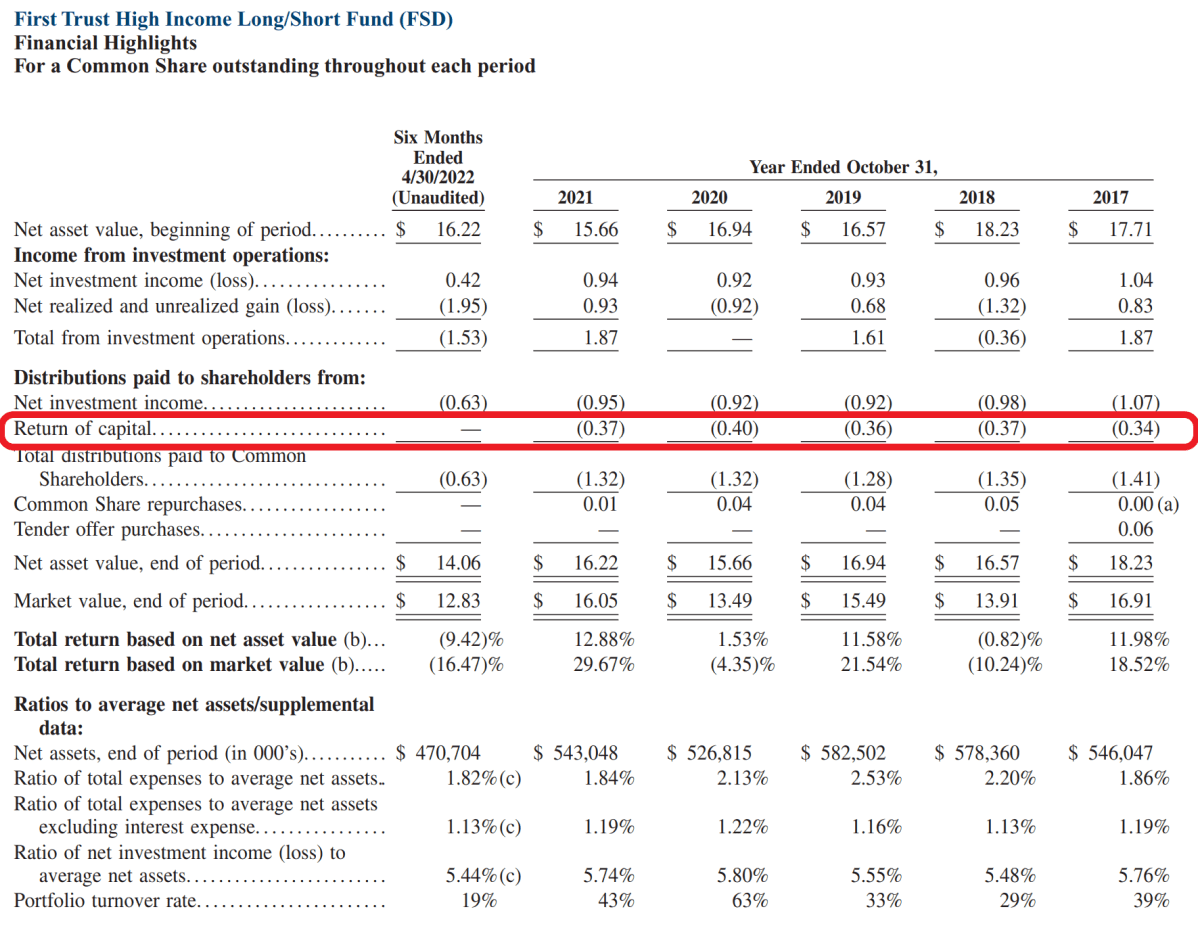
Fees
The FSD fund charges a reasonable expense ratio of 1.82% as of April 30, 2022. Management fees are charged as 1% of net assets.
Discount To NAV A Little Extreme
The FSD fund is currently trading at a 14% discount to NAV. The discount to NAV has ranged from 2% to 15%, so the current discount is a little extreme relative to historical data (Figure 5). This is likely due to the fact that the fund cut its distribution in October 2021, and investors are afraid of further cuts.
Figure 5 – FSD trades at a discount to NAV (cefconnect.com)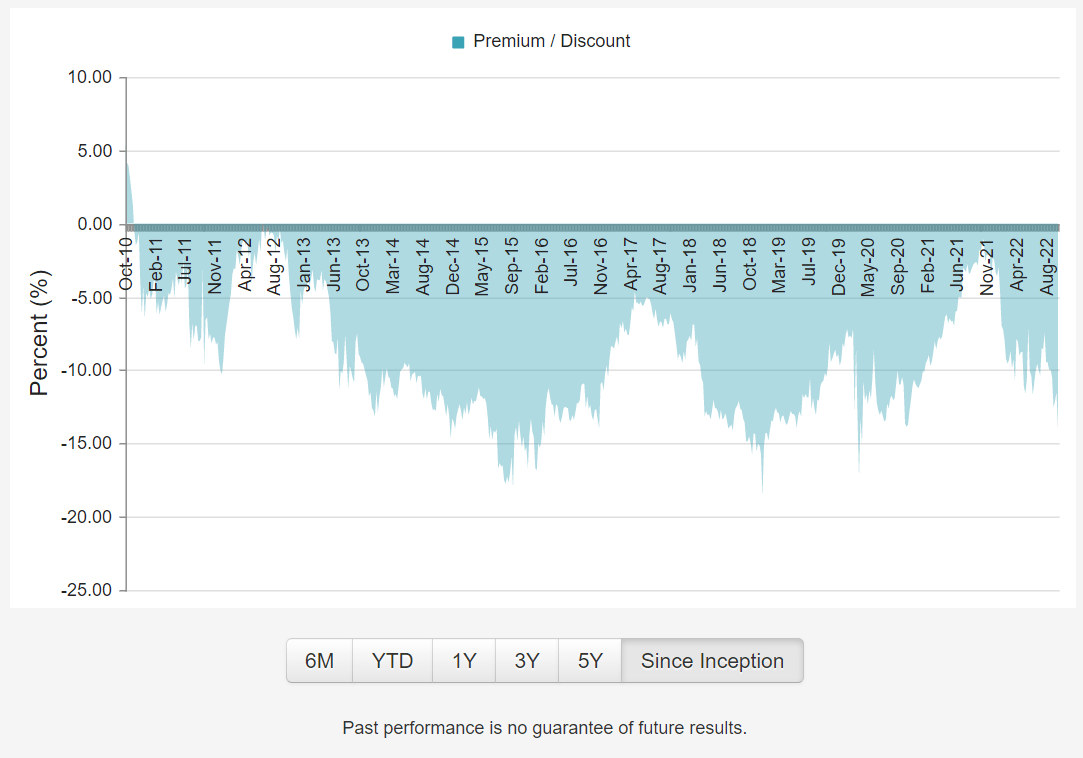
Distribution Yield Higher Than Total Returns
Similar to some other CEFs I have reviewed recently, the FSD fund is paying a distribution yield that is far above its long-term annual total returns, which means investors are actually just getting a portion of their own capital back every month. For FSD, the distribution yield as a % of NAV is 10.3%, yet since inception, FSD has only achieved 4.9% in total returns per annum.
Even if we only look at the past 5 fiscal years (2017 to 2021), the average annual total return is only 7.3%, which is insufficient to pay the 10%+ distribution while maintaining NAV constant.
PDI Is The Better Credit Fund
While I have reservations about the PDI fund as well, if we are simply comparing credit funds, I believe PDI is superior to FSD. First, comparing the two funds’ distribution, we find PDI has a superior current yield of 13.8% vs. 11.7%. PDI’s distribution is also covered by its net investment income, with a rolling 6 month coverage of 153%. Finally, if we look at historical total returns, we can see that PDI has significantly outperformed FSD in terms of CAGR return and Sharpe ratios in the time period analyzed (June 2012 to September 2022, see Figure 6).
Figure 6 – FSD vs. PDI (Author created using Portfolio Visualizer)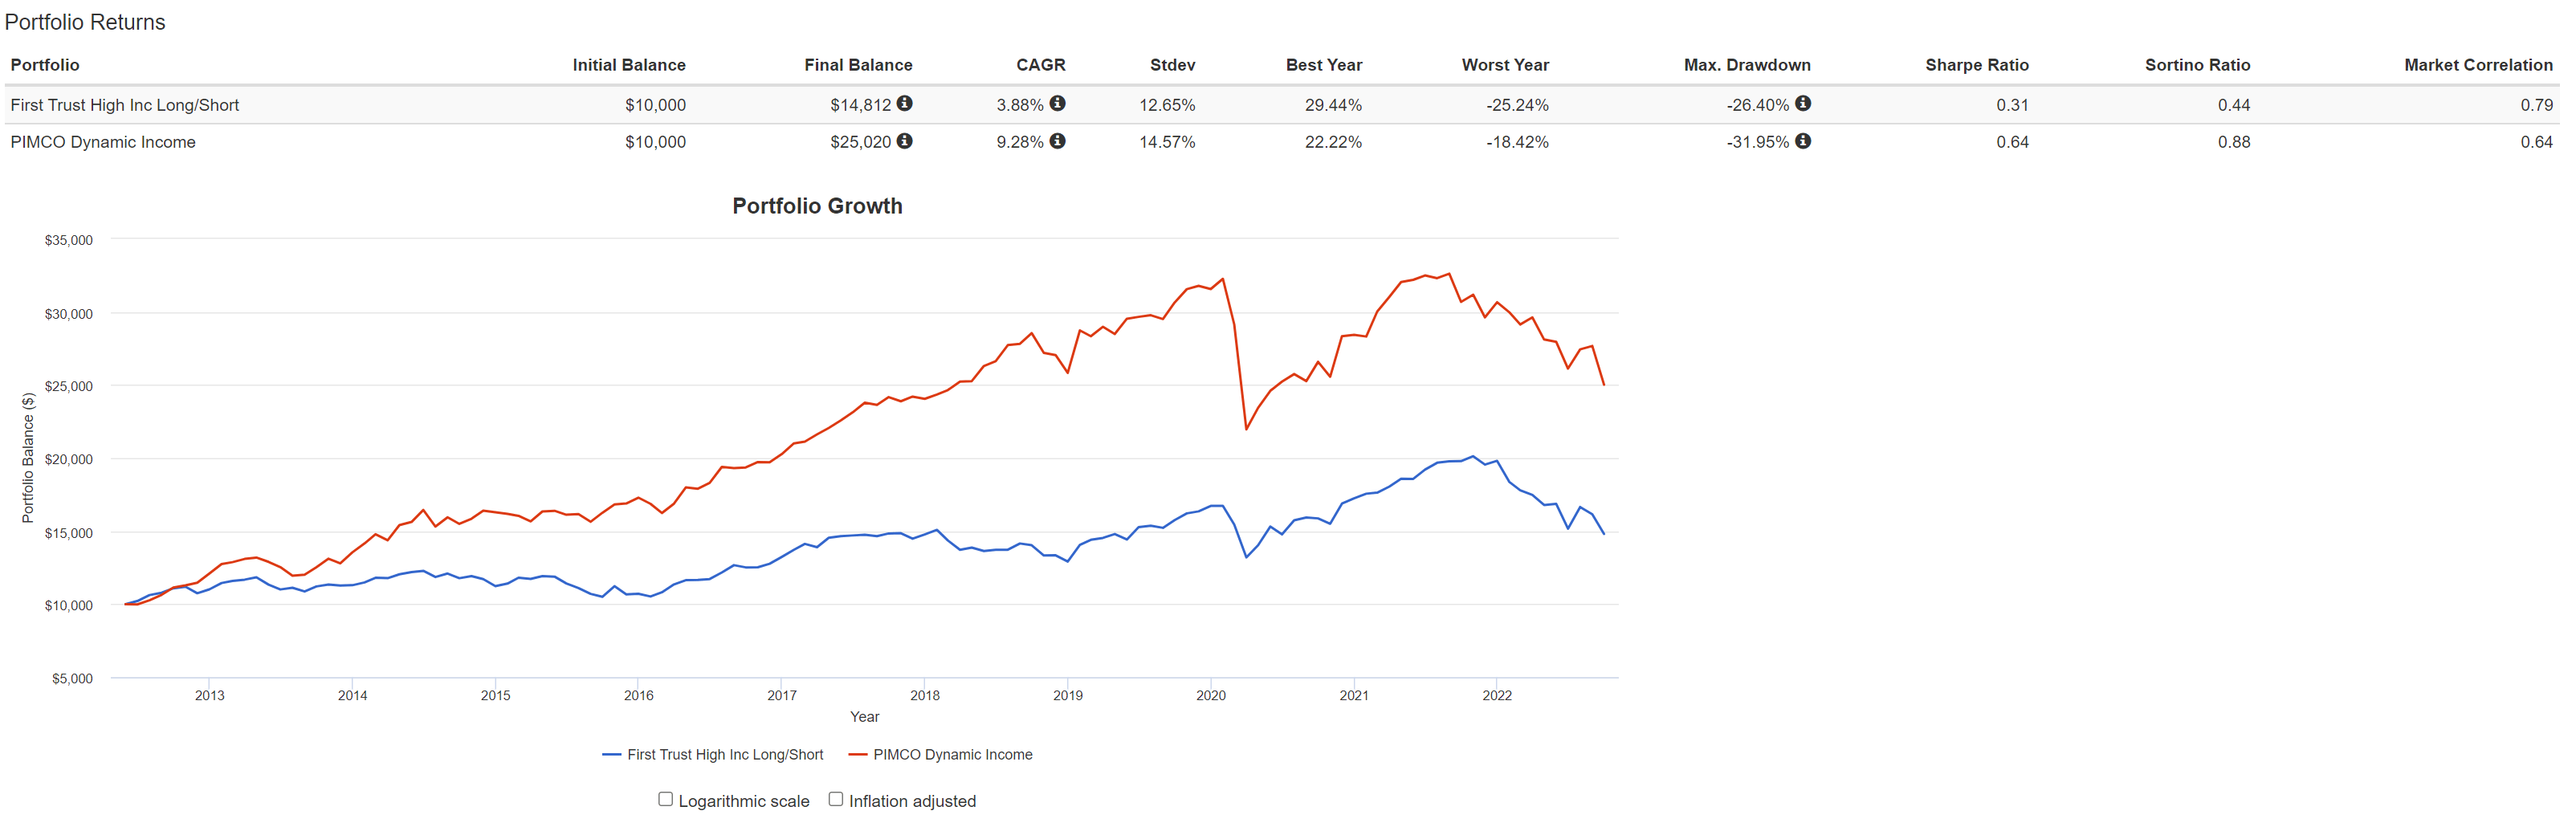
Conclusion
While the FSD fund’s 11.7% current distribution yield is attractive, investors are reminded that the fund’s portfolio does not earn sufficient income to pay the distribution without dipping into return of capital. If investors are intent on owning a levered credit fund into an economic downturn, I believe there are better alternatives out there such as the PIMCO Dynamic Income Fund which has a far superior historical performance along with a higher current distribution yield that is well covered by investment income.
Be the first to comment