

kabVisio/iStock via Getty Images
Pair Trade Investment Thesis
In an economic context where inflation is hot, interest rates are rising and a recession may be on its way, one of the best pair trades for such a phase of the economic cycle is to buy McDonald’s (NYSE:MCD) and sell Texas Roadhouse (NASDAQ:TXRH). I look at the restaurant industry for two reasons:
- The need for food will always be present and, especially in the U.S., the average consumer doesn’t like to cook always at home. This makes the restaurant industry somewhat recession proof, especially in the fast food segment.
- Restaurants are businesses that do not require significant working capital to work and can actually operate with negative working capital. In fact, restaurants usually sell cooked food and get paid before paying their suppliers for the primary goods bought. This is a business model that benefits from high inflation as every dollar collected, has more value than the dollar to be paid to the supplier because of the different timing between the two moments.
Here are the main causes I think will lead the two stocks to trade differently, as a result of the expected performance of the two businesses:
- In relationship with MCD, TXRH was the least correlated stock in the industry in the past quarter with a 38% correlation.
- MCD and TXRH have two different business models, with the former being heavily franchised and the latter choosing to own and run directly the majority of its restaurants. MCD’s franchising is a business model that offers stable and predictable revenue that is converted into free cash flow. MCD’s revenues come from royalties, rents and fees. In a recession, this model offers more stability and can attract investors, whereas in an economic expansion TXRH would perform better because its revenues come directly from increasing sales and increasing restaurants’ profitability. MCD has more geographical diversification, which offers a hedge against recession in certain areas, whereas TXRH is highly concentrated in the U.S., with a strong exposure to Texas and Florida, thus making it weaker in case of an American recession.
- In the current environment, many commodities still see very high prices. MCD’s size allows it to control its suppliers and to bargain with them in a better way than TXRH. Moreover, the price of beef is increasing dramatically and TXRH is more exposed to this commodity than MCD, with the result that the former will likely see its margins shrink more than MCD’s.
- MCD offers food at a lower price than TXRH. In case of a recession, I expect consumers to move towards low-cost restaurants, a shift in spending that should benefit MCD over TXRH.
- MCD’s financials focused on increasing margins over the past decade, while TXRH is still in growth mode and sees a topline increase which is not yet fully reflected in the bottom line. Thus MCD, even though it has more debt than TXRH, has enough space in financials to take the possible hit of a recession (if we assume, which must be proved, that MCD will decrease its sales)
The Context
We all know about record-high inflation and the uptick in interest rates that the FED is approving month after month. However, even though there is much talk about it, we still don’t know if and when a recession is coming. The U.S. GDP in the first quarter of 2022 was down -1.6%. While we will have to wait about three months to have the official data for the second quarter, the Atlanta Fed has a model that provides a “nowcast” of the GDP for the current quarter. Its latest estimate saw U.S. GDP at -2.1% for the second quarter. Technically, one of the main facts that is looked at to call a recession is the negative economic growth in two consecutive quarters. We will see later how MCD and TXRH performed during the early stage of the great recession to get an idea of how they could perform during the upcoming one.
Secondly, even though over the past year we saw wages go up as employees leveraged the strength a tight labor market gave them to get salary hikes, according to the U.S. Bureau of Labor Statistics, the real average hourly earnings over the 12 months ending in May 2022 went down 3%. This is a consequence of inflation that is denting purchasing power up.
Thirdly, as we can see from the graph below, the personal savings rate is decreasing rapidly, and in May 2022 was at 5.4% of disposable income. The three spikes after 2020 represent the three stimulus checks given by the government. As we can see, even though for a few months Americans seemed to keep the saving rate up, now the percentage is back to average.
St. Louis Fed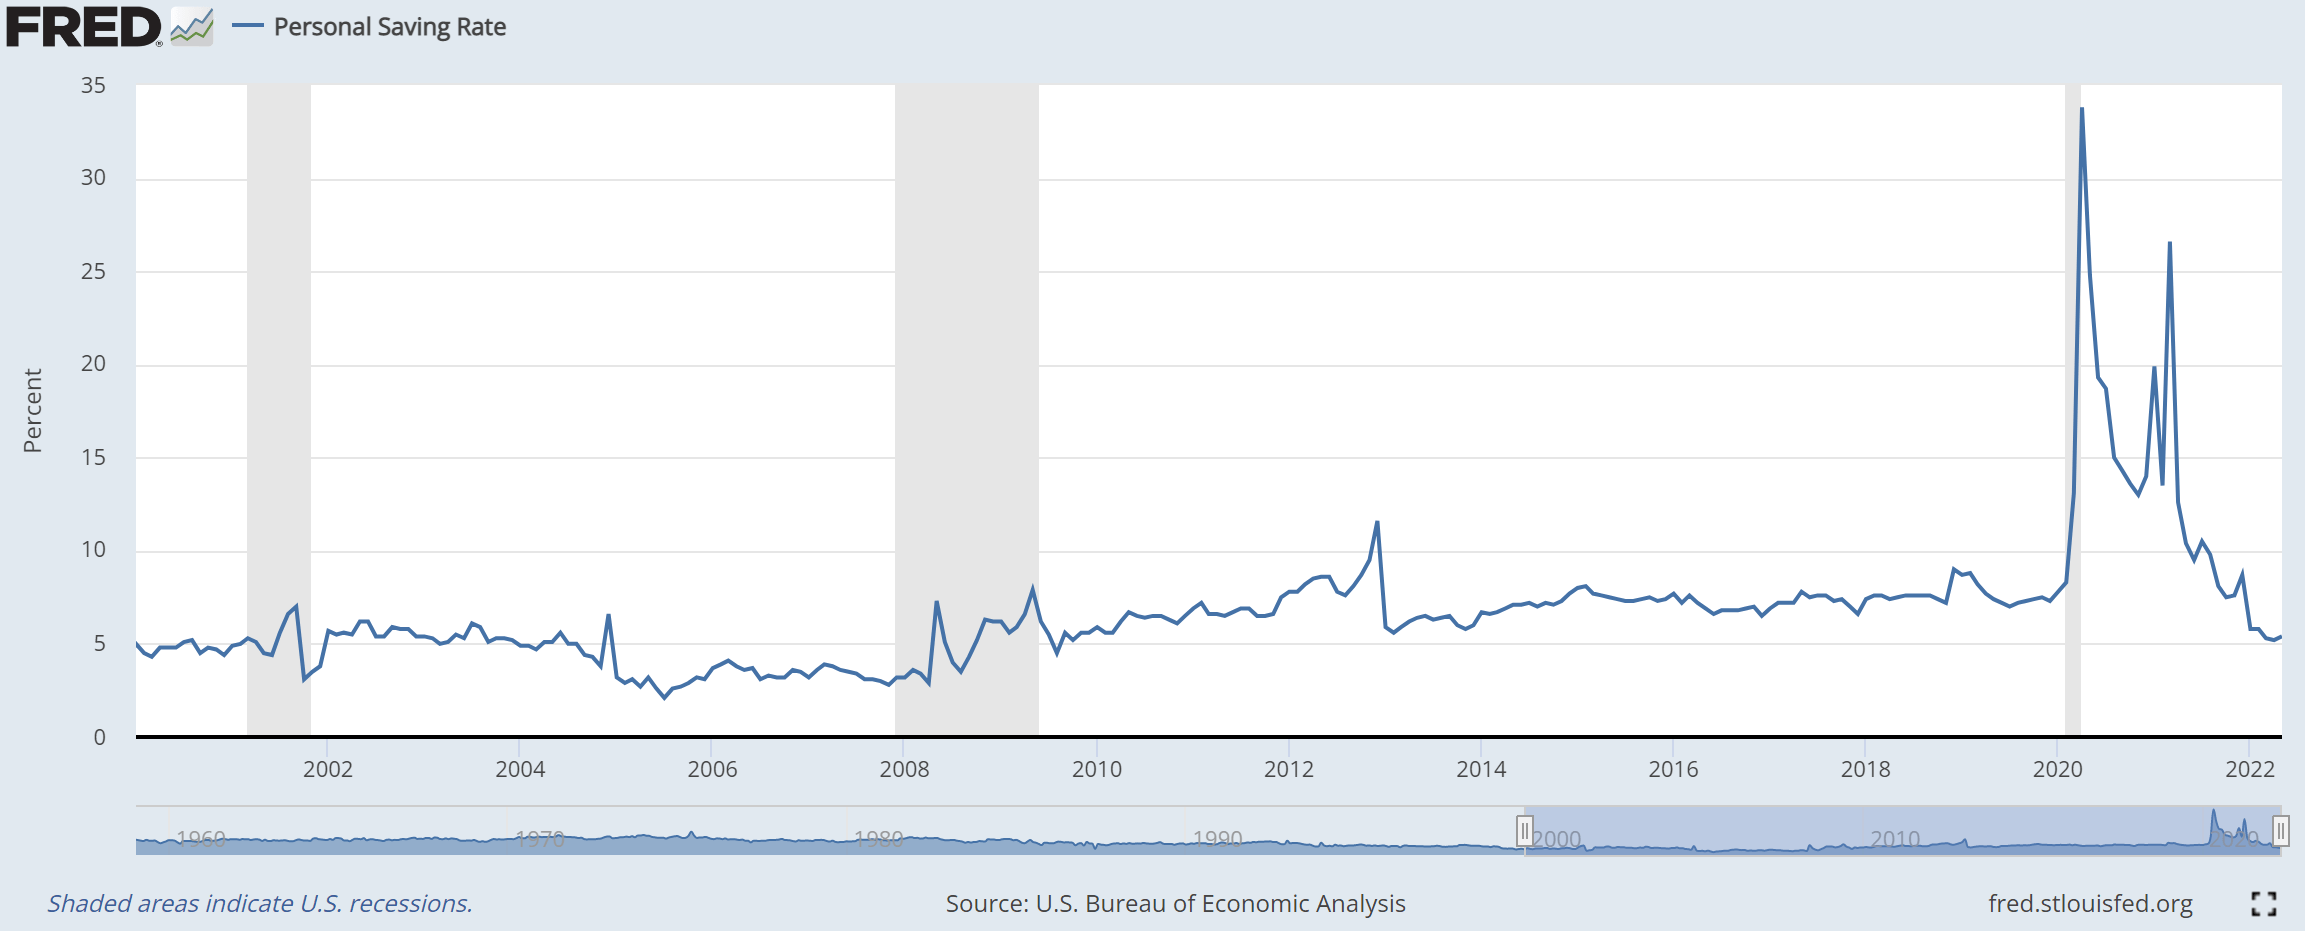
This means that, either by choice of out of necessity, Americans, on average, are not saving a lot of money now. This can have two explanations: Americans either feel confident about their household balance sheet, or they can’t save more than this due to a high cost of living. In both cases, a low personal savings rate makes households a bit weak in case of layoffs and a recession. In order to keep up at least with this saving rate, I expect many households to cut their spending on extras or to move towards low-cost solutions for their needs.
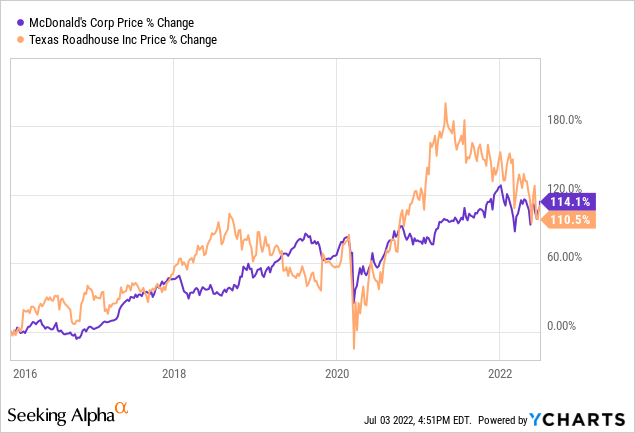
1. MCD and TXRH correlation
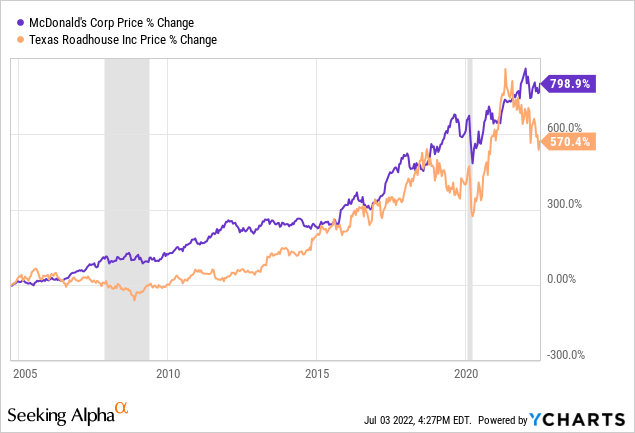
This is the chart that shows MCD and TXRH since the latter’s IPO in 2004. Highlighted are the two last recessions. As we can see MCD has outperformed TXRH. If we notice, starting from the quarters before the great recession, the spread between the two started to widen and it was closed only in 2015. We then see that they traded for a couple of years upwards to then split apart once more around 2018. Finally, as soon as the 2021 bull market came to an end, the % change between the two widened.
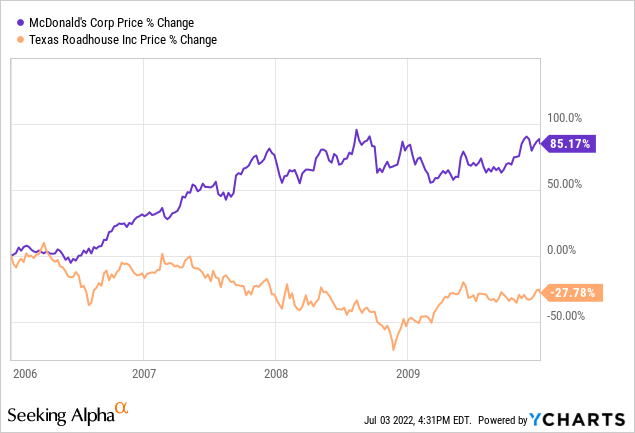
Let’s zoom in the graph. Already in the second half of 2006 MCD started to outperform TXRH. The correlation diminished as the 2007 housing market issues started to come up; in 2008 the spread between the return of the two stocks widened the most. Then, as the stock market bottomed, we see the two stocks trade once again in a closer correlation. We will see later that a recession has more headwinds for TXRH than MCD due to their different business model. The stock returned accordingly this:
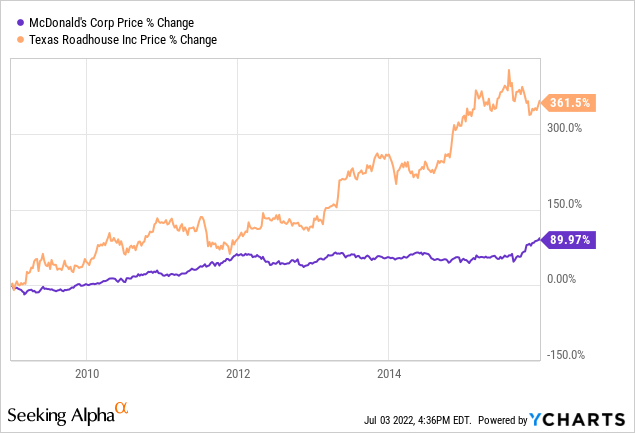
But as the economy started to recover, we see that TXRH began to outperform MCD. Starting from 2009 and then, more clearly, from 2012 to 2015 TXRH returned more than 3 times MCD for those investors who picked it up at the beginning of 2009. This can be understood because, as TXRH was (and still is) on growth mode more than MCD, it was able to benefit more from a recovering economy where consumers started spending more.
As the economic cycle moved towards its maturity, both MCD and TXRH trended upwards in 2017, but then separated once again during 2018, when MCD started being hurt by decreasing guests. But, most interestingly, the stocks were not correlated during last year’s bull market.
Over the past year, the two stocks split apart from each other once again, but this time, just like in the second half of 2006, MCD outperformed TXRH, as an early sign that investors are starting to price in a possible recession.
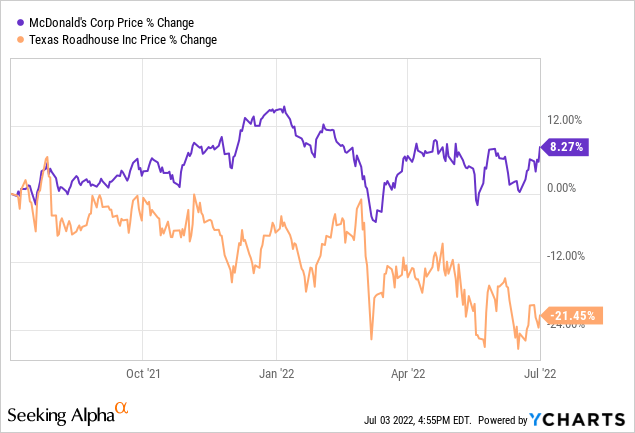
In fact, both companies, as we will see, reported in 2021 outstanding results and, perhaps, TXRH did even better than MCD. This, however, didn’t prevent investors from shifting to MCD’s reliability rather than TXRH’s growth.
From a historical point of view, the market suggests to buy MCD and sell TXRH as we prepare for a recession. True, one could argue that the spread between the two already prices in a recession. However, I do believe that, in case U.S. GDP for the second quarter will be negative, the market will see some red days. In other words, I still think that a recession is not fully priced in, as most analysts have not yet revised downwards earnings estimates. Historical performance can’t be the only guide for the future, but, as far as we are concerned, it says to buy MCD and sell TXRH.
2. Business Models
MCD
MCD currently sees 40,031 restaurants around the world, 93% of which are franchised. As the company explains in its annual 2021 Annual Report:
Under a conventional franchise, the Company owns or secures a long-term lease on both the land and the restaurant building, while the franchisee pays for equipment, signs, seating and décor. […] Conventional franchisees contribute to the Company’s revenue, primarily through the payment of rent and royalties based upon a percent of sales, with specified minimum rent payments, along with initial fees paid upon the opening of a new restaurant or grant of a new franchise.
The average cost of opening a new MCD restaurant is about $4.4 million.
I think this is the key to understand why I believe MCD will be resilient during a recession. Its franchisees guarantee a minimum payment which provides MCD with a part of its revenue that is stable and predictable. Now, in a franchising model, franchises sales are clearly not recorded as revenues by the company, but the company’s revenues are in part a function of these sales. From a certain point of view, MCD can be compared to a landlord who will collect rent both in good and bad times as long as its tenants do not go bankrupt. In a recession, a business model that offers reliable income is more looked for by investors.
MCD doesn’t report the breakdown of its franchised revenues, stating that they include rent, royalties and initial fees. However, we can calculate what percentage of franchised sales become revenue for the company. MCD reported in 2021 a total of $102.68 billion in franchised sales. Franchised revenues were $13.09 billion, which is a 12.75% cut on franchised sales. Although a part of this revenue is linked to restaurants performance, another part (MCD doesn’t specify the percentages) comes from rents and initial fees which are revenues with no cost that go directly down to the bottom line.
As MCD is spread globally, it also has a hedge against slowing economies because it is exposed to many different markets which see different situations.
TXRH
TXRH owns and operates 566 restaurants and has 70 franchised restaurants in the U.S. and 31 internationally. The domestic franchise agreement requires the franchisee to pay a royalty fee of 4% of gross sales. This year, the average capital investment to open a restaurant is $6.3 million, which is more than MCD. The strategy is to offer high-quality affordable meals to a broad segment of consumers. The company started also launching two new brands: Bubba’s 33 that serves burgers, pizza and more in general scratch-made food and ice cold beer and Jaggers, a fast-casual restaurant which focuses more on burgers and chicken. While Bubba’s 33 is a bit more developed, Jaggers is still in its early stages. During the pandemic, the company also developed Texas Roadhouse Butcher Shop to ship directly to consumers’ homes most of the steaks that can be found at TXRH’s restaurants. For this pair trade analysis, it will be enough to focus directly on Texas Roadhouse restaurants, which are the vast majority of the company’s restaurants.
TXRH focuses only on dinner. Only half of its restaurants offer lunch on Friday. This can make it weaker in case of recession. Dinner away from home is usually perceived as an extra while breakfast and especially lunch sometimes have to happen away from home due to the consumers’ usual working locations. However, by focusing on dinner, TXRH can manage only one shift per day during the week and can have most of its employees work part time, with lower expenses for the company.
One last note, TXRH is still a U.S. company with 21% of its restaurants located in Texas and Florida. As a result, the company is more sensitive to economic trends in the U.S. and, especially, in these states. Its geography thus makes it weaker than MCD.
3. Commodity Inflation: Beef Price
The restaurant industry
In the U.S., before the pandemic, the restaurant industry registered sales for $773 billion. On average, every household spent about $3,500 a year on food away from home. Over the 2010-2019 decade, the CAGR of this spending was 3.5%, outpacing the average inflation and thus highlighting a growing trend of a consumer habit.
I think this trend will be somewhat supported by the current inflationary situation. In fact, in the last CPI release, it was reported that over the 12 months ending May 2022 food at home price increased by 11.9% (the largest increase since April 1979) while food away from home increased by 7.4% (largest increase since November 1981). This reduced a bit the gap between eating at home and eating away from home and could lead households to keep eating at restaurants. The reason behind the different increases is that restaurants have a larger scale and can bargain better prices for food. Furthermore, some companies are choosing to take a bit of a hit on their profits before passing onto customers the whole weight of inflation.
U.S. Bureau of Labor Statistics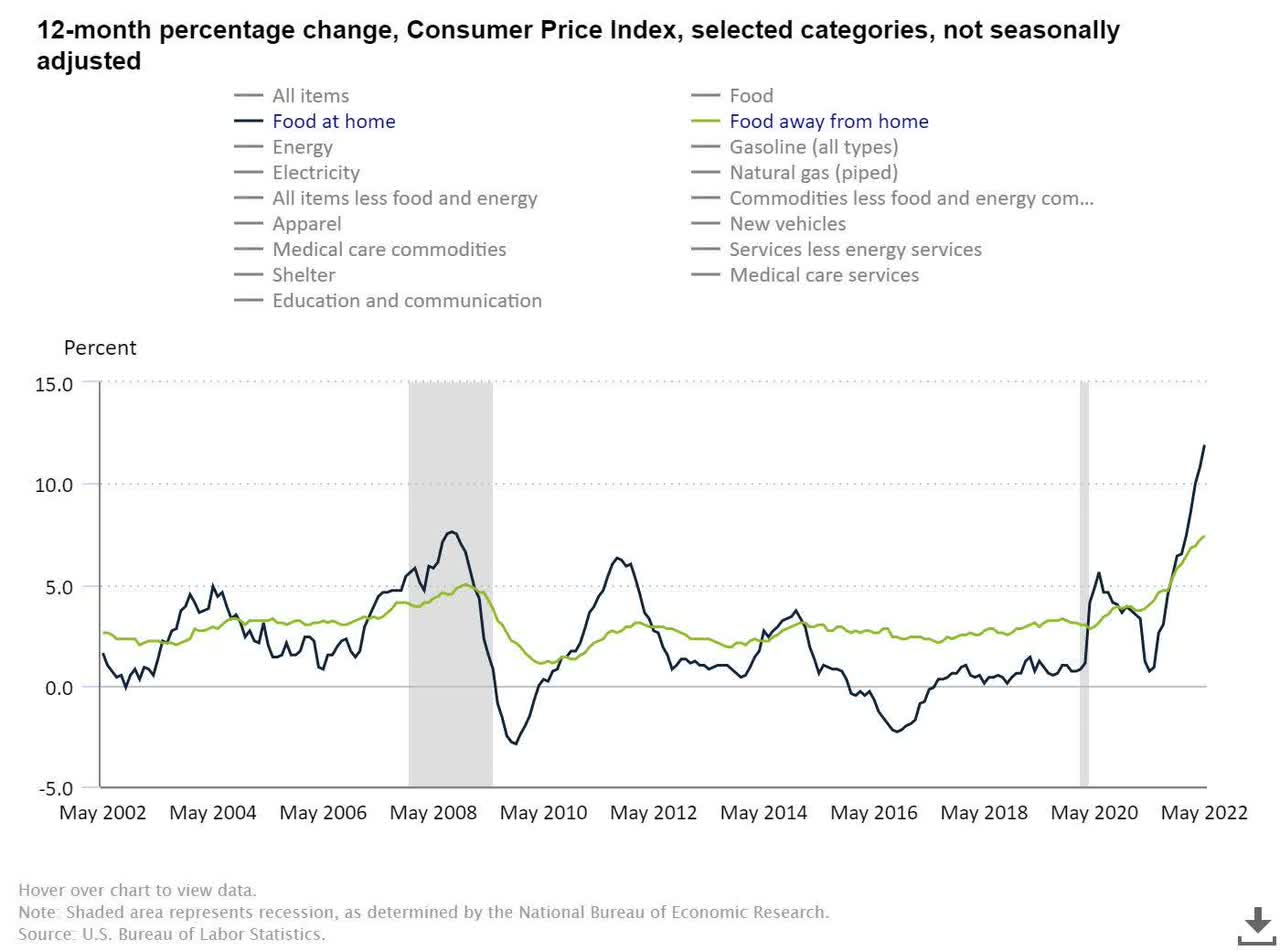
Beef cost
One last graph. Over the past two decades, while the average price for bread and chicken has increased very mildly, we are seeing beef price ramp up and spread away from the former two. This trend, as we will see, is particularly significant for TXRH, which is quite focused on beef.
U.S. Bureau of Labor Statistics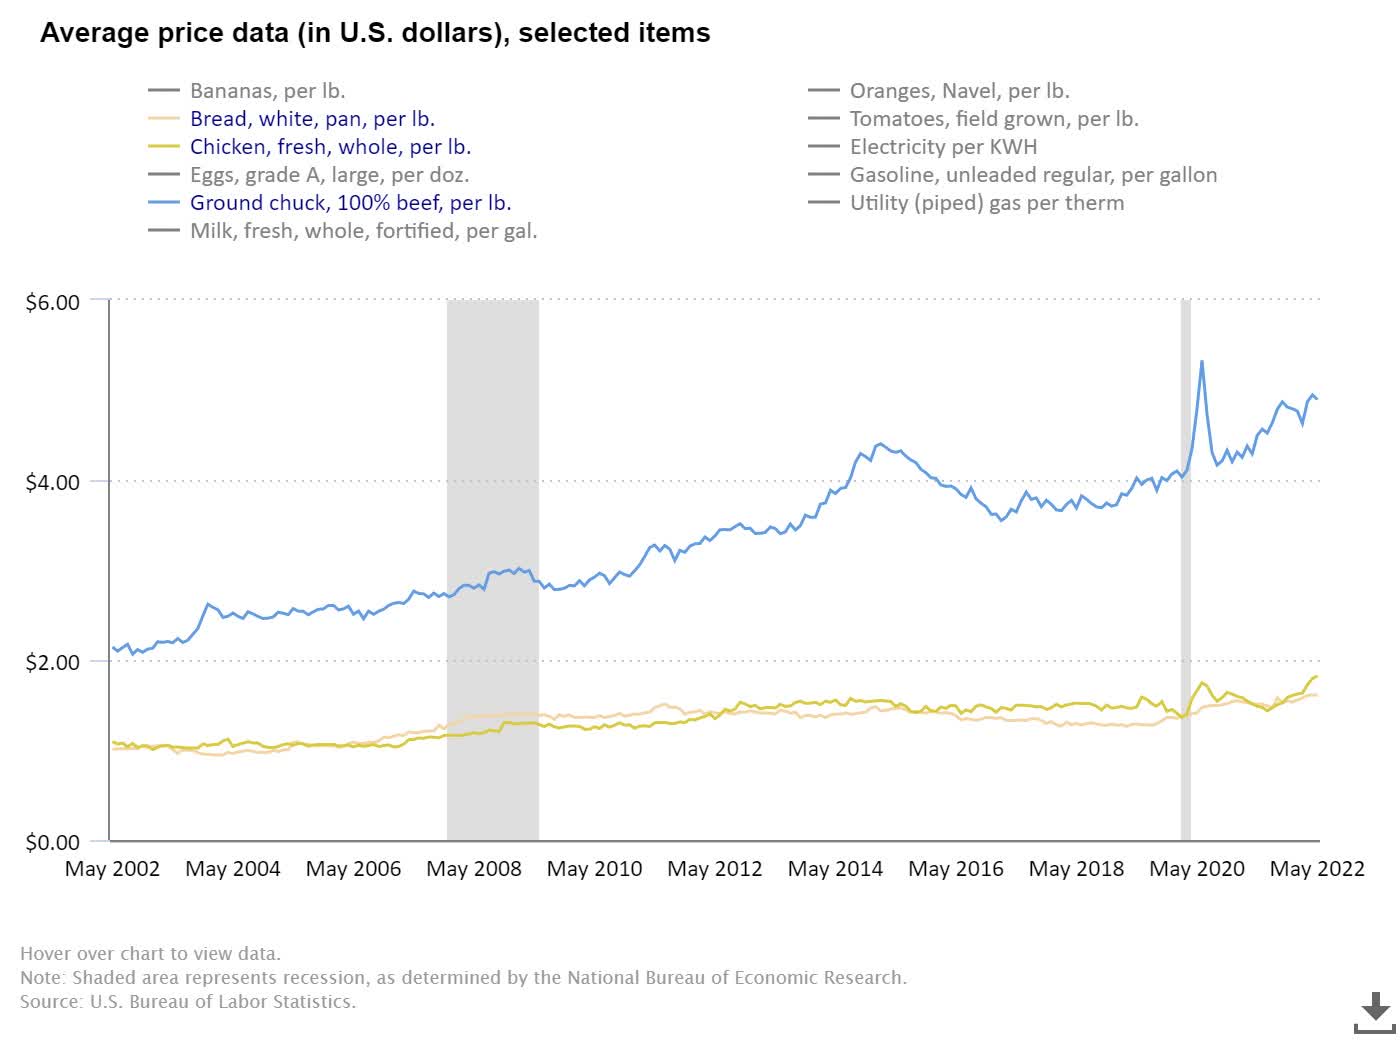
In fact, TXRH states in its 2021 Annual Report that the major commodity cost for the company is related to beef. The company reported a commodity inflation of 10% in 2021 and stated that approximately half of its food and beverage costs relate to beef costs. Moreover, its beef supply is highly dependent upon three vendors.
In normal times, TXRH focus on beef would distinguish it among competitors and provide a clear value proposition. However, in the current environment, it could make the company suffer more than MCD.
MCD doesn’t report its cost structure related to commodities. However, we know that for every burger the company also has to buy bread, vegetables and dressings. Furthermore, MCD also serves chicken and pork and is more diversified than TXRH. TXRH could thus enter into a recession with its margins already under pressure due to beef costs and would have to battle on pricing with this burden on its back. True, if the recession will be long, commodities should see their prices plunge, but the early stage of a recession could be very challenging even for a high-quality company as TXRH.
4. Average Tickets
MCD serves breakfast, lunch and dinner and every restaurant is open most of the day, offering low-cost food. MCD doesn’t disclose its average ticket, but from our everyday experience, we know a Big Mac Menu in the U.S. costs around $10. I would take this as a reference for an average. This price is competitive and will attract more customers when a recession will come in.
The average guest per check for TXRH owned and operated restaurants in 2021 was $19.68, while for the Bubba’s 33 restaurants it was $18.94. Thus, TXRH is about twice as expensive than MCD. I think that both the focus on dinner and the pricing expose TXRH more than MCD to decreased consumers’ spending in a recession.
5. Financials
MCD
MCD states that in order to assess its performance we need to look at comparable sales and free cash flow. Comparable sales take into account guest count and average check. Now, on both these two data, the company is not releasing any numeric data, but it simply states if they are going up or down.
This points out to a problem that MCD has been facing over the past decade: the company has indeed seen its guest count decrease. MCD has tried to face this by adopting a strategy that aimed at increasing the average check. However, as many analysts pointed out during different earnings calls, this strategy can’t last forever. During the Q3 2019 earnings call, for example, MCD’s CEO Steve Easterbrook had to declare once again that
US traffic was negative for the quarter and remains our biggest opportunity, we benefited again from a healthy average check increase, driven by both product mix changes and menu pricing.
Recently, MCD’s CEO Chris Kempczinski addressed this problem at the Evercore ISI Consumer and Retail Conference. When asked to explain MCD’s velocity growth plan, he said that MCD had been losing customers for two main reasons: strong competition and straying away from MCD’s core menu. These are his words:
velocity growth plan was focused on winning back the customers that we had lost to frankly our competitors and we had diagnosed through that work that about 70% of our share losses had gone to our closing competitors and a lot of that focus was then about just getting the foundations right, fixing the business, we needed to modernize the estate in the U.S. which had gotten very tired looking, we needed to do some things around product quality which we did around the world, and that gave us some great success. […] Our core menu represents 70% to 80% of our business and I think frankly we had gotten a little distracted chasing line item, line extensions and other things through regrounding and our core menu is another component of it.
MCD is thus increasing its advertising costs which in 2021 reached $377 million, up 15% from 2020 and 3% from 2019.
Let’s take a look now at MCD’s results from 2007 to 2022 (2022 is a forecast). I start from 2007 because I want to keep in mind what happened during the great recession. As we can see, MCD’s top line is not really growing but, over this time span is quite flat. Actually, up to the pandemic total revenues were declining.
Author using data from MCD Annual Reports and Seeking Alpha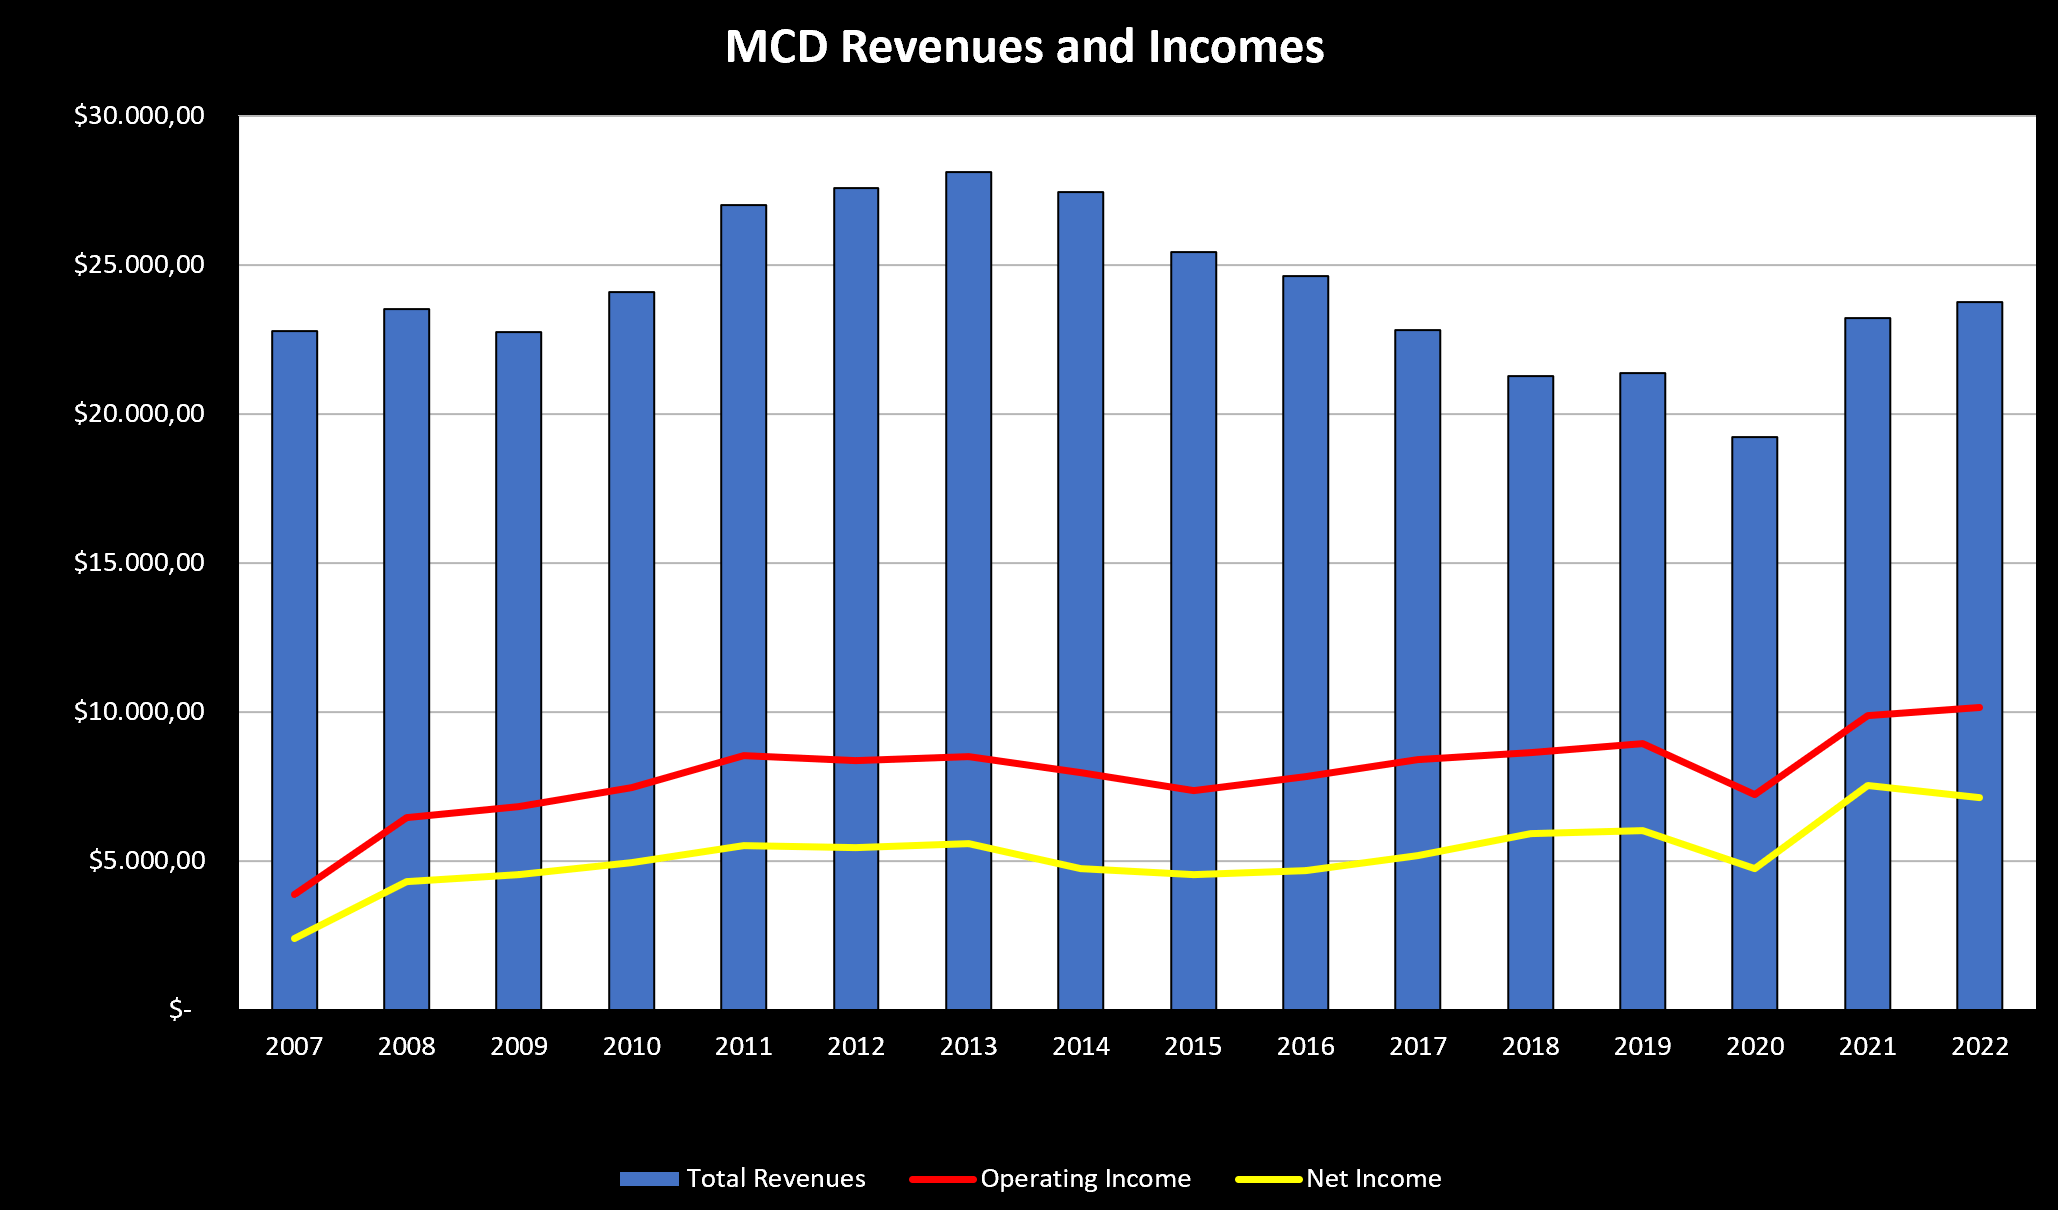
But, as the top line didn’t really impress, MCD kept on pushing up its operating income and its net income. In other words, MCD is able to keep its margins up, as we can see from this other graph below.
Author using data from MCD Annual reports and Seeking Alpha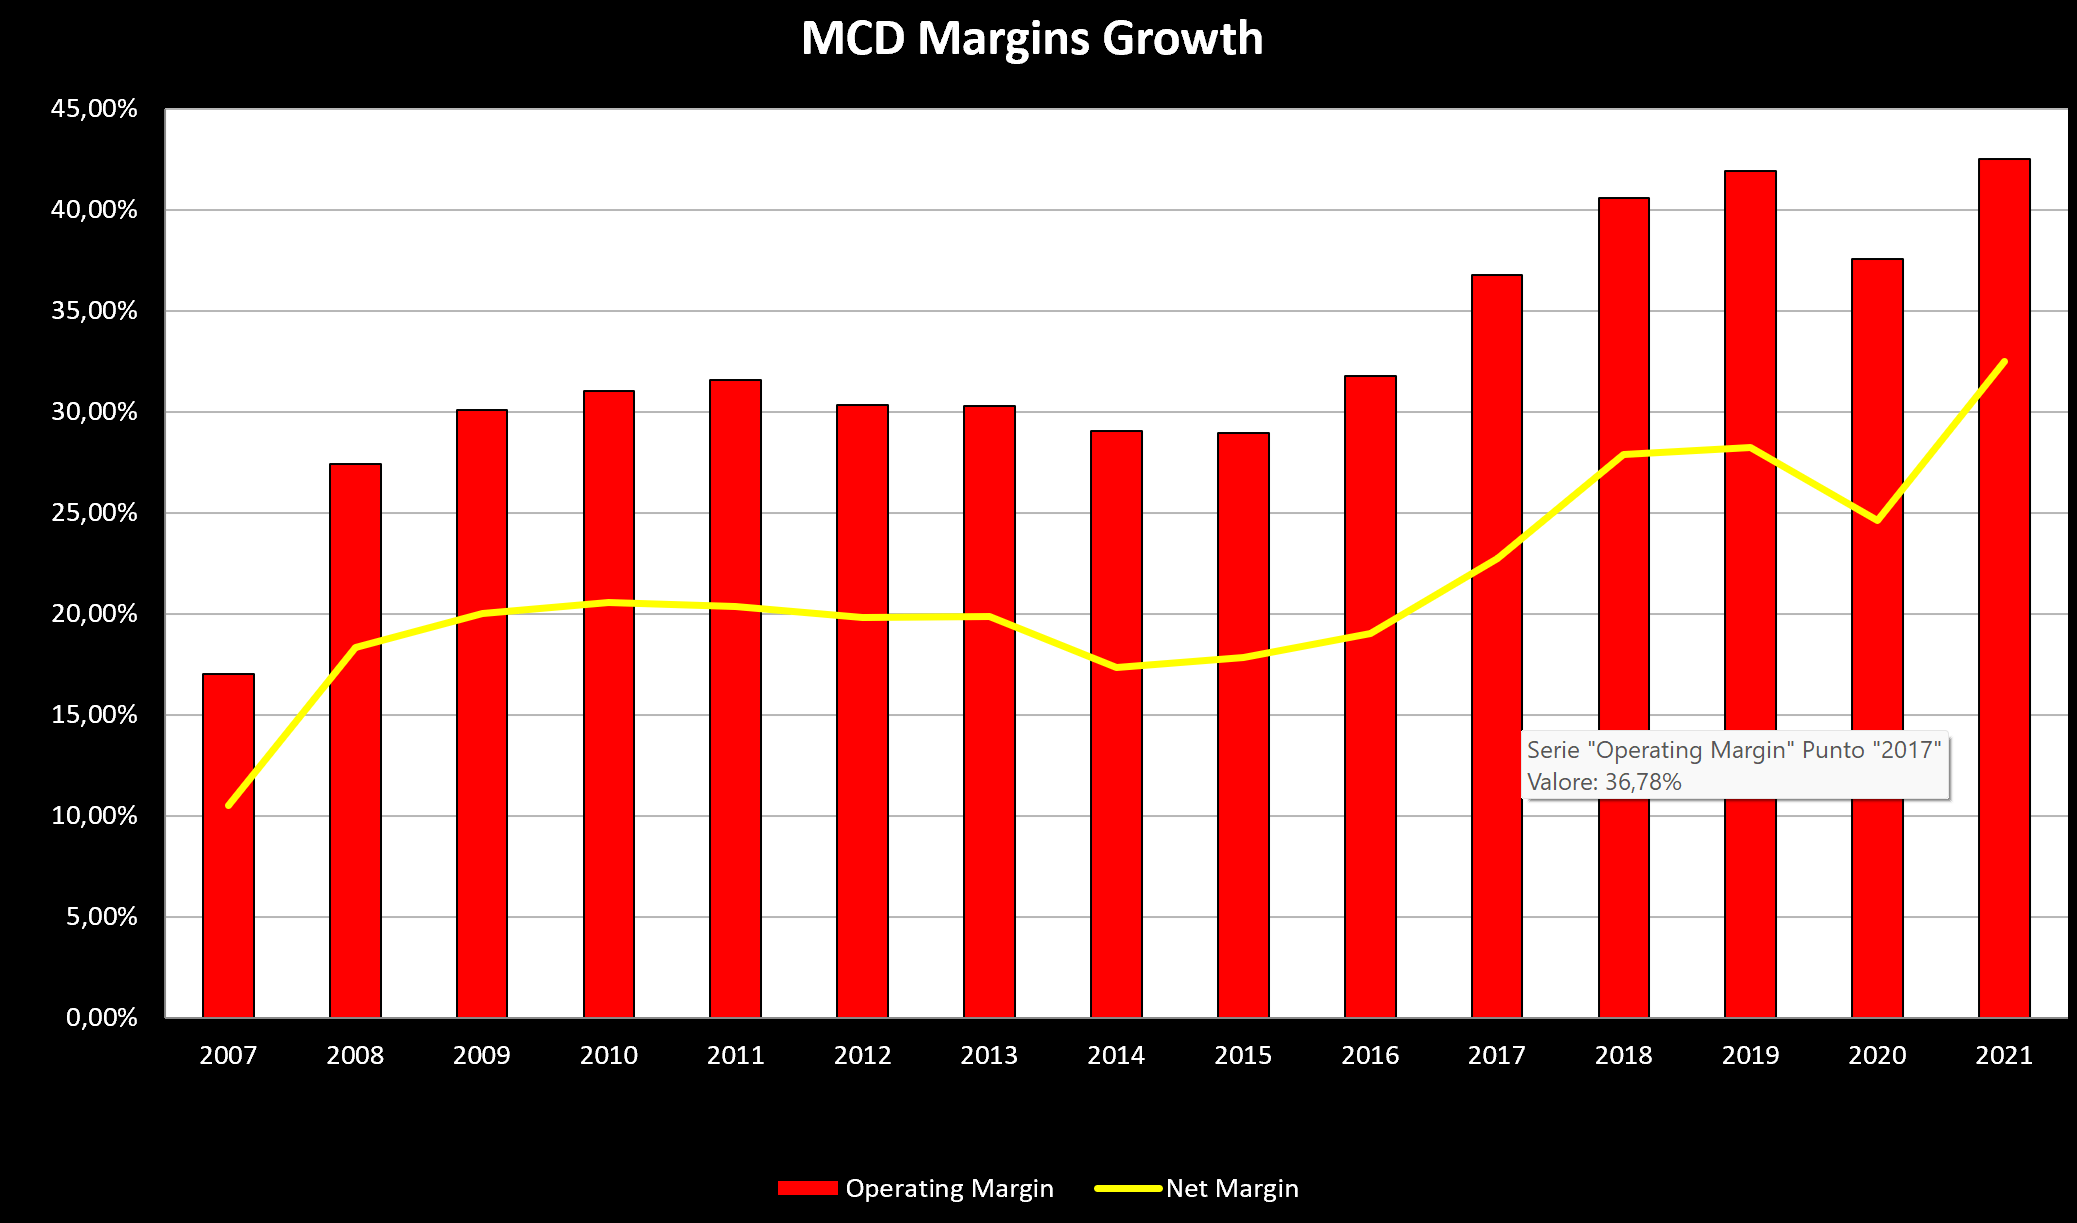
This paints a clear picture: MCD is a mature company that in the past has been focusing on margins more than growth. MCD’s margins are indeed outstanding. Operating margin more than doubled from 2007 to 2021 and is now at 44.6%. Net margin is well above 30%. These are metrics that are usually seen in the luxury industry, not among restaurants. We have to keep in mind that 85% of these margins come from franchised restaurants, with the remaining 15% coming from the company-operated ones:
MCD 2021 Annual Report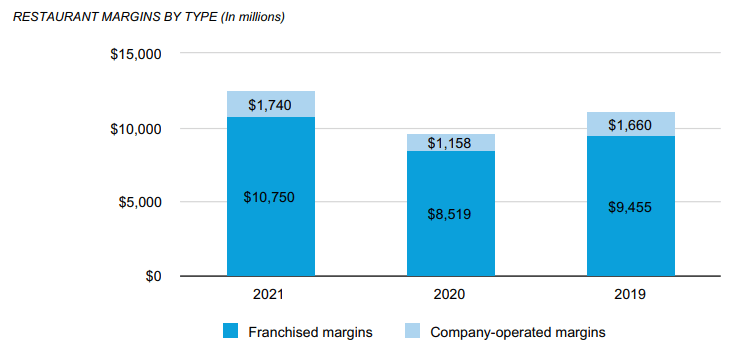
In fact, the company is committed to increasing net profit by reducing operating costs, as we can see from this graph taken from Seeking Alpha showing decreasing cost of revenues over the past decade:
Seeking Alpha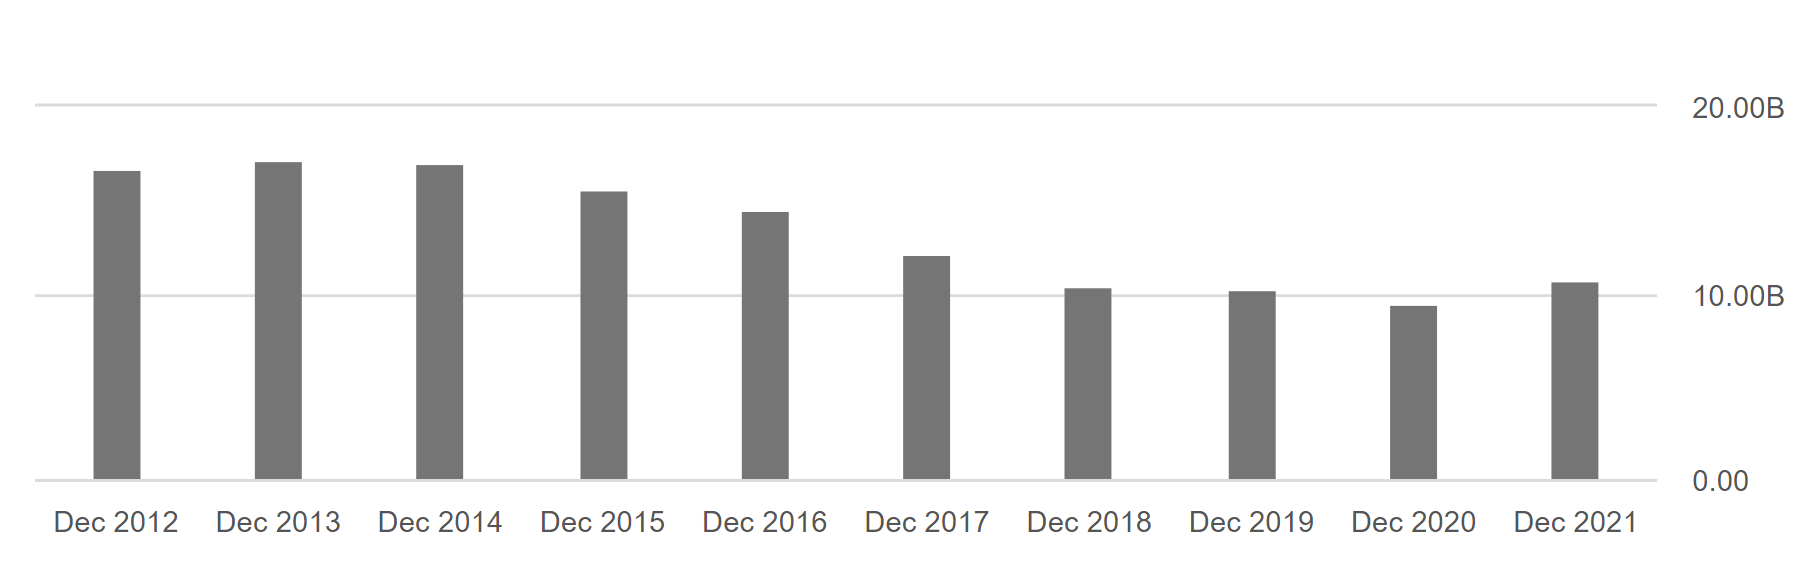
SG&A, too, is decreasing in value from $2.46 billion in 2012 to $2.38 in 2021. However, compared to total revenues the percentage moved up from 8.9% of revenue in 2012 to 10.2% in 2021.
Increasing margins and decreasing expenses all lead to a growing free cash flow, the most important metric investors are looking at right now to pick the companies with the strength to weather any economic headwind. MCD from 2012 to 2021 has increased its FCF by 88%, from $3.5 billion all the way up to $6.57 billion, as shown in this graph:
Seeking Alpha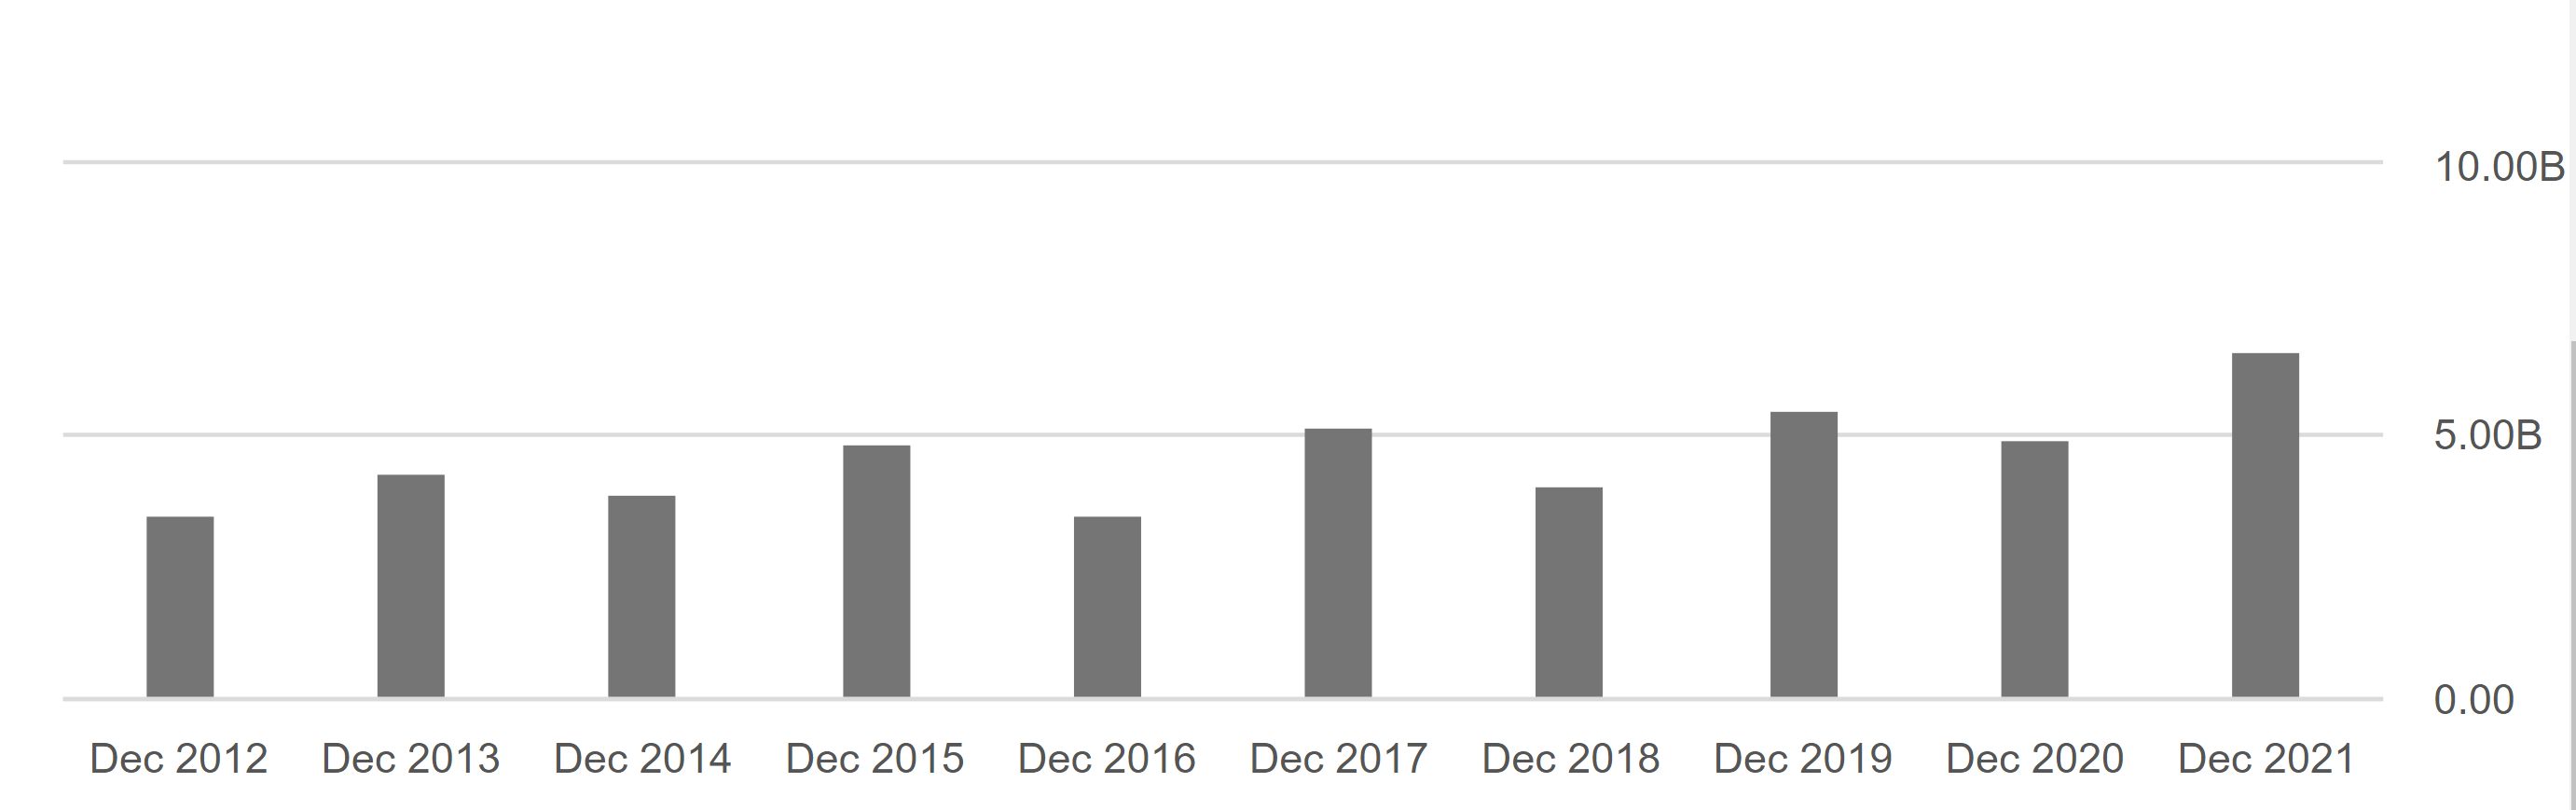
If we add in an increasing dividend and share buybacks, we can understand why MCD has been an investors’ favorite for many years even though its growth seemed to reach a peak. As we can see, MCD offers a healthy dividend yield, supported by a sustainable payout ratio and a 5-year growth that is at pace with current inflation.
Seeking Alpha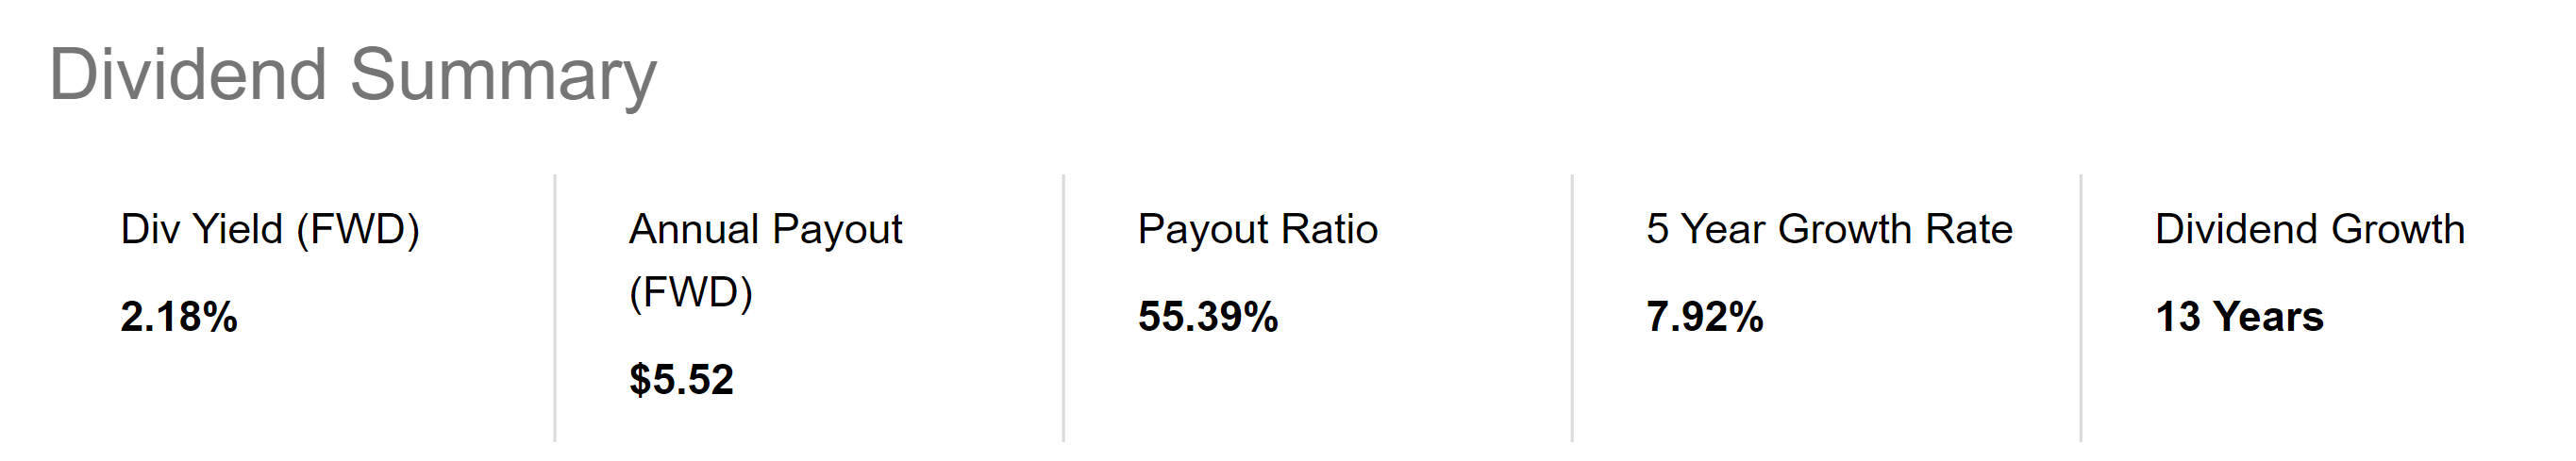
MCD’s balance sheet carries a debt of $47.59 billion which is about 4x its 2021 EBITDA of $11,74 billion. I usually prefer a debt/EBITDA ratio below 3, but in an inflationary environment, this debt is going to become less expensive if MCD is able to pass onto customers inflationary pressure. Keep in mind that MCD states that 95% of its debt is a fixed-rate debt and the weighted average annual interest of total debt is 3.2%, way lower than the current inflation rate over 8%. Thus, if MCD is able to pass onto customers its costs, its debt will become cheaper and less relevant. But can MCD do this?
We can use the famous Big Mac Index. We will see that between 1986, when the index was started, and today a Big Mac’s price went up from $1.60 to $6.05. This is a 378.13% increase over a 36-year time span. If the price had simply followed the normal inflation, a Big Mac would now cost only $4.27 which is a 266.88% increase. MCD has always been ahead of inflation. In particular, just in the past 10 years, MCD has increased its Big Mac price by 40%, while CPI has gone up only by 22%.
The Economist, Federal Reserve of Minneapolis, DataDrivenInvestor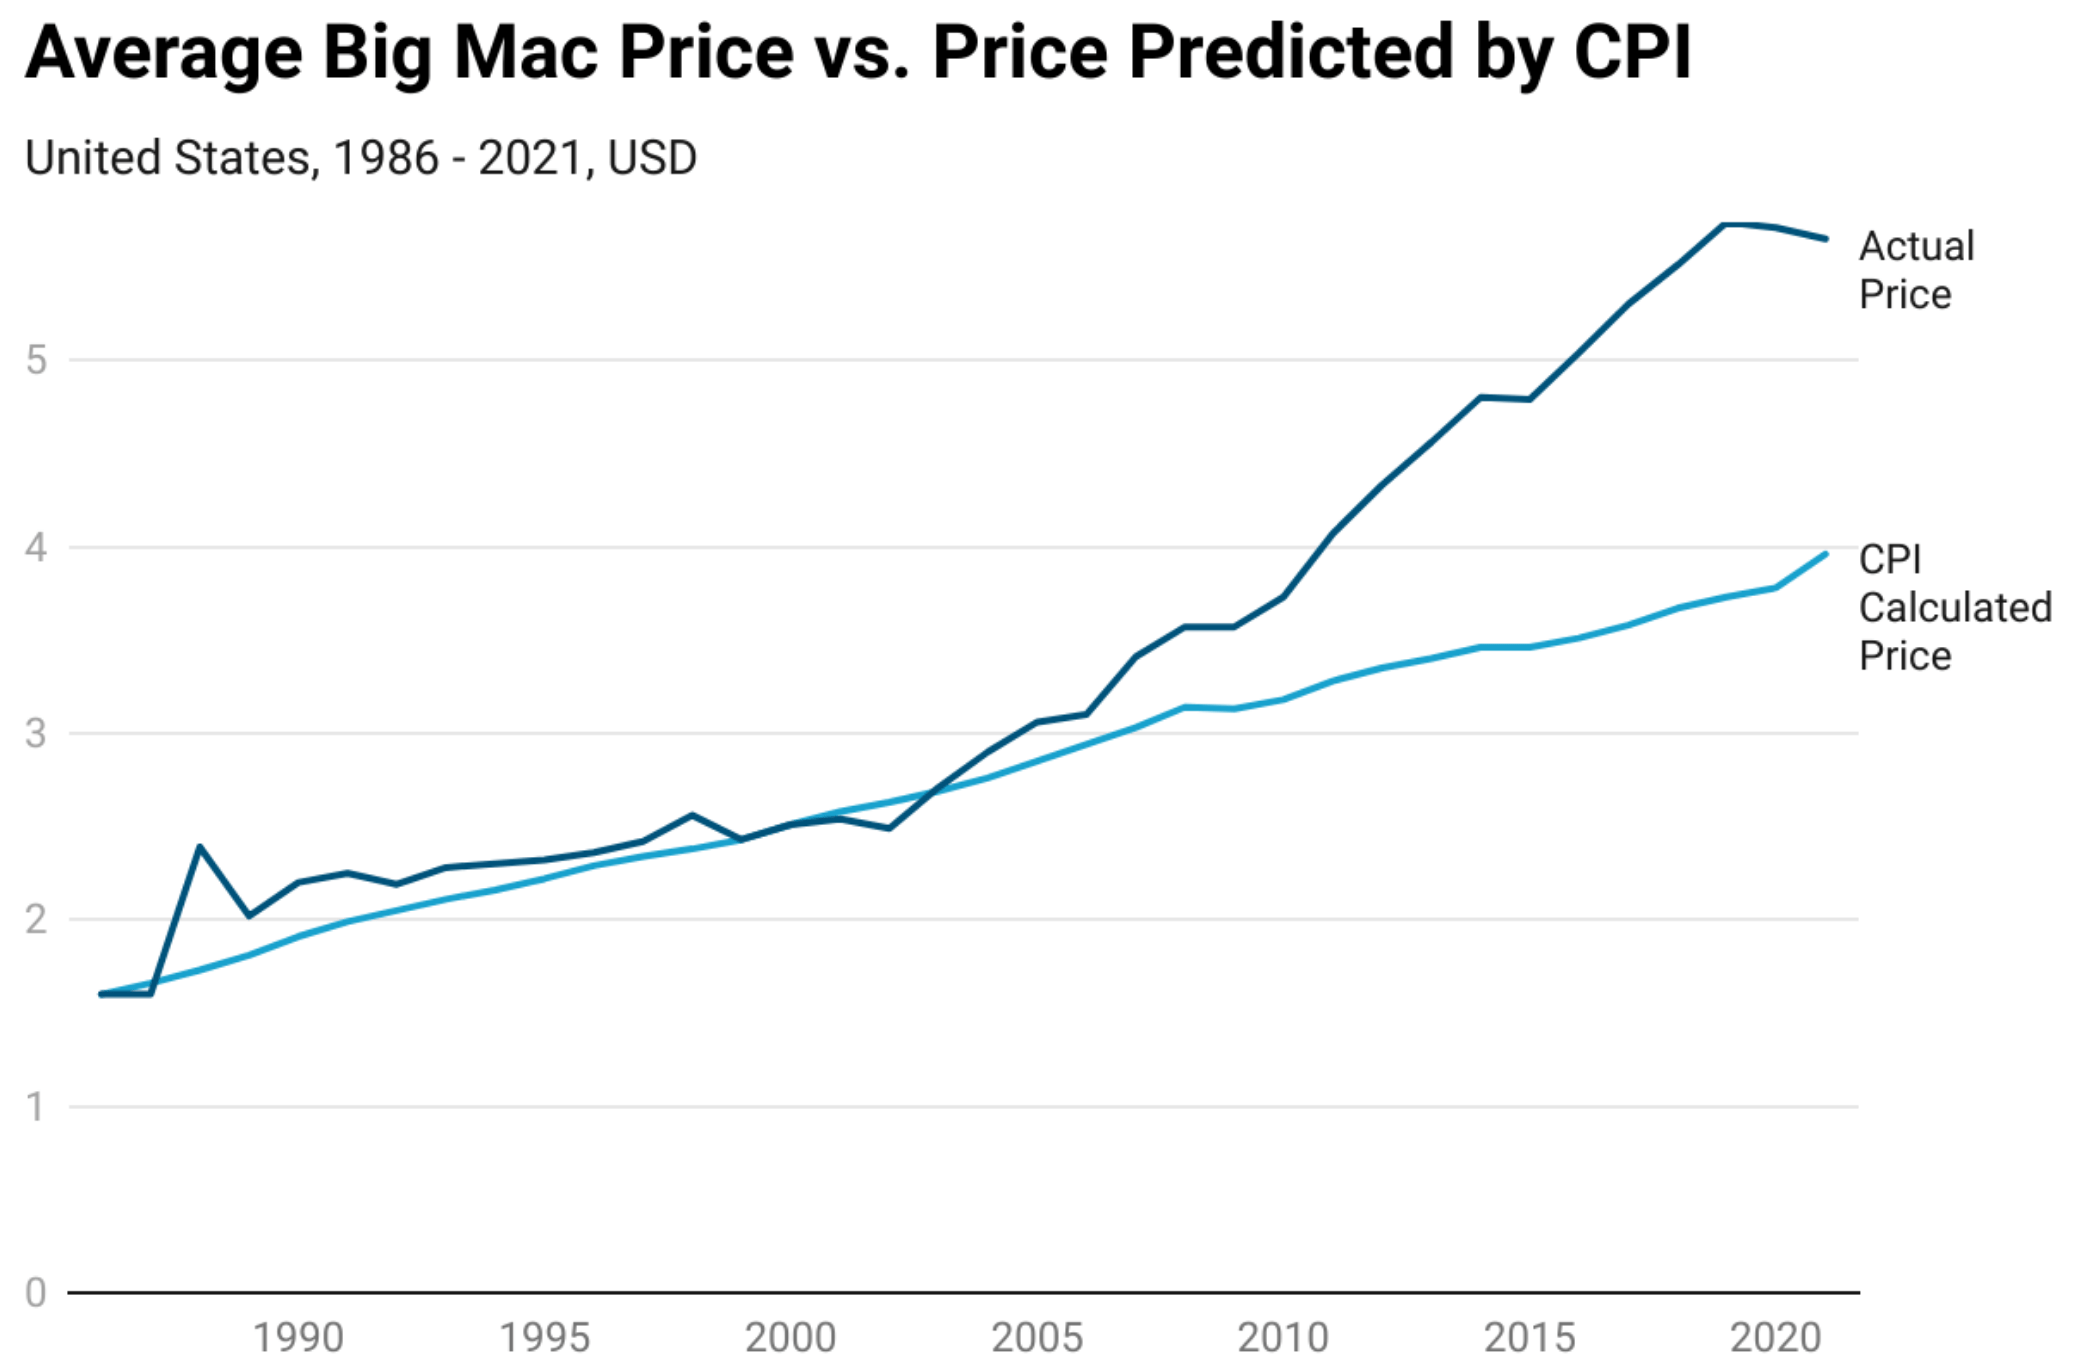
This proves that MCD is able to pass onto customers more than the average inflation, raising its Big Mac Price, on average, by 1% more than the recorded CPI. As a consequence, MCD’s debt/EBITDA ratio will improve rather quickly.
MCD has also $2.36 billion in cash. The company doesn’t hold too much cash on its balance sheet for the simple reason it doesn’t need to. This is why it has been able to return so much cash to shareholders over the years.
During the great recession, MCD was still able to grow its margins and become year over year more profitable, as shown from the graphs above. Furthermore, MCD is less exposed to beef than TXRH, as we have seen.
Now, even though MCD has somewhat found it difficult to grow its top line, its focus on margins and its predictable and increasing stream of free cash flow make it resilient in a recession. This is why the stock is down only 5% YTD compared to SPY’s -20% YTD. I actually think that this slight correction in MCD stock price reflects the dismissing of operations in Russia, which accounted for roughly 2% of worldwide sales.
TXRH
Historically the most significant means of achieving growth for TXRH has been through opening new restaurants and operating these restaurants on a profitable basis. As we can see from the graph below, TXRH has grown its revenues impressively. However, operating income and net income still account for a minor part of the revenues, as the company still has not fully transitioned to maximizing its profitability.
Author using data from TXRH Annual Reports and Seeking Alpha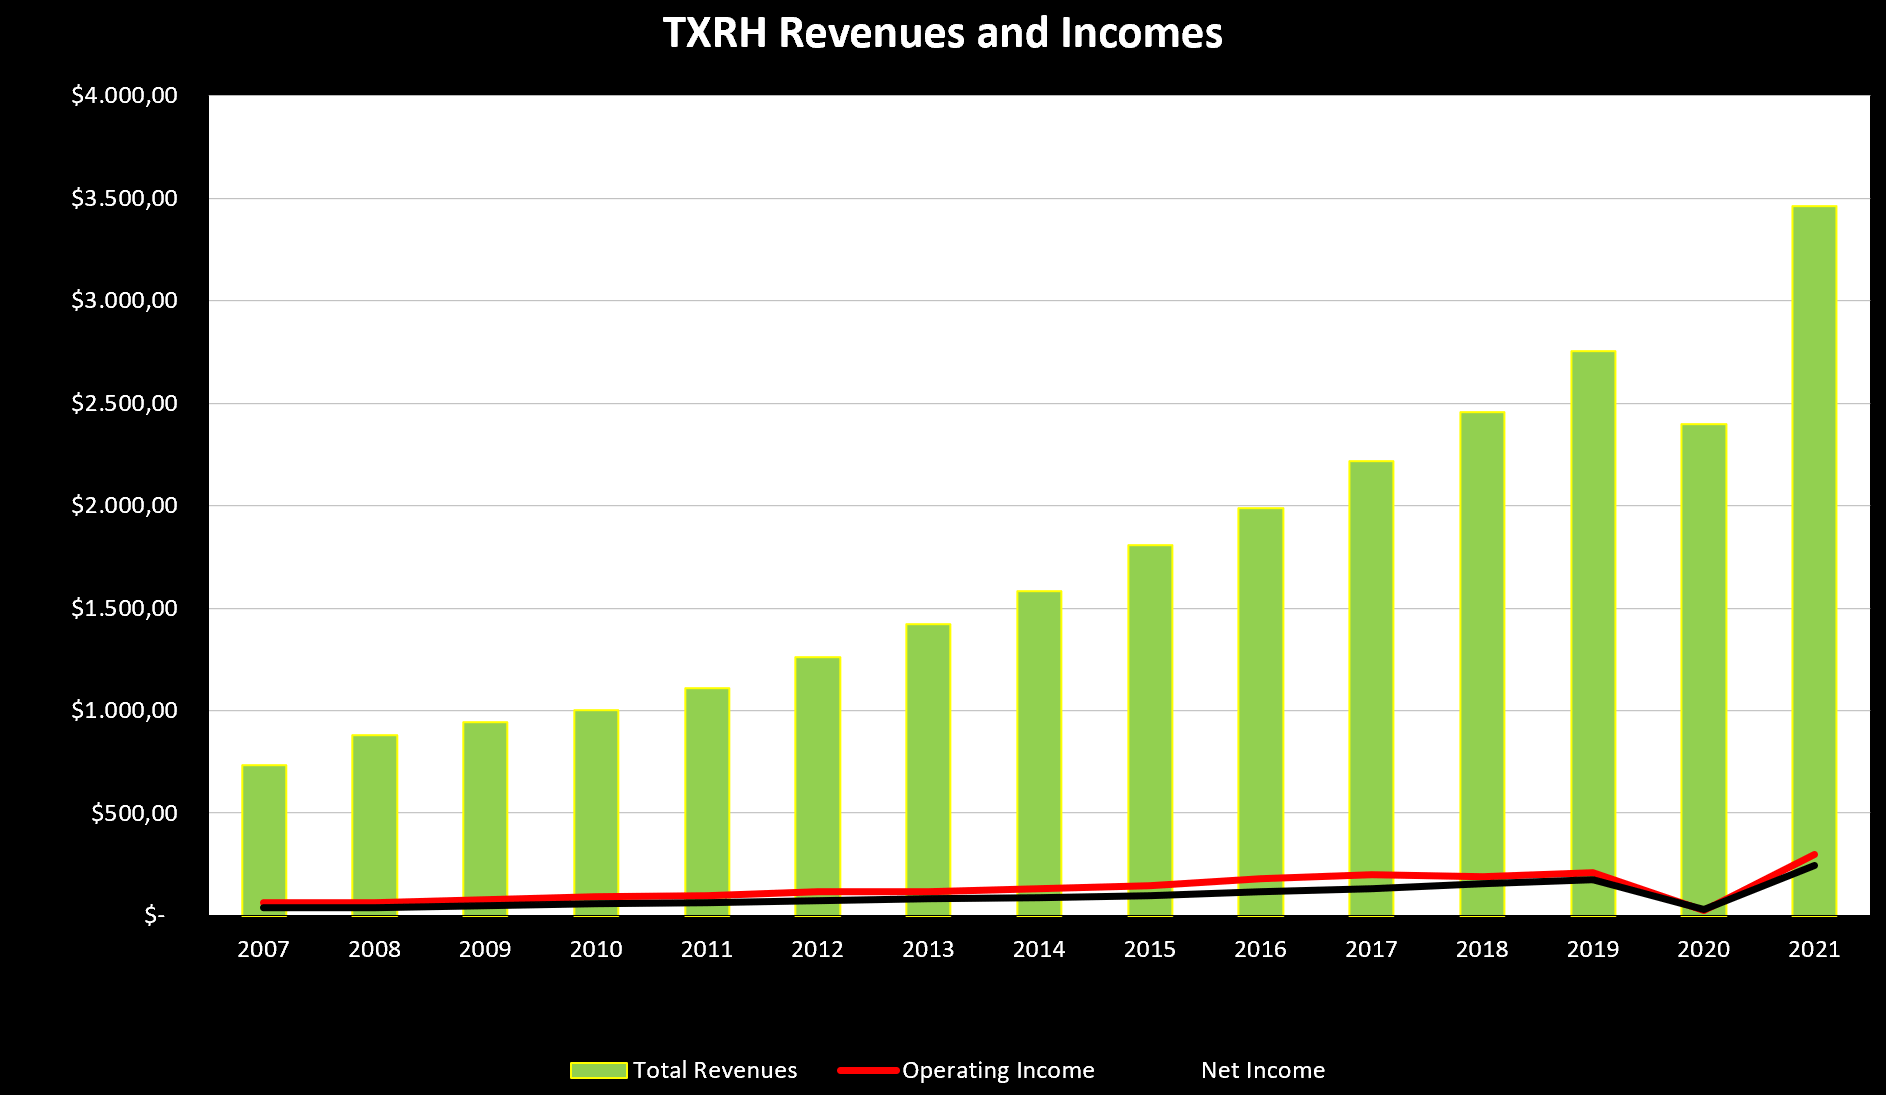
If we then look at margins we see that the operating margins has been somewhat stable between 8% and 9%, while the net margin, apart from 2020, increased from 5% in 2007 to 7% in 2021. It is not an impressive growth, but it could be a hint that a trend is forming and that could lead upwards.
Author using data from TXRH Annual Reports and Seeking Alpha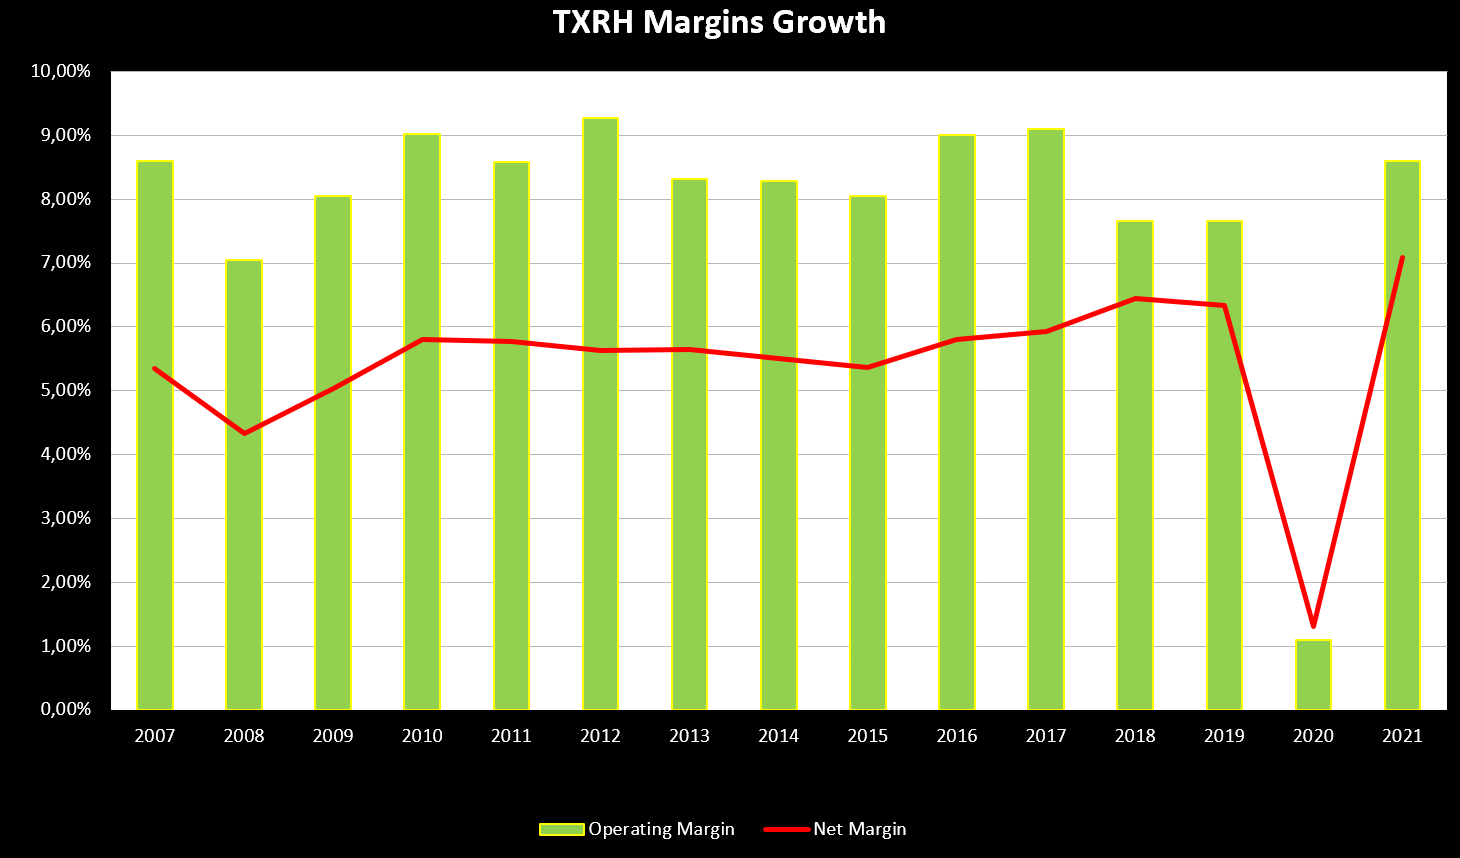
Unlike MCD, TXRH is seeing a steady increase in its cost of revenues which can be understood because the company is expanding.
Seeking Alpha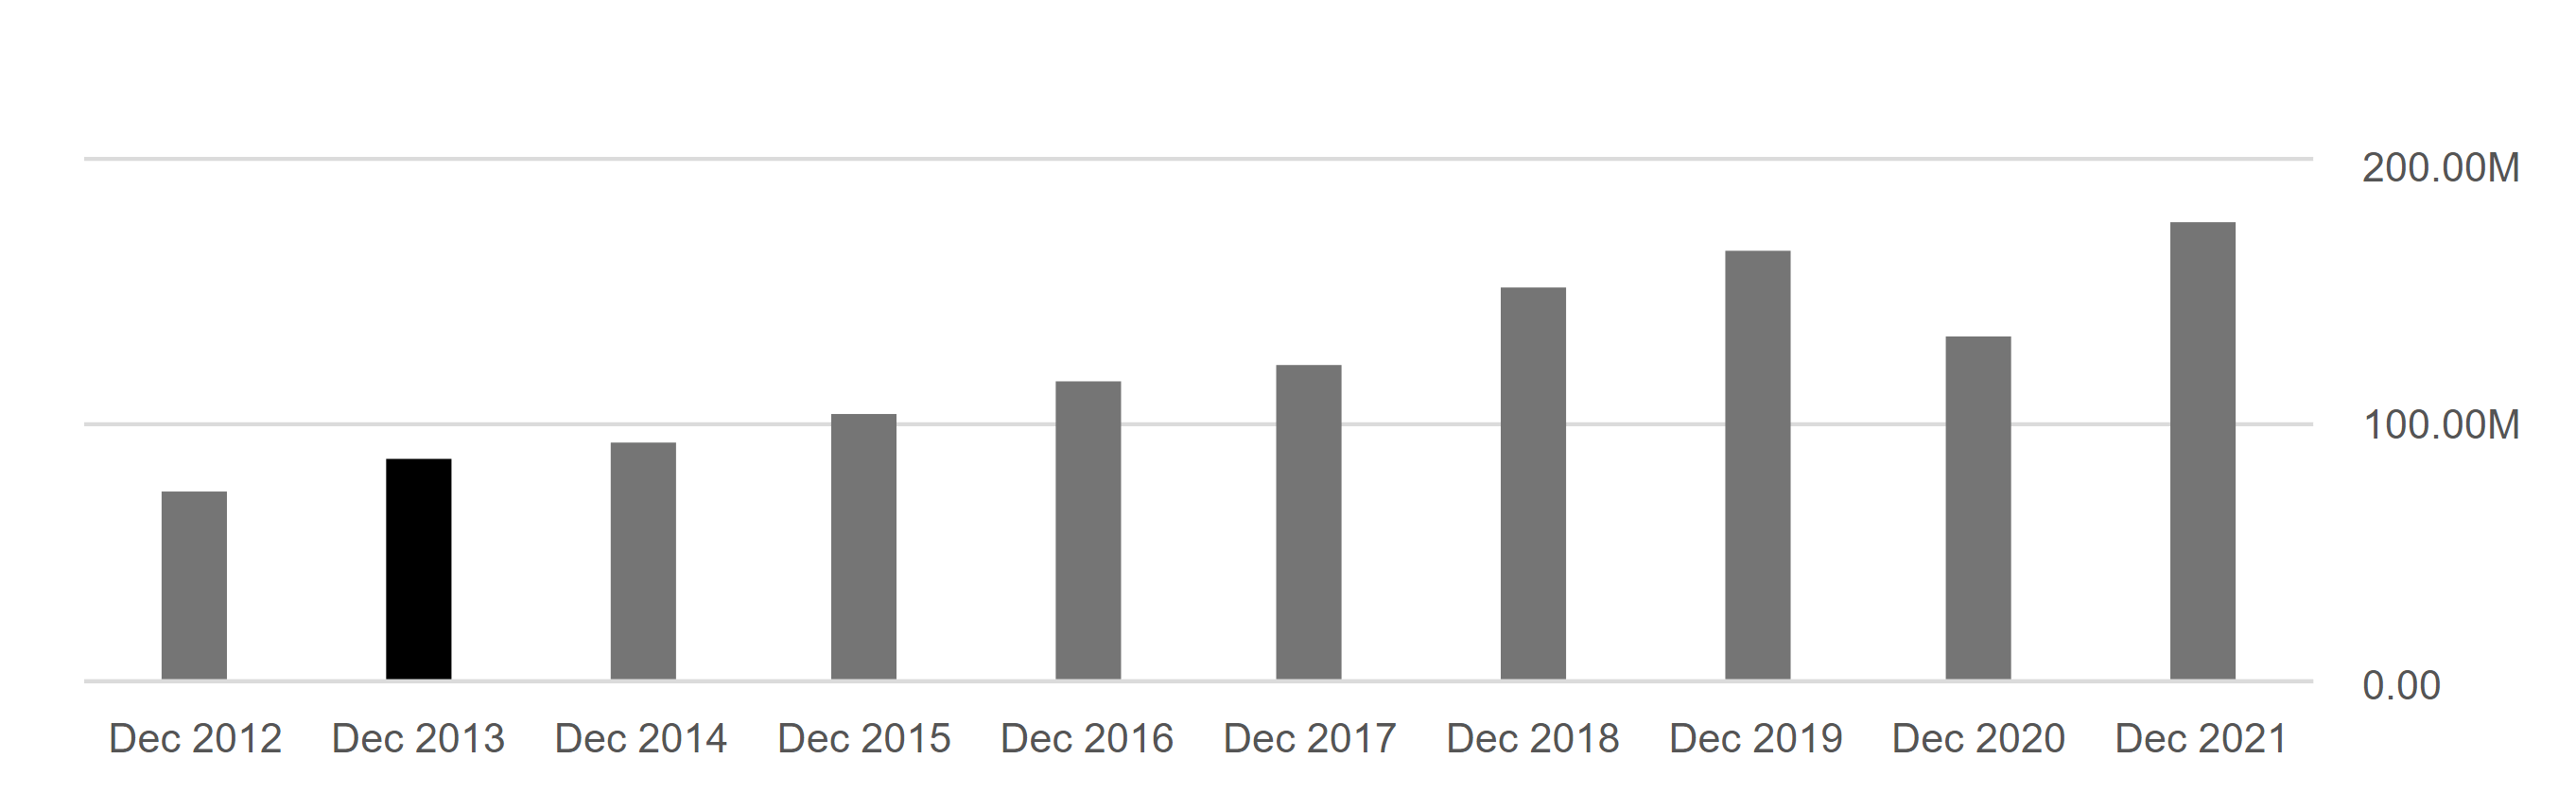
However, even though increasing, these costs have always been well below 10% of total revenues, thus they can’t be considered a huge burden on TXRH income statement.
Looking at FCF, TXRH is on a similar path as MCD, with a steady growth that has been able to support healthy cash returns to shareholders.
Seeking Alpha
TXRH has been committed to growing its dividend since it instated it in 2011. From that time, when the quarterly dividend per share was $0.08, the company bumped it up to $0.46 per quarter this year. However, it suspended its dividend during the pandemic in order to make the company’s balance sheet stronger. From a dividend point of view, TXRH is more interesting than MCD. However, we don’t know if, during a recession, it could suspend once again its cash payments to wait for better economic conditions.
Seeking Alpha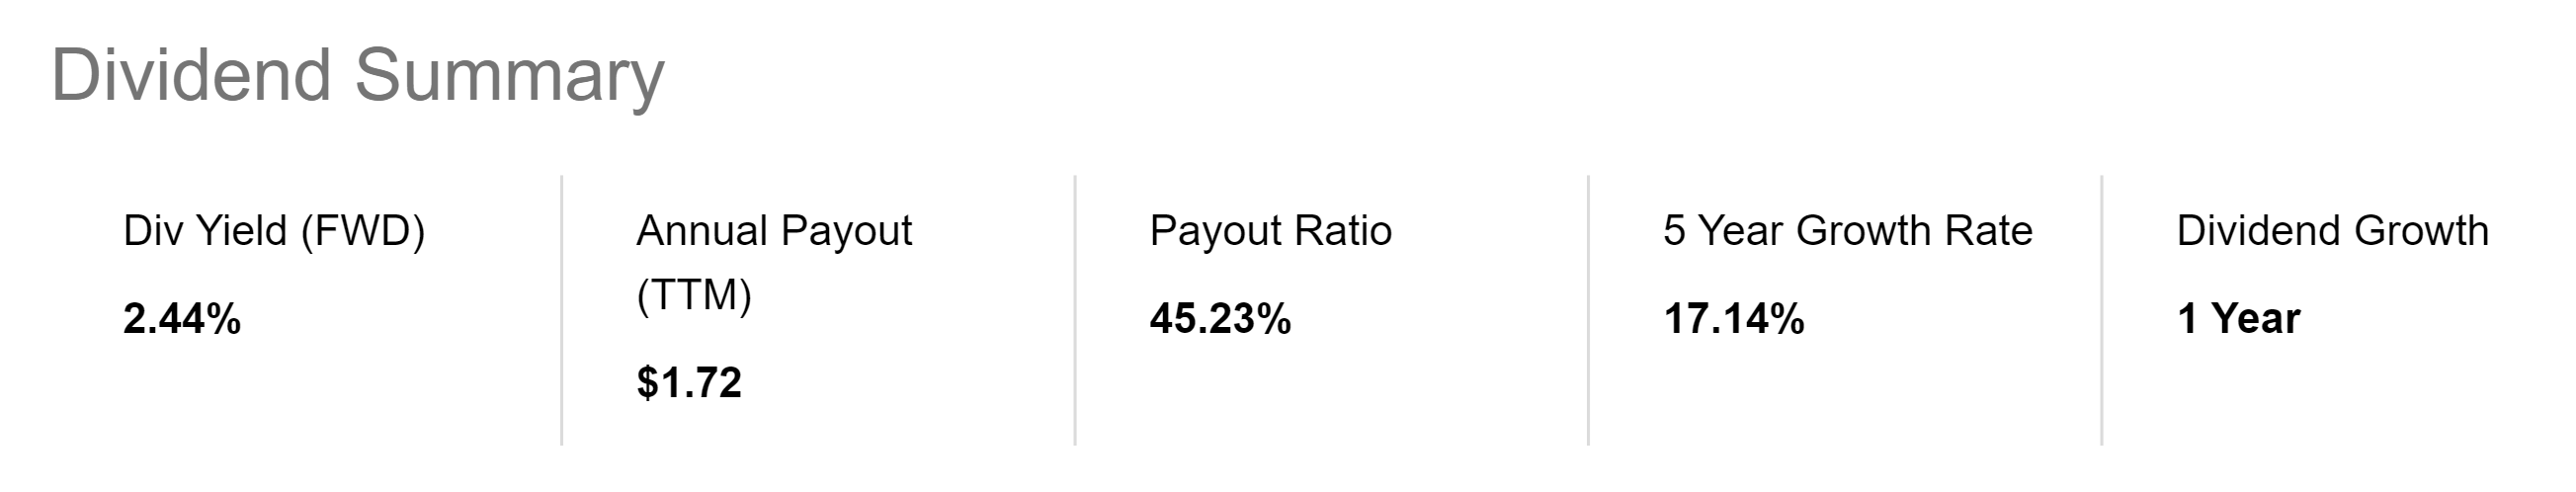
TXRH balance sheet is strong with a total debt of $772 million and $325 million in cash. With a 2021 EBITDA of $425 million, its debt/EBITDA ratio is just a healthy 1.8, which is much more conservative than MCD.
During the great recession, TXRH was unable to grow its margins, unlike MCD. In case of a new recession, TXRH will see more headwinds than MCD in keeping its margins up due to the reasons we explained above.
So, while I think TXRH has a better balance sheet than MCD, its income statement is still not as focused on margins as MCD is. This will give TXRH some constraints in case of economic slowdowns.
Valuation
In my discounted cash flow model, I see that MCD is currently fairly priced. However, this model doesn’t account for a premium that investors are willing to pay for MCD’s reliability. By using the FCF rate of the past decade and by calculating MCD’s WACC starting from its cost of debt and equity, I reach a target price around $235. But, in the short term, I see MCD with more upside than my model accounts for given the favorable momentum.
Author with data from Seeking Alpha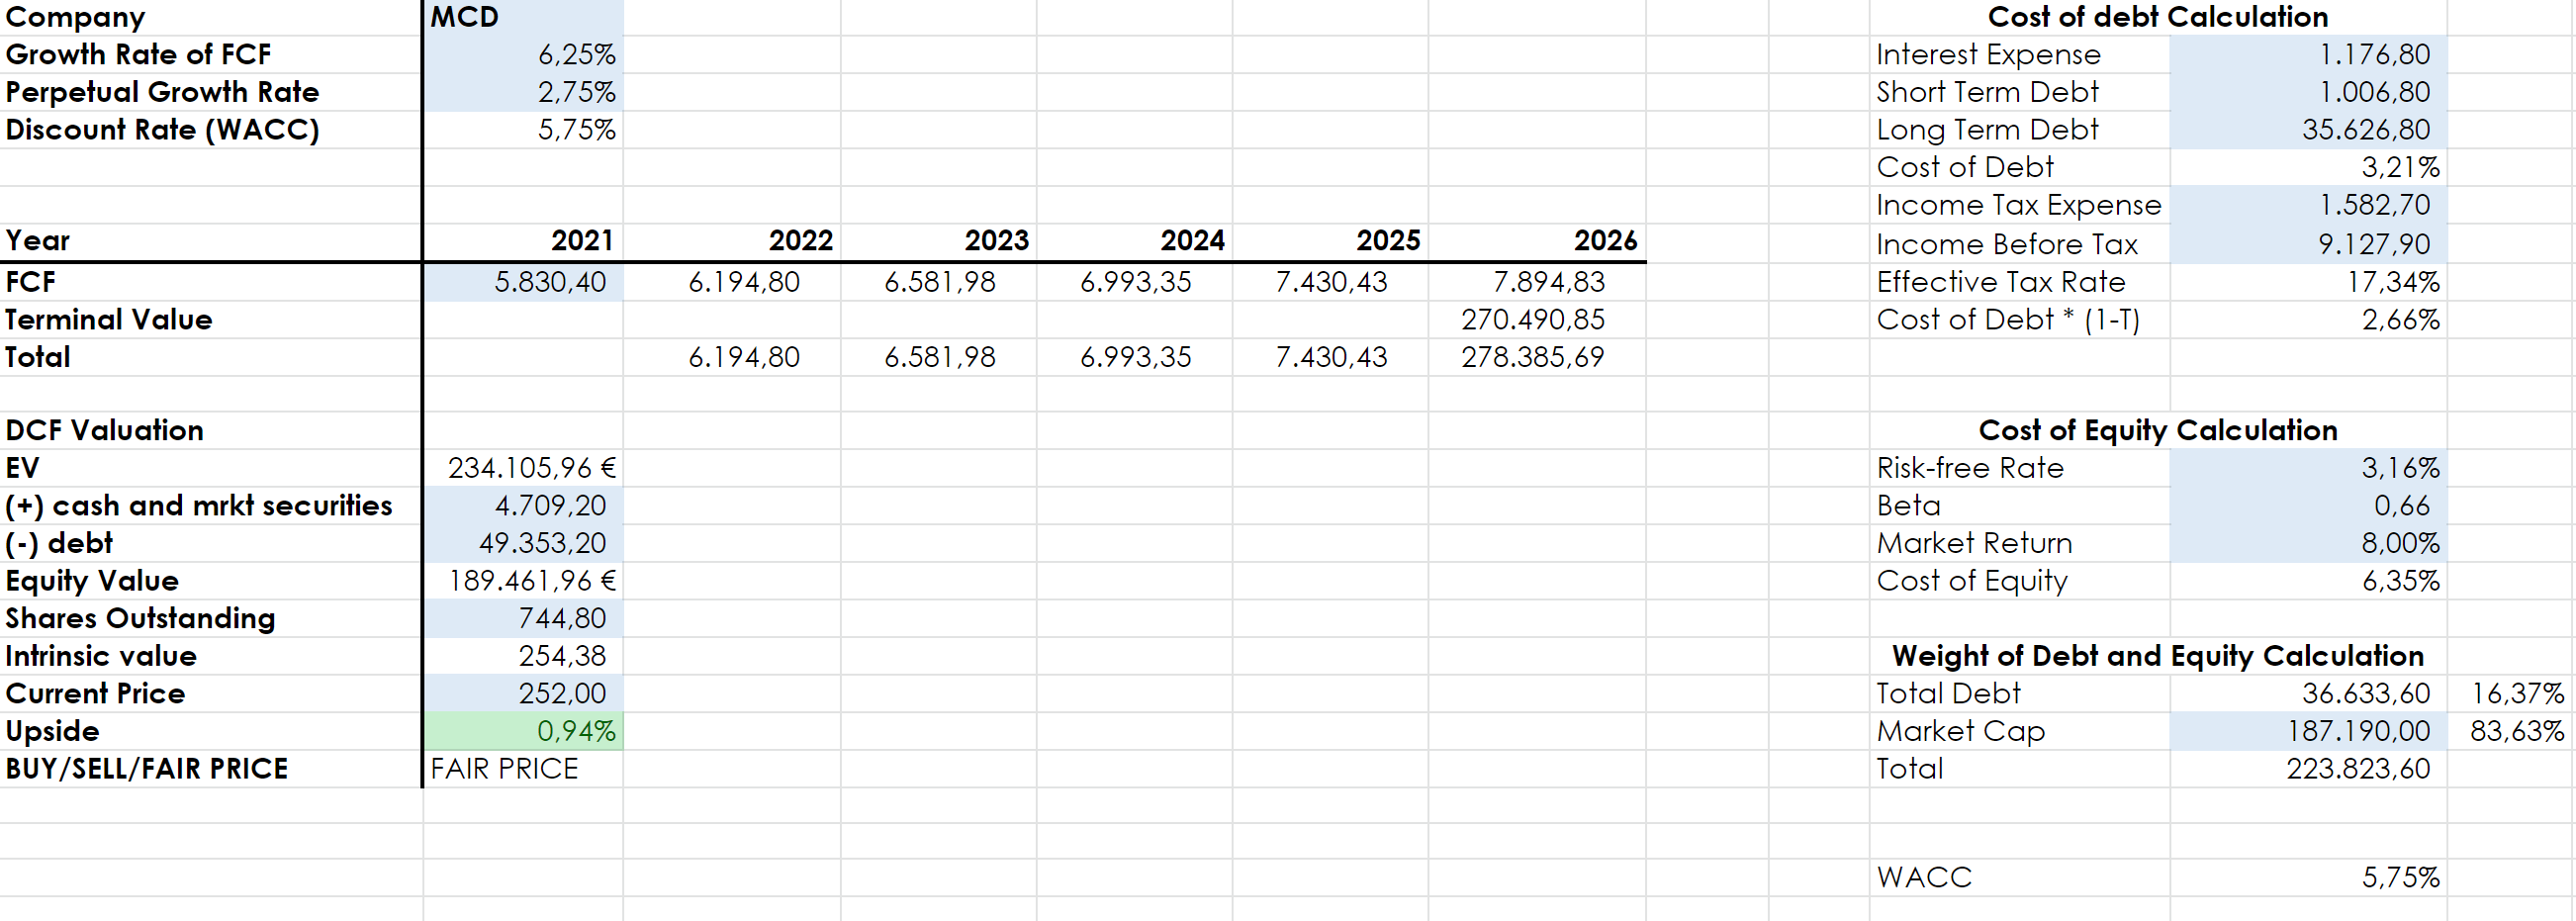
For TXRH I ran a model that assumed a decrease of 10% in FCF for 2023, thus pricing in a recession. The result is a sell. I used the growth rate of the past decade apart from the FCF of 2023, as explained. My target price is $50.
Author with data from Seeking Alpha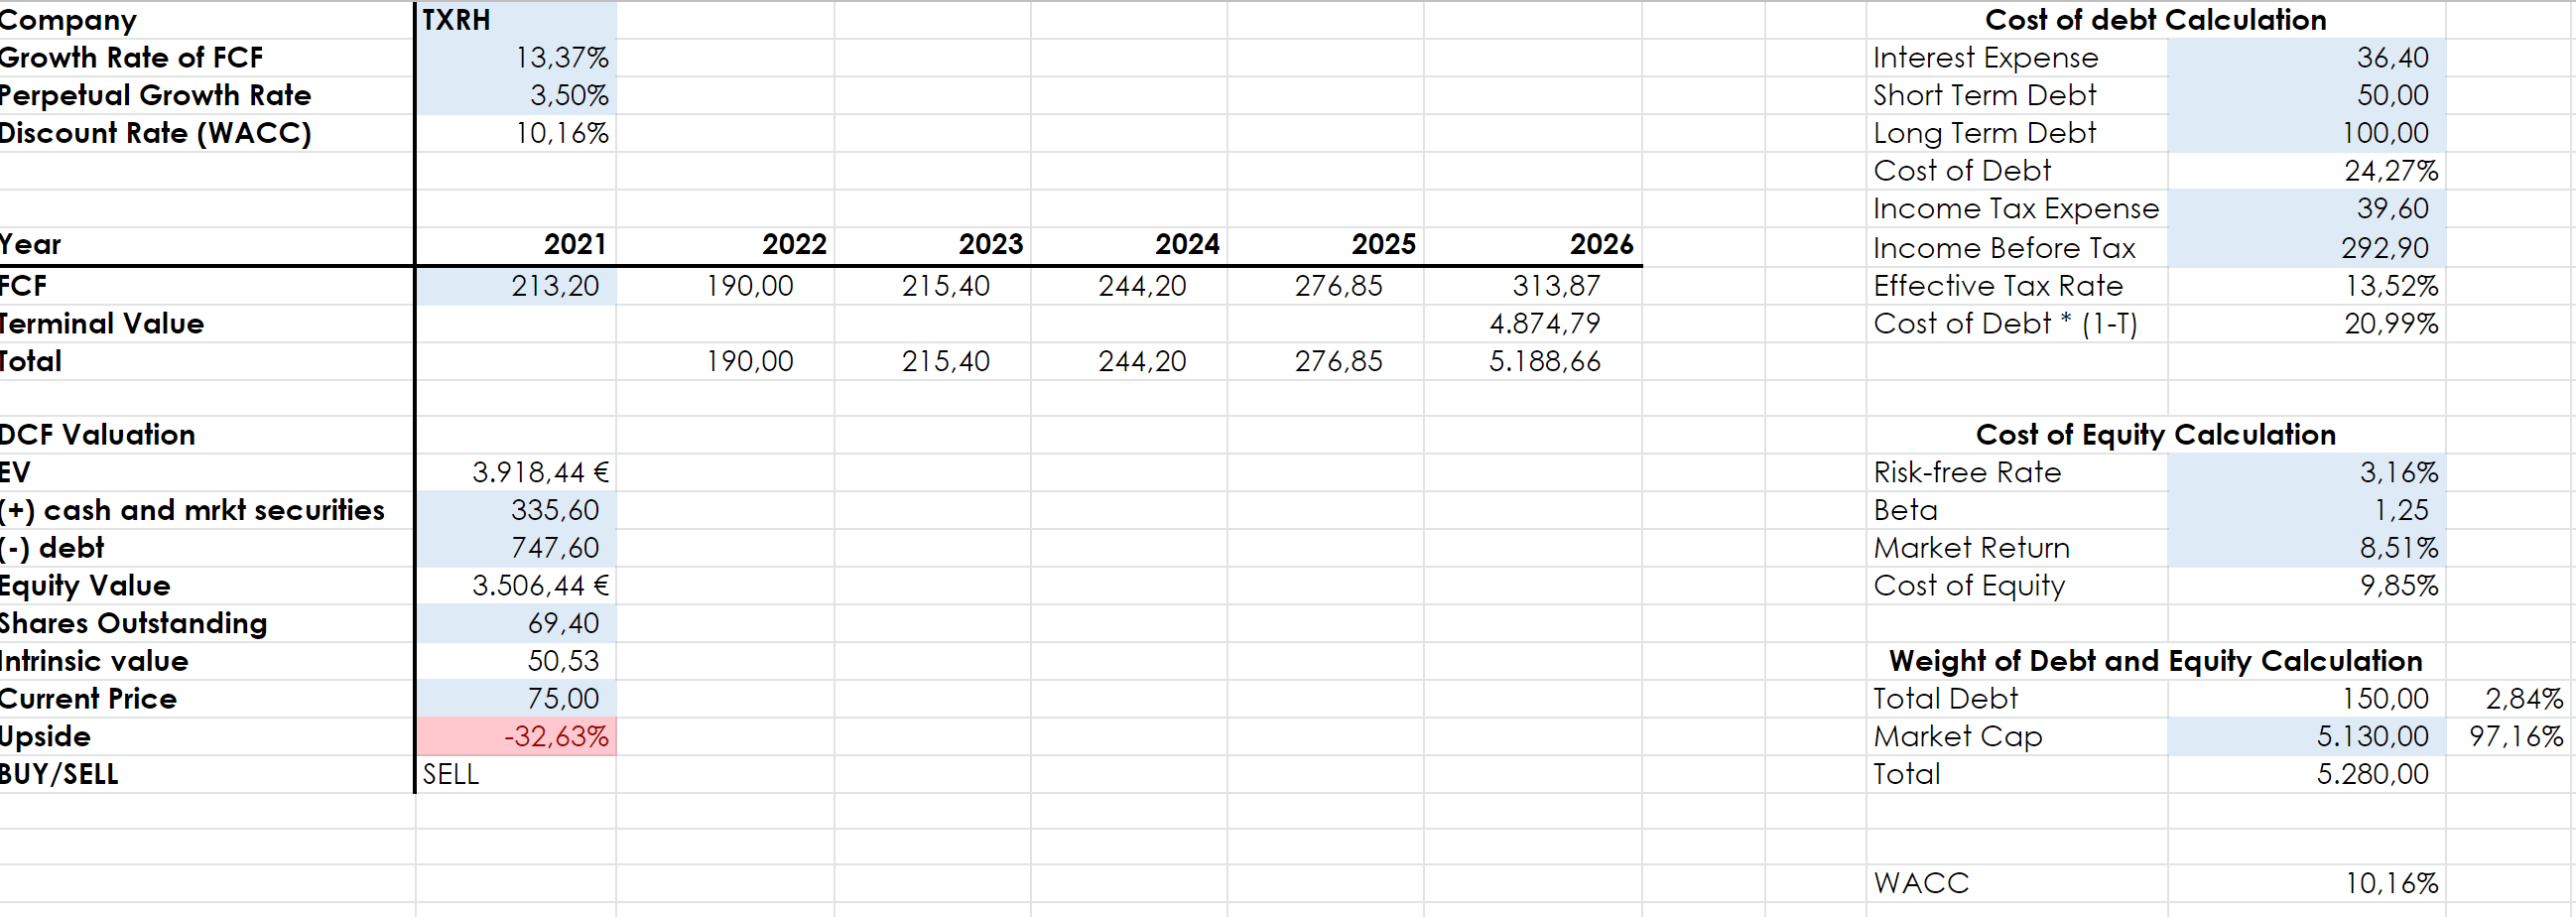
Conclusion
From this analysis, I think the pair trade that sees a long position in MCD and a short one in TXRH has reasons to take place and is supported by a reasonable margin of safety. However, I think this pair trade would give the best results in the period of time when investors are expecting a recession and in the early stage of the economic drawdown.
By the nature of its business model, MCD will fare well during a recession and can be rightly considered a safe haven asset due to its predictable stream of cash. In an environment where growth stocks are punished and investors turn towards value, MCD is the likely winner compared to TXRH.
However, as we start seeing the first signs of an economic recovery I would switch the pair trade, going long TXRH and short MCD because, as I have shown, the former would benefit more from the new environment.
I think this pair trade will provide great opportunities both now and during the next phases of the business cycle.
Be the first to comment