

CRUDE OIL PRICES PUSH TOWARD YEAR-TO-DATE HIGHS FOLLOWING RANGE BREAK
- Crude oil price action has surged 7% higher so far this week as bulls wrestle back control
- Topside breakout above technical resistance opens the door to fresh year-to-date highs
- Fundamental outlook for crude oil remains constructive and could propel the commodity
- Sharpen your technical analysis, learn about WTI vs Brent, or review this oil trading guide
Crude oil bulls look to have regained control of price action after sending the commodity 7% higher so far this week. Oil prices now trade comfortably above prior resistance posed by the $62.00-handle with robust economic data likely helping fuel the move. This brings to focus potential for crude oil prices to continue its rebound back toward year-to-date highs.

Recommended by Rich Dvorak
Get Your Free Oil Forecast
CRUDE OIL PRICE CHART: DAILY TIME FRAME (24 DEC 2020 TO 15 APR 2021)
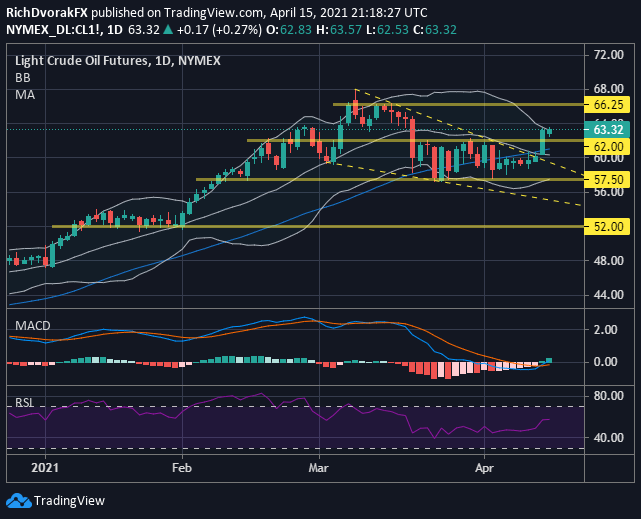
Chart by @RichDvorakFX created using TradingView
Crude oil price action breaking out above $62.00/bbl coincided with a bullish MACD crossover and upswing in the relative strength index. This followed a breakout from an apparent falling wedge pattern, which are often formed during periods of consolidation. The upper Bollinger Band stands out as a nearside technical obstacle that might keep crude oil prices relatively contained.
| Change in | Longs | Shorts | OI |
| Daily | 2% | -1% | 1% |
| Weekly | -16% | 31% | 0% |
Momentum behind the latest extension higher seems to have intensified and accelerated crude oil price volatility, however. This could lead to a Bollinger Band expansion, and statistically speaking, correspond with improved upside potential that facilitates higher crude oil prices. On the other hand, if crude oil bears attempt to make a push, the commodity could find buoyancy around its 50-day simple moving average.
Keep Reading – 8 Surprising Crude Oil Facts Every Trader Should Know
— Written by Rich Dvorak, Analyst for DailyFX.com
Connect with @RichDvorakFX on Twitter for real-time market insight
Be the first to comment