


welcomeinside
Investment thesis
Fresenius Medical Care (NYSE:FMS) has recently drawn some attention as Elliott Investment Management reportedly took a stake in the company, and investors speculate on a possible strategic restructuring of the healthcare conglomerate. Despite the stock not being in the typical setup that I consider when investing, in this article, I will present the technical elements that lead me to rank this stock as a speculative contrarian buy position. The stock is hovering at levels not seen in the last 17 years, after the stock recovered from its massive sell-off in 2002. By considering appropriate stop-loss levels, investors could size their risk accordingly and enter the first position with a conservative risk/reward ratio seen at 2.
A quick look at the big picture
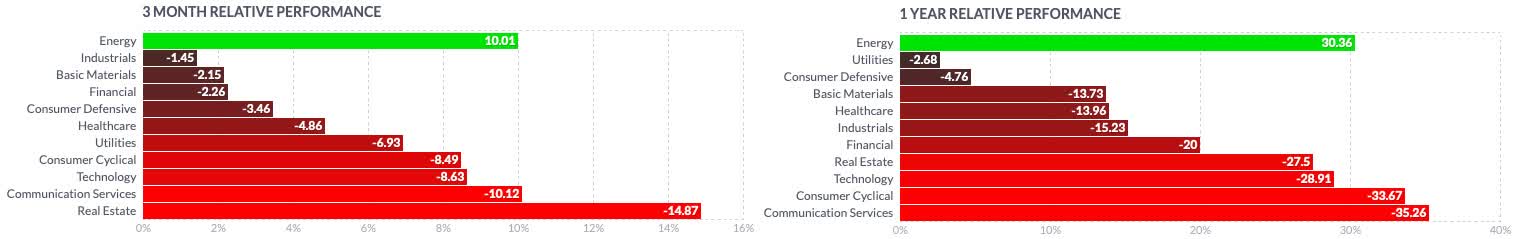
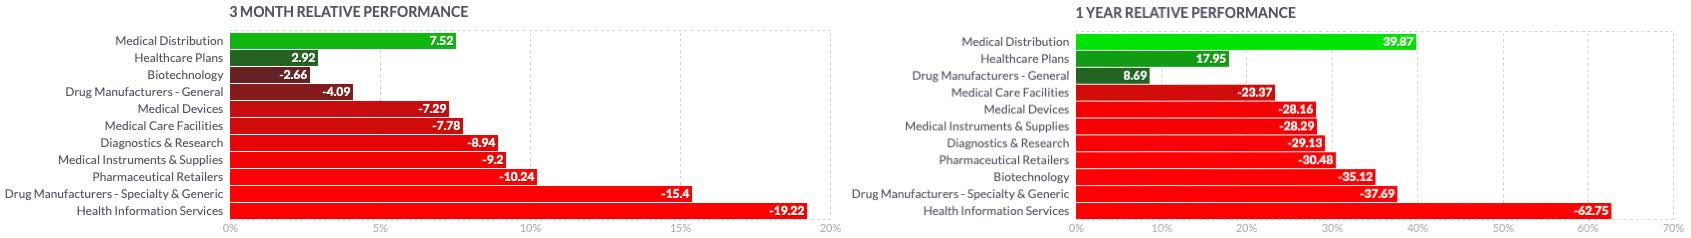
The healthcare sector in the US has been performing better than other groups in the economy in the past year, but seems still oriented negatively in the past 3 months, with some signs of strength only shown in the past few weeks. While the sector is led by the medical distribution industry and healthcare plan providers, general drug manufacturers and biotechnology companies could sporadically report some strength. Companies in the medical services and care facilities industry, despite not being the worst performers in the past year, are still struggling to recover and have rather been laggards in the past months.
finviz
finviz
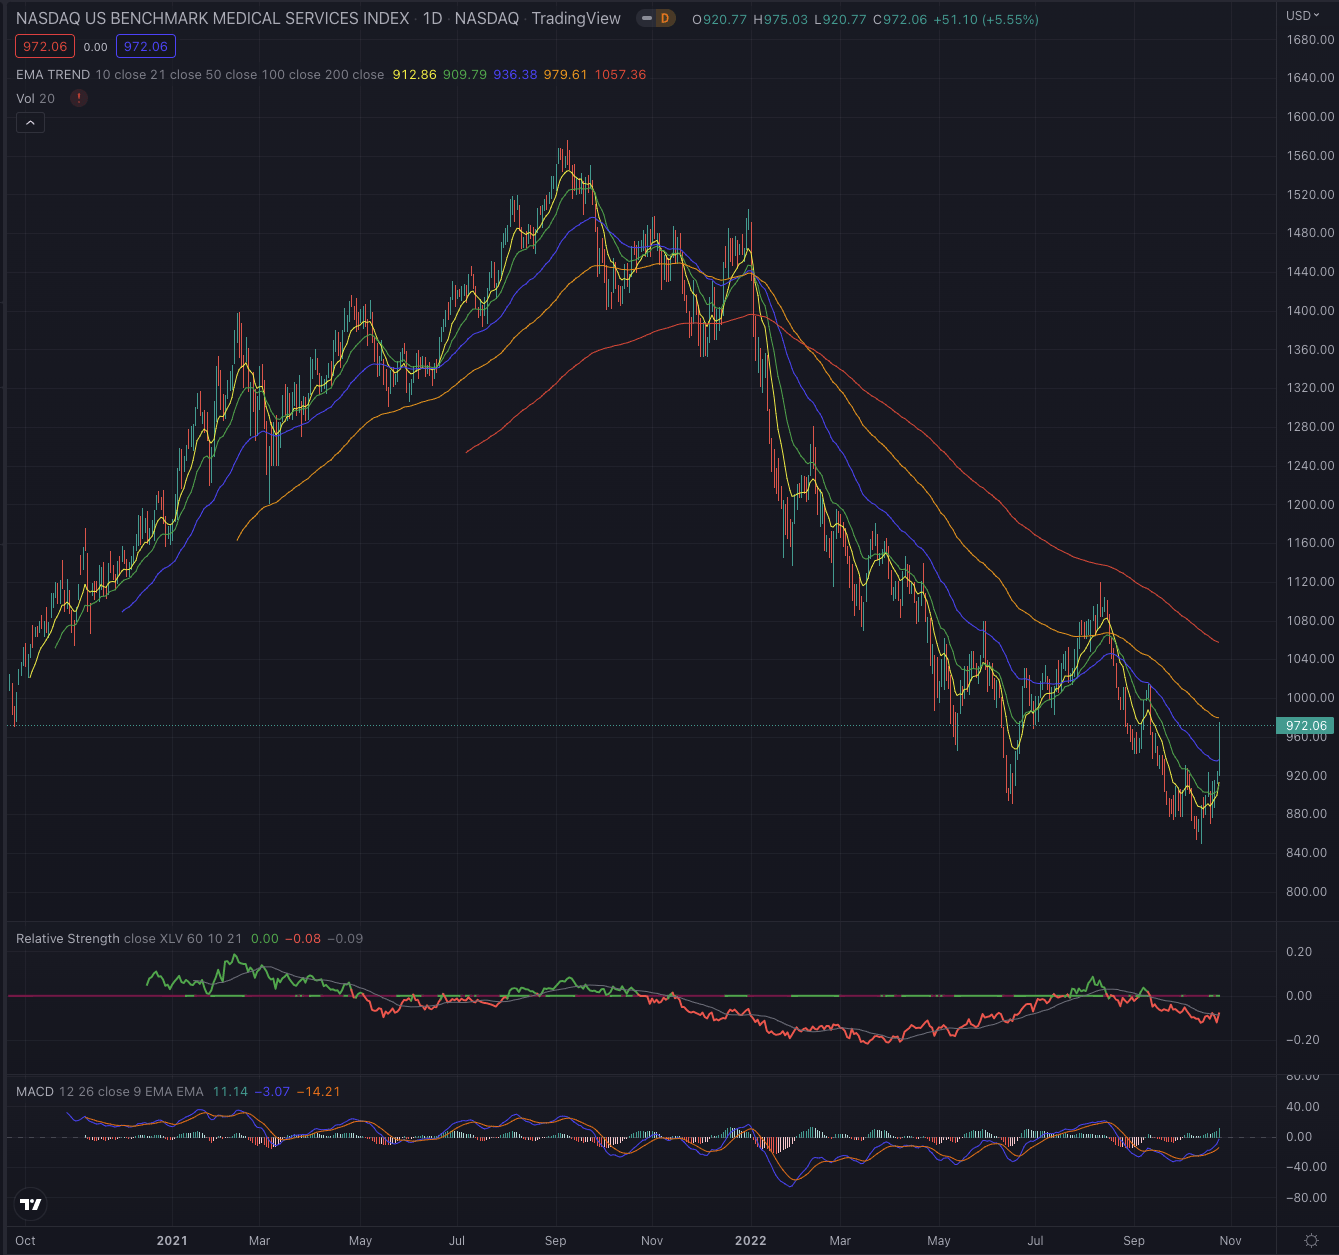
Looking at more specific groups of the industry, the Nasdaq US Benchmark Medical Services Index (NQUSB20102020) which marked its All-Time-High [ATH] on September 9, 2021, has entered a long-term downtrend by the beginning of January 2022 and has since substantially corrected, losing about 46% until bottoming on October 13, 2022, where it immediately reverted and broke out over its EMA50 on a daily basis while it still has to confirm it outbreak over its EMA21 on a weekly basis. Despite this recent reversal, the reference is still relatively weak, when compared to the broader healthcare sector, tracked by the Health Care Select Sector SPDR (XLV).
Author, using TradingView
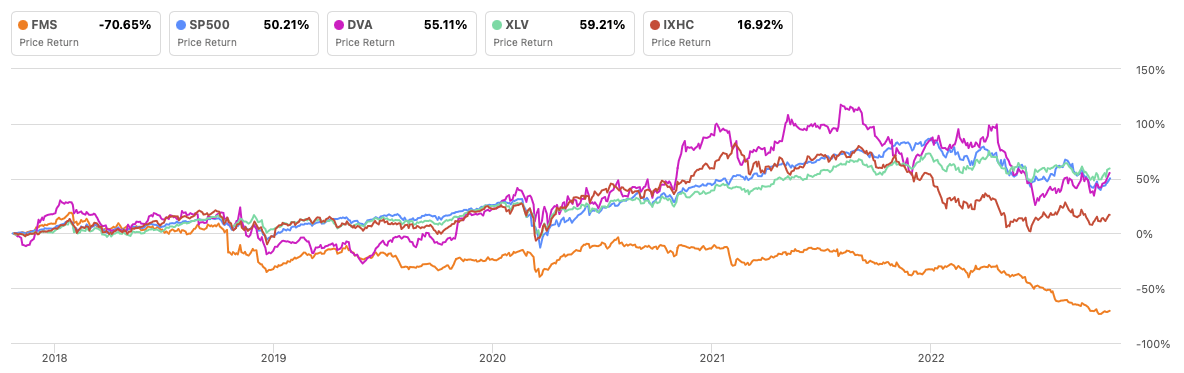
Analyzing the historical stock performance, FMS performed significantly worse than its main references for most of the time in the past five years, resulting in a very poor performance of -70.65%. Its most significant peer DaVita (DVA) could perform much better, by even outperforming the S&P 500 (SP500) and the more specific NASDAQ Health Care Index (IXHC), while the broader Health Care Select Sector SPDR (XLV) would have been the best investment in this comparison over the analyzed time.
Author, using SeekingAlpha.com
Where are we now?
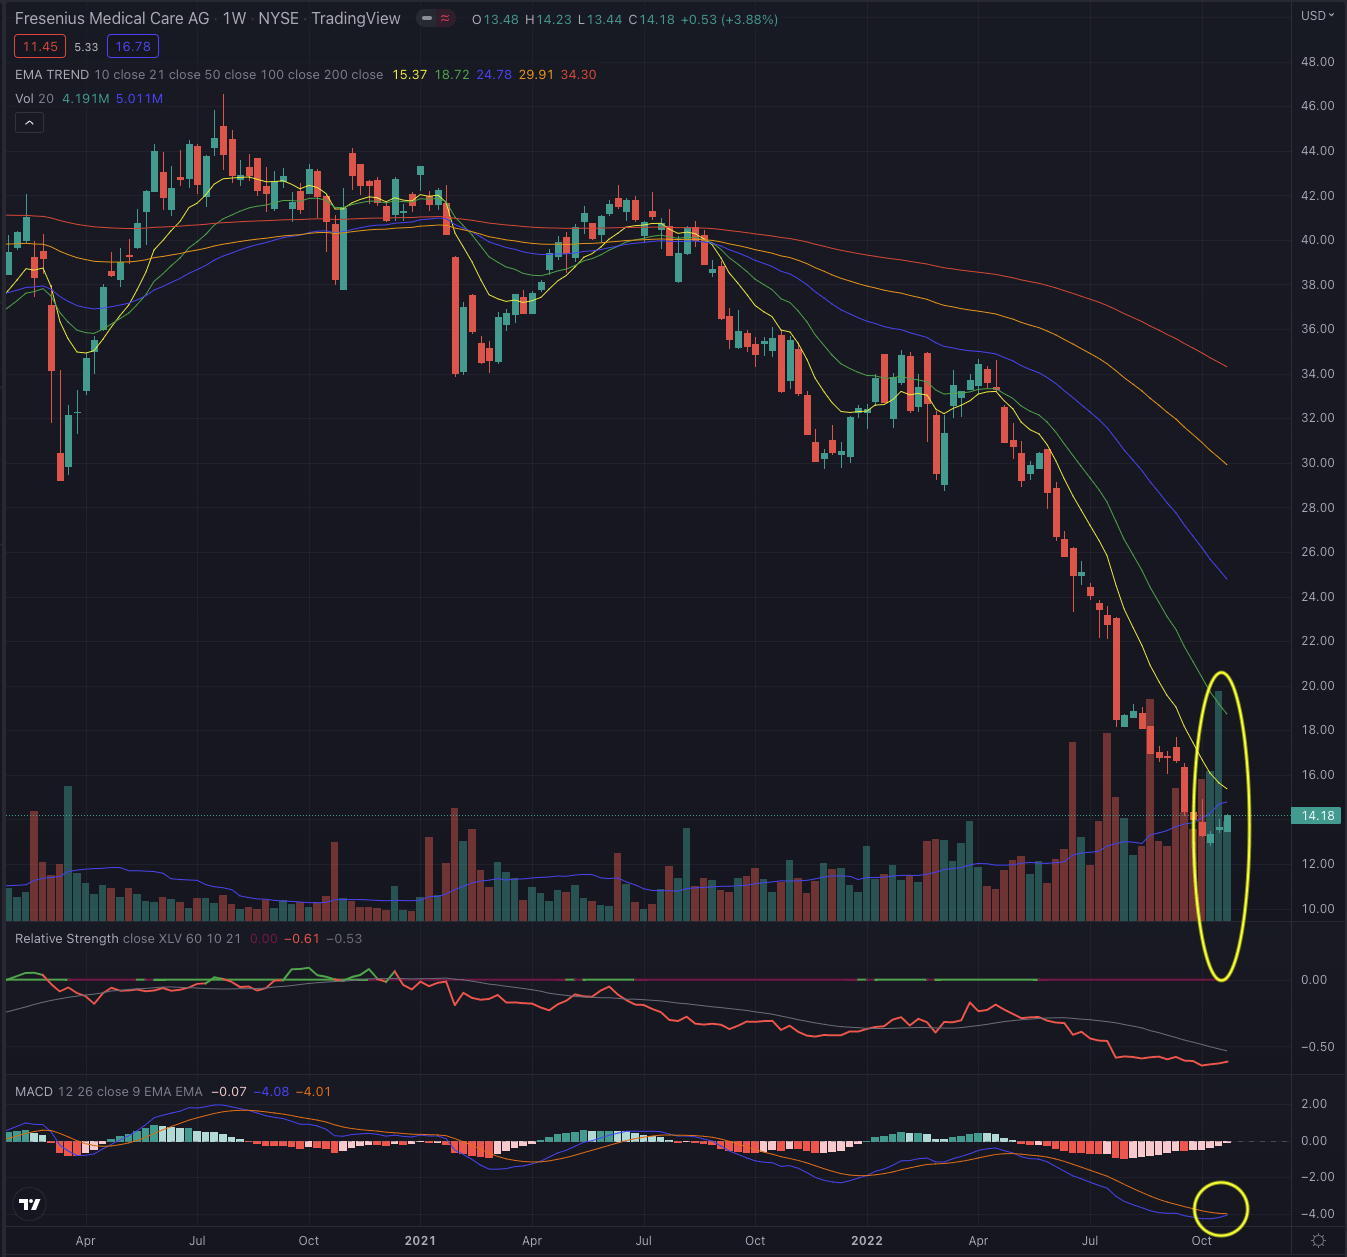
Fresenius reached its ATH on January 31, 2018, and has since performed rather poorly over the years, despite the stock having shown significant resilience during the months immediately after the pandemic lows in March 2020. As shown in the following weekly chart, the stock entered its long-term downtrend in July 2021 and has since been severely sold off, reaching price levels not seen since 2005. The stock could seemingly have bottomed on October 10, 2022, while it is still early to call for it, as the bottoming process would normally take some time before forming a sound base from which the stock could reverse.
Author, using TradingView
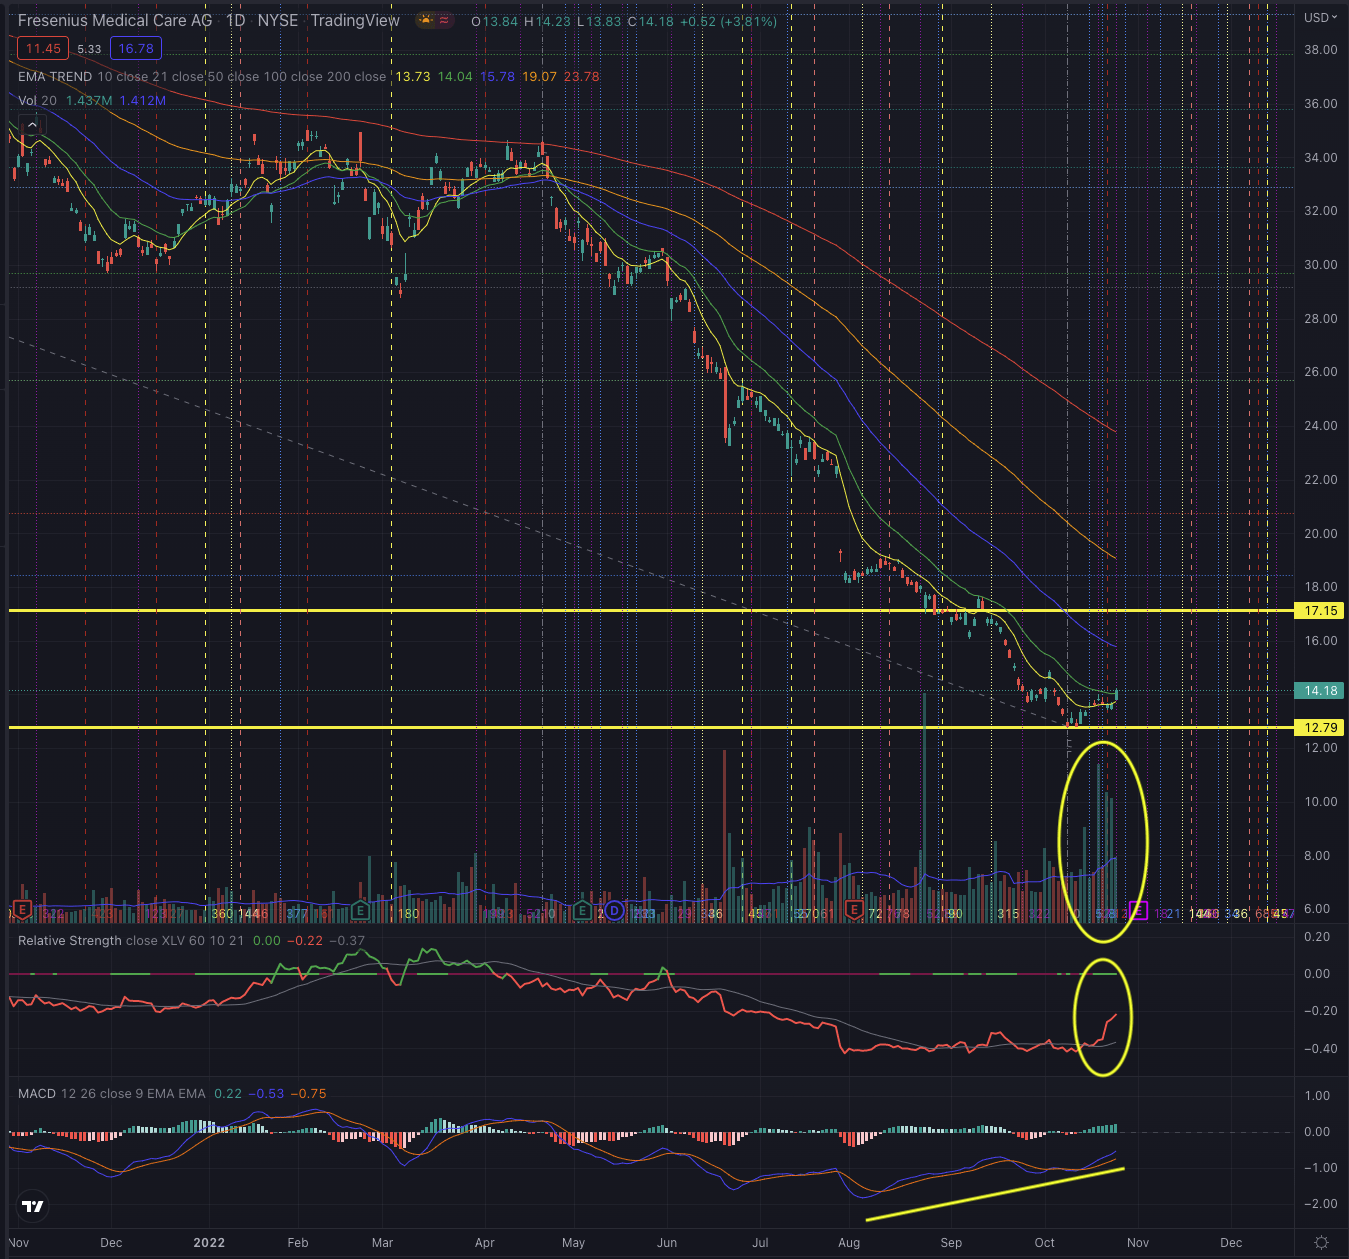
The stock is still in stage 4 and I, normally, would not consider it in this stage, if not because of three elements. First, what is quite impressive, is the steep spike in buy-side volume in the past three weeks, after the stock suffered from a constant rise in sell-side volume since the beginning of the downtrend, while the short interest is very low at only 0.25%. Second, the stock just broke out of its EMA21 in its daily chart, and while this has still to be confirmed in the coming sessions, the stock has not consistently overcome that resistance since March 2022. Last but not least, the stock is forming a reversal of its negative momentum seen in its MACD, which could be the beginning of a rally.
What is coming next?
I expect the stock to continue performing positively in the short term, as it may continue to build positive momentum, hinted by the positive divergence of its MACD and the reversing relative weakness.
Author, using TradingView
Despite at this stage, I would certainly be very careful, this stock may offer an interesting contrarian entry point, for more risk-tolerant investors. The stock is now extremely extended as seen by its moving averages, and could attempt to retrace part of its losses, trying to reach its EMA50 as its first target and if enough strength has built up, even reaching its next most important resistance level, seen at $17.15. While considering the odds of seeing new lows, I would size my position accordingly, by entering a first small position and limiting my downside to the most recent low, therefore considering a risk/reward ratio of 2. Should the stock continue in its retracement, further positions could be added and investors could consider the stock’s moving average as trailing stops, or increase their stop according to their risk tolerance while considering that the stock would likely test again its supports and would require a higher tolerance in volatility.
Long-term-oriented investors who believe in this company could consider sizing their entry points according to the stock’s strength in case of a consistent reversal in its price action. I would not consider any major position until the stock has not formed a sound base and completed its first stage while showing a significant breakout of its long-term downtrend.
The bottom line
Technical analysis is not an absolute instrument, but a way to increase investors’ success probabilities and a tool allowing them to be oriented in whatever security. One would not drive towards an unknown destination without consulting a map or using a GPS. I believe the same should be true when making investment decisions. I consider techniques based on the Elliott Wave Theory, as well as likely outcomes based on Fibonacci’s principles, by confirming the likelihood of an outcome contingent on time-based probabilities. The purpose of my technical analysis is to confirm or reject an entry point in the stock, by observing its sector and industry, and most of all its price action. I then analyze the situation of that stock and calculate likely outcomes based on the mentioned theories.
FMS is not the typical stock pick I would consider, as it is in stage 4 and still in its long-term downtrend. But the actual situation is quite interesting from a technical point of view, as the last time the stock had such a colossal sell-off was over 20 years ago. More risk-tolerant investors could take advantage of these price levels not seen for 17 years, by considering the mentioned elements that hint at a possible short-term reversal. Was this the bottom? No one can predict that at this point, and only the coming weeks will give more clarity on a possible bottom-building process, but investors with systematic risk management and an appropriate position-sizing strategy, combined with a strictly executed contingency plan, could take advantage of this contrarian opportunity.
Be the first to comment