

RiverRockPhotos
by Levi at StockWaves
Produced with Avi Gilburt
It is said that copper is one of the best indicators of an expanding or contracting economy. And, what better way to play a potential surge in copper prices than one of the leaders among copper producers? We are in search of the copper top. But, as you will note shortly, we do not see copper finding a long-lasting top just yet. Please follow along as we discuss from both a fundamental and technical viewpoint where we see both copper and Freeport-McMoRan (NYSE:FCX) headed over the next several months.
First, let’s just briefly discuss how to use each of these methods. Over the many years that we have been offering our analysis to the public, we have discovered that rarely, if ever, do fundamental indicators lead the price of stocks, markets or commodities. But we also do not completely discount fundamentals, as they do indeed matter.
Our analysis method is where fundamentals and technicals align. Note below comments from our lead fundamental analyst, Lyn Alden:
Lyn’s discussion on Copper
I’ve been long-term bullish on copper and copper producers for a while. There are big deficits between expected demand and existing reserves, which will require new mines to come online, and those take a long time.
However, I’ve been intermediate-term cautious on copper since 2021. When my holding of copper producer Freeport-McMoRan (FCX) tripled and my holding of copper producer Southern Copper (SCCO) went up quite a bit, I exited my positions.
Copper is a rather cyclical metal, tied to construction and manufacturing, and it generally does poorly in declining-PMI environments (economic deceleration).
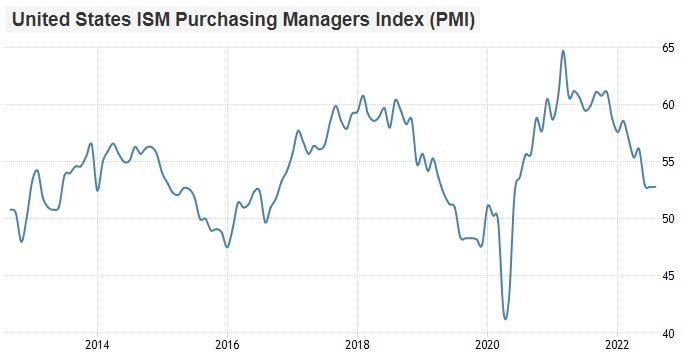
Trading Economics
The copper-to-gold ratio, for example, follows the PMI cycle pretty closely:
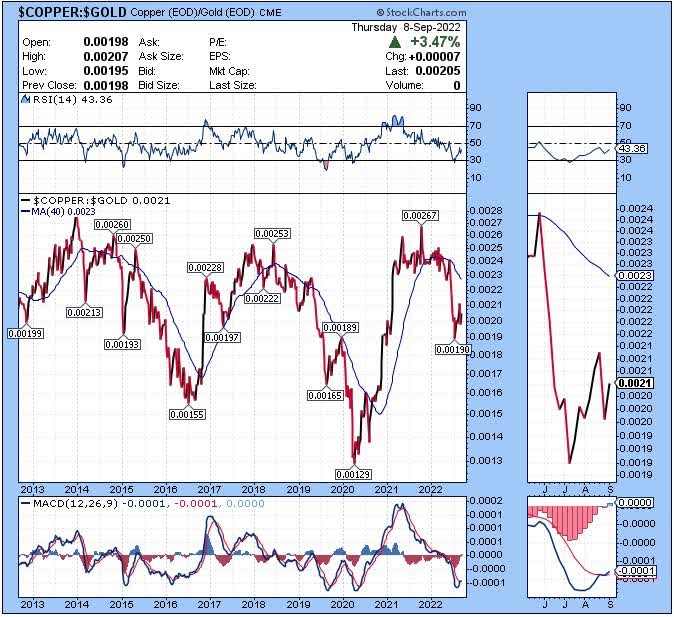
StockCharts
My concern is the decent possibility that this down cycle is not over yet and that another leg down is coming. However, it has already fallen pretty far, and we can at least start watching it for a bottoming process and eventual setup.
Lyn’s current view of FCX
Even though the fundamentals still suggest that it’s a bit early, for the technicals there’s already a higher-low in place that traders can use as a stop loss to begin speculating on a bottom being in place.
The company is reasonably valued relative to its potential to generate free cash flow, but of course its forward prospects heavily depend on the price of copper.
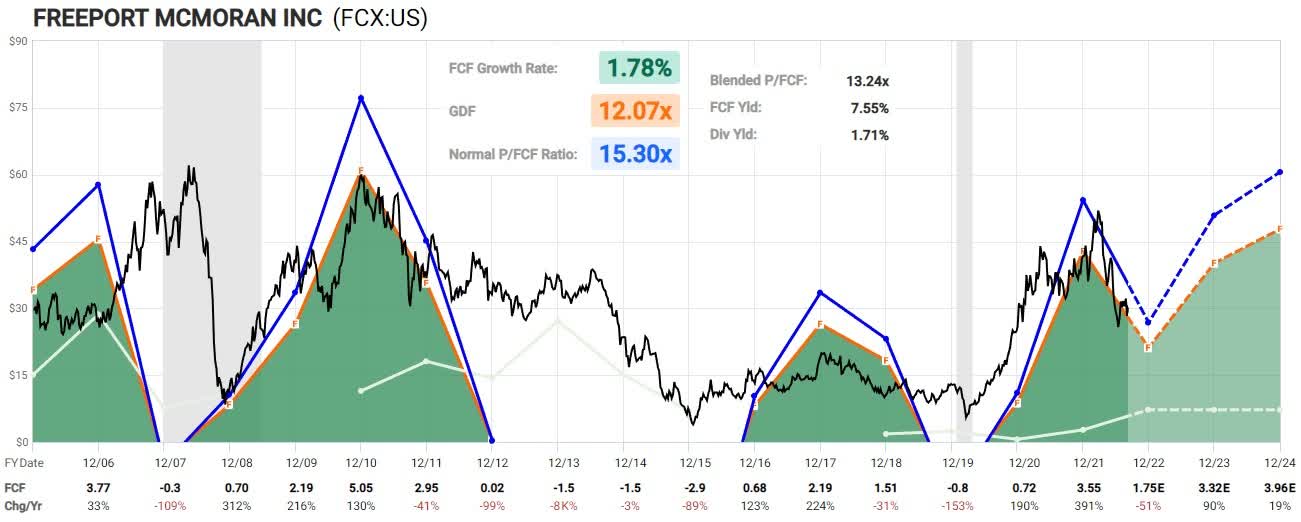
FastGraphs
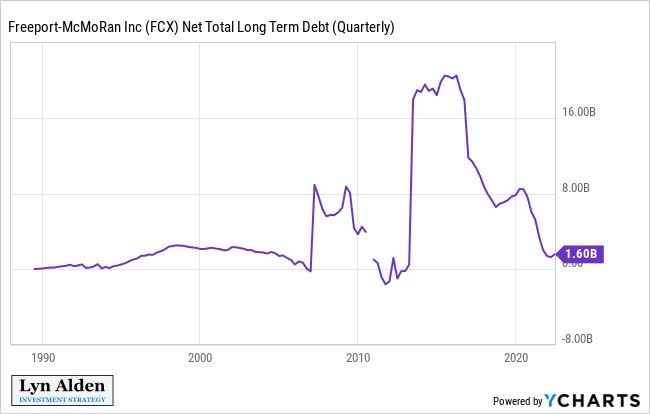
They strengthened their balance sheet considerably in recent years, and thus are well positioned to deal with volatility in the intermediate term for what’s probably going to be a much higher copper price in the long term.
Charts
The Technical Setup for FCX
In Lyn’s comments we can glean that some caution near term should be exercised. However, note how the technical side may be sniffing out a potential important turning point at hand in both copper and FCX.
If you’re familiar with our methodology then you will know that in a rally phase we look for 5 wave impulsive structures followed by 3 wave corrective structures. It appears that copper may have formed such an initial structure up off the low you see marked as wave “4” struck at $3.13 on 15 July. From here, copper needs to take out the $4.11 region and then hold $3.82 or higher on any pullbacks.

TradingView
Since FCX greatly benefits or suffers from moves in copper, it also would follow that should copper be on the move in this next larger rally phase as illustrated here, then FCX will also join the party. What are the key levels for FCX?

TradingView
Main support for FCX remains at $19.00 – $23.33. Note that this also has found a swing low in price at nearly the same time as copper on or about 15 July. Near-term bullish preference would be for $27.30 or higher to hold. The would place the key levels in price as shown. Breaking above $36 would then make $32 a key support level.
Where is this scenario wrong?
If FCX instead breaks below $27.30 before conquering these price levels stated above, then we would watch the main support shown on this daily chart. Breaking below $19.00 would reset our bullish expectations for FCX and would require a revision to the wave count as shown here.
Conclusion
Using our comprehensive methodology of the macroeconomic environment paired with stock-specific fundamental analysis, this is a favorable setup with substantial upside. Our technical analysis is providing us with a structure to track and trade going forward.
I would like to take this opportunity to remind you that we provide our perspective by ranking probabilistic market movements based upon the structure of the market price action. And if we maintain a certain primary perspective as to how the market will move next, and the market breaks that pattern, it clearly tells us that we were wrong in our initial assessment. But here’s the most important part of the analysis: We also provide you with an alternative perspective at the same time we provide you with our primary expectation, and let you know when to adopt that alternative perspective before it happens.
There are many ways to analyze and track stocks and the market they form. Some are more consistent than others. For us, this method has proved the most reliable and keeps us on the right side of the trade much more often than not. Nothing is perfect in this world, but for those looking to open their eyes to a new universe of trading and investing, why not consider studying this further? It may just be one of the most illuminating projects you undertake.
Be the first to comment