

Lisa-Blue/E+ via Getty Images
Freeport-McMoRan’s (NYSE:FCX) stock has suffered dramatically in recent weeks, and it may be heading lower still. Copper prices have dropped materially as fears of a global slowdown and a strong dollar have reverberated through the markets. This weakening in copper price is one reason traders may be betting that Freeport stocks will see even lower prices.
Copper prices have the most significant influence on Freeport’s stock price. Over the years, copper prices and Freeport’s stock price have been highly correlated, and that makes sense since the price of copper influences Freeport’s revenue, margins, and earnings.
Bloomberg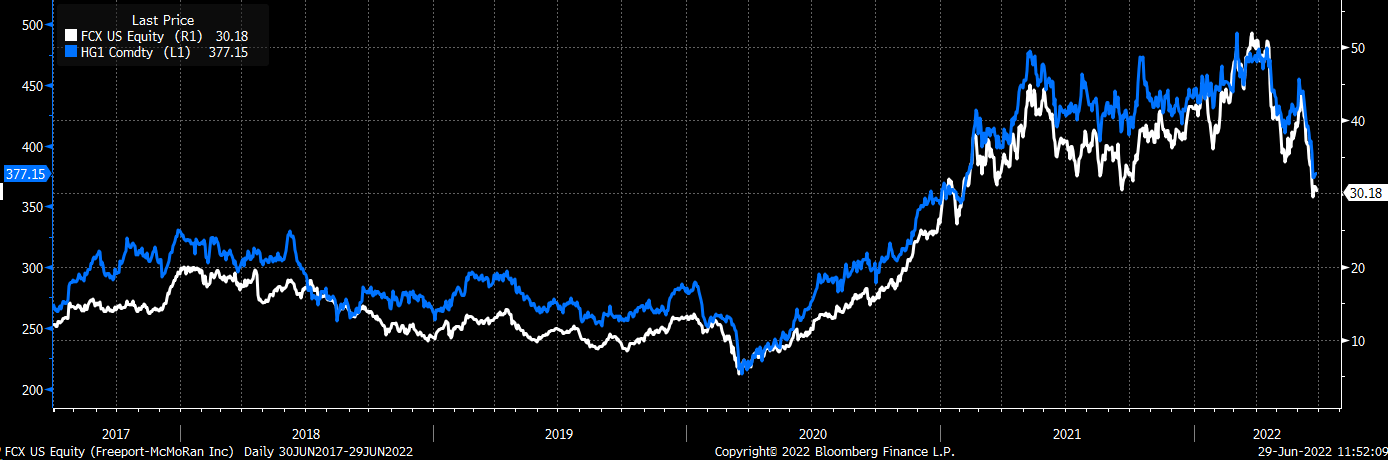
Earnings and sales estimates for Freeport already are starting to be cut for 2022 and 2023. Sales and earnings estimates have only seen a minimal decline, but if copper prices continue to erode, these estimates will likely continue to move lower.
Bloomberg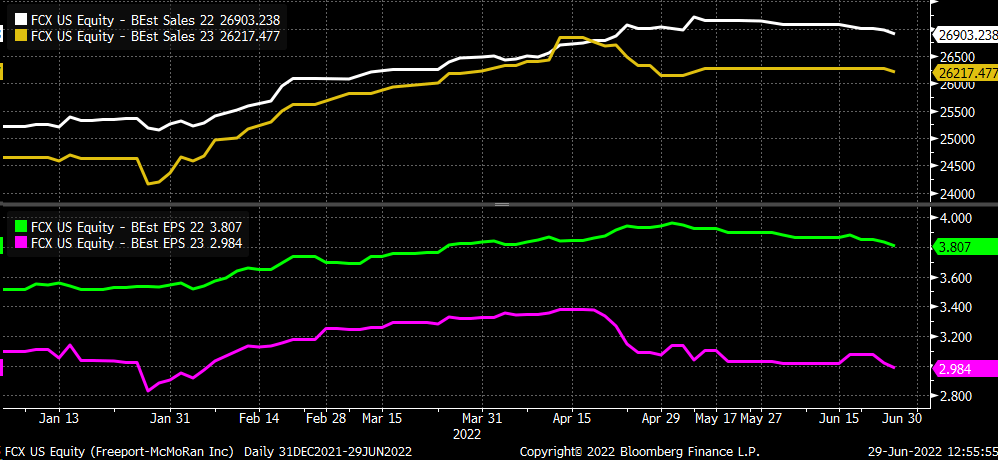
One reason copper prices have dropped is due to the economic weakness that has been witnessed in China due to COVID. Additionally, with central banks globally tightening monetary policy, the global economy is slowing quickly and may be heading toward a recession. The other reason is likely due to the strong dollar, which has risen to over 100 on the dollar index. Typically, a stronger dollar can hurt the prices of commodities that are priced in dollars.
Betting Freeport Drops below $30
The negative outlook for copper and the recent decline may be prompting some traders to bet that Freeport’s stock will fall further. On June 29, the open interest for the August $25 puts increased by around 14,300 contracts. The data shows the puts were traded on the ASK and were bought for about $0.70 per contract. It implies that Freeport is trading below $24.30 by the expiration date in the middle of August if the puts are held until expiration. It was a decent-sized bearish bet on Freeport, with about $1 million in premiums paid.
Nearing A Break of Support
For now, the stock has been able to find some meaningful support in a region between $30 to $31. That’s the critical level. If it should break, Freeport will have much further to drop. That next support level for Freeport doesn’t come until $26. The momentum in Freeport is bearish, with an RSI that has been trending lower since peaking above 70 in early March. The RSI is yet another indication that Freeport’s stock hasn’t bottomed yet.
TradingView
Copper Looks Negative Too
Copper has a similar technical setup to Freeport, with the chart suggesting the stock isn’t finished falling just yet. For now, the shares have found some meaningful support at roughly $3.75. But if that support region shouldn’t hold, then the next level of support for copper does not come until it reaches $3.50. Like Freeport, copper’s relative strength index is trending lower, suggesting that momentum is bearish.
TradingView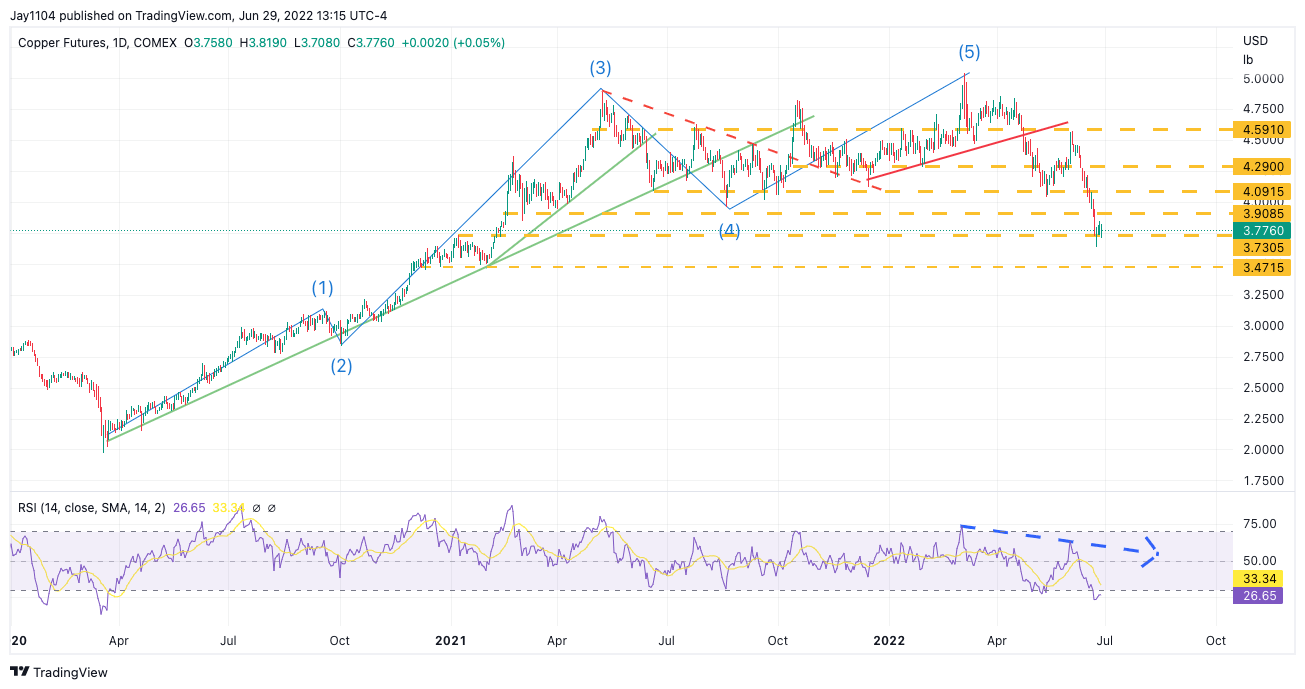
The trends in copper look very weak, and should the global economy continue to slow or enter recession, copper prices are likely to fall even more. That will weigh heavily on Freeport’s stock, considering how tightly correlated the two are.
Join Reading The Markets Risk-Free With A Two-Week Trial!
Investing today is more complex than ever. With stocks rising and falling on very little news while doing the opposite of what seems logical. Reading the Markets helps readers cut through all the noise delivering stock ideas and market updates, looking for opportunities.
We use a repeated and detailed process of watching the fundamental trends, technical charts, and options trading data. The process helps isolate and determine where a stock, sector, or market may be heading over various time frames.
To Find Out More Visit Our Home Page

Be the first to comment