

Terraxplorer/E+ via Getty Images
“No gains without pains.”– Poor Richard’s Almanack, 1745
When it comes to investing there are many different approaches that can lead to income growth over time. Investors who are young and have many years to wait for capital appreciation may have a different approach than older or more conservative investors who are seeking a reliable source of income while preserving capital. In this article, I am following Ben Franklin’s sage advice from many years ago where he remarked that,
“An investment in knowledge always pays the best interest”. – Benjamin Franklin
An investment vehicle in the form of a CEF (closed end fund) from the Franklin Templeton family of funds from Franklin Resources (BEN) leverages that knowledge. Since 1988 they have offered a fund that provides a reliable source of income for long-term investors while focusing on preservation of capital. The Franklin Universal Trust (NYSE:FT) focuses on high yield bonds and utility stocks with the goal of providing relatively high yield. Using fundamental research, the fund attempts to select a diversified portfolio of high yield corporate bonds and stocks that offer attractive dividend yields.
The FT CEF falls into the Tactical Allocation category based on Morningstar, which gives it a 4-star rating.
FT fund overview (fund website)
The fund has returned 8% per year in total returns (based on market price) since its inception. It has outperformed the high yield index that it uses as a benchmark over the past 1 year, 3 years, and 5 years and has outperformed several of its peers over the same timeframes, as I will discuss in more detail below.
fund performance (fund website)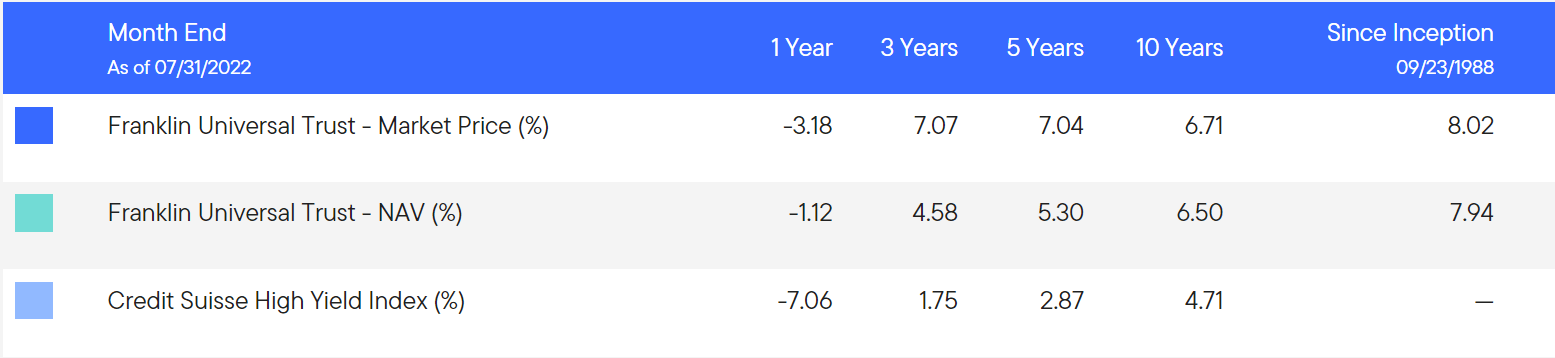
With just over $200M in AUM, the fund currently pays a monthly dividend of $.0425, which equates to an annual yield of 6.48% at the current market price of $7.87 as of market close on 9/2/22. The discount to NAV is about -2.5%, which is well above the 3-year average discount of -10%.
The fund has held up well so far in 2022 beating the total return of several similar funds including the Cohen & Steers Infrastructure fund (UTF) and John Hancock Tax-Advantaged Dividend Income Fund (HTD). In the past 9 months, FT has slightly outperformed those 2 funds, and it has provided a total return over the past 3 years that is slightly better with less volatility over that period.
comparison to UTF, HTD (Seeking Alpha)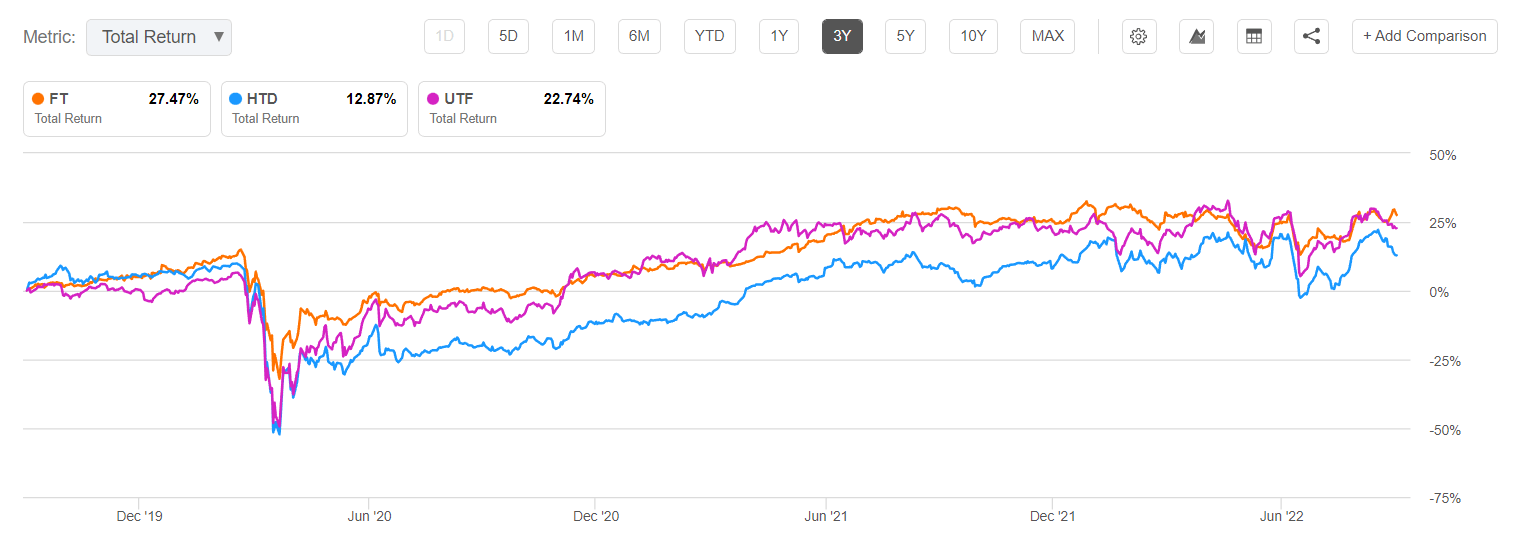
Franklin Universal Trust Holdings and Asset Allocation
“Being ignorant is not so much a shame, as being unwilling to learn.”― Benjamin Franklin
The fund’s portfolio as of 7/31/22 consists of 59% fixed income, 37% equities, and 4% cash. The top 10 holdings include mostly utility investments. One non-utility holding that stands out is Upstart 4002. The stock for Upstart Holdings, Inc. (UPST) is down -83% YTD, however, the holding is a corporate bond so while the company remains solvent, they are likely to continue paying off the bond. This strikes me as an unusually risky holding for what is otherwise a rather conservative fund, but it also provides a high yield source of fixed income to help meet the fund’s objective of a high yield distribution. The fund also provides financing for a significant amount of marketplace loans via Upstart Network, as well as similar financing vehicles such as LendingClub (LC), Prosper Funding LLC, Freedom Financial (OTCQX:FDVA), and others.
According to the semi-annual report issued in February, the total marketplace loans outstanding make up about 11% of the fund portfolio.
FT Top 10 holdings (fund website)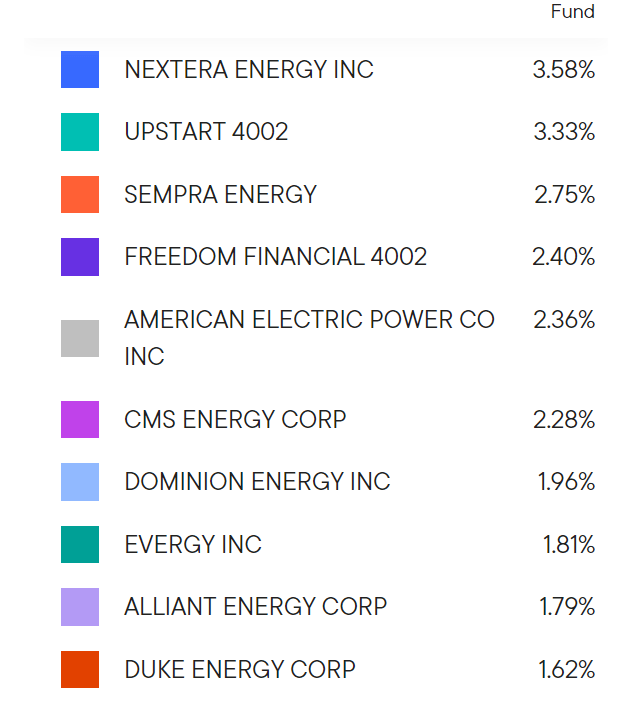
Common stocks make up about 43% as of February 28, 2022, and of those, electric utilities make up 22.6%, multi-utilities 16%, with smaller holdings of 1.6% in oil and gas and 2.6% in metals and mining.
Corporate bonds make up 69% of the portfolio. The total of those 2 classes of holdings exceeds 100% because the fund uses leverage. As of 7/31/22 the fund’s leverage is about 24%. The total number of holdings is 322.
The fixed income holdings are spread across several defensive sectors as shown in this snippet from the fund’s fact sheet dated June 30, 2022.
fixed income sector allocation (FT fact sheet)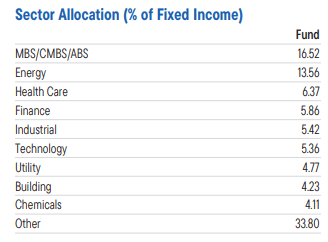
The fund focuses on high credit quality in the fixed income side of the portfolio with less than 10% junk-rated (CCC or lower) bonds.
fixed income credit quality (FT fact sheet)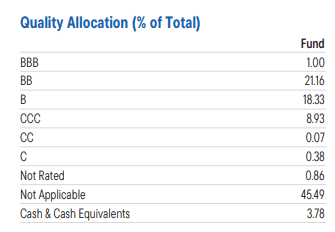
The focus on higher credit quality reduces the expected yield but provides lower risk to the portfolio NAV and thus better preservation of capital.
As I discussed in my previous article on Ares Dynamic Credit Allocation (ARDC), the trend for HY credit spreads has an impact on the performance of HY corporate bonds. When credit spreads are increasing, the funds holding HY fixed income tend to outperform and when those spreads compress the bond funds’ performance suffers. This commentary from the February semi-annual report discusses the impacts in terms of the fund’s fixed income performance in 2021 and what was expected for 2022 at the time based on the Russian invasion of Ukraine.
HY spreads ended 2021 close to the lows of the year despite a scare in the closing weeks from the Omicron variant and the Fed’s hawkish pivot. Since then, a broader risk-off tone set in as markets priced in more Fed tightening and escalating geopolitical risks around the Russia-Ukraine conflict prompted HY spreads to widen. HY credit fundamentals and corporate balance sheets, however, remained generally good, in our view. As of the fourth quarter of 2021, net leverage for the overall asset class and interest coverage levels were healthy. While input-cost inflation pressures and shortages could present some headwinds to the fundamental picture, the vast majority of U.S. HY sectors are not likely to be negatively impacted to a significant degree, in our view. However, the potential impacts to HY corporates from the Russia-Ukraine conflict are harder to quantify.
Now in August, the headwinds that were anticipated to occur have indeed pressured the broader market and has negatively impacted HY spreads in the 6 months since the semi-annual report was published. The latest annual report should be available soon and I will be interested to read the management commentary on how the fixed income part of the portfolio is holding up going into the second half of 2022.
How are Utilities Doing in 2022?
“He that can have patience can have what he will.”― Benjamin Franklin
Because the fund mostly invests in common stock and corporate bonds of utilities and other defensive sectors of the economy, the returns since the beginning of the year have held up relatively well. Looking at some of the top utility holdings, NextEra Energy (NEE) is just about breakeven on a YTD total return basis, underperforming the broader utility sector (XLU) which has returned 9.7%
NEE compared to XLU and SPY (Seeking Alpha)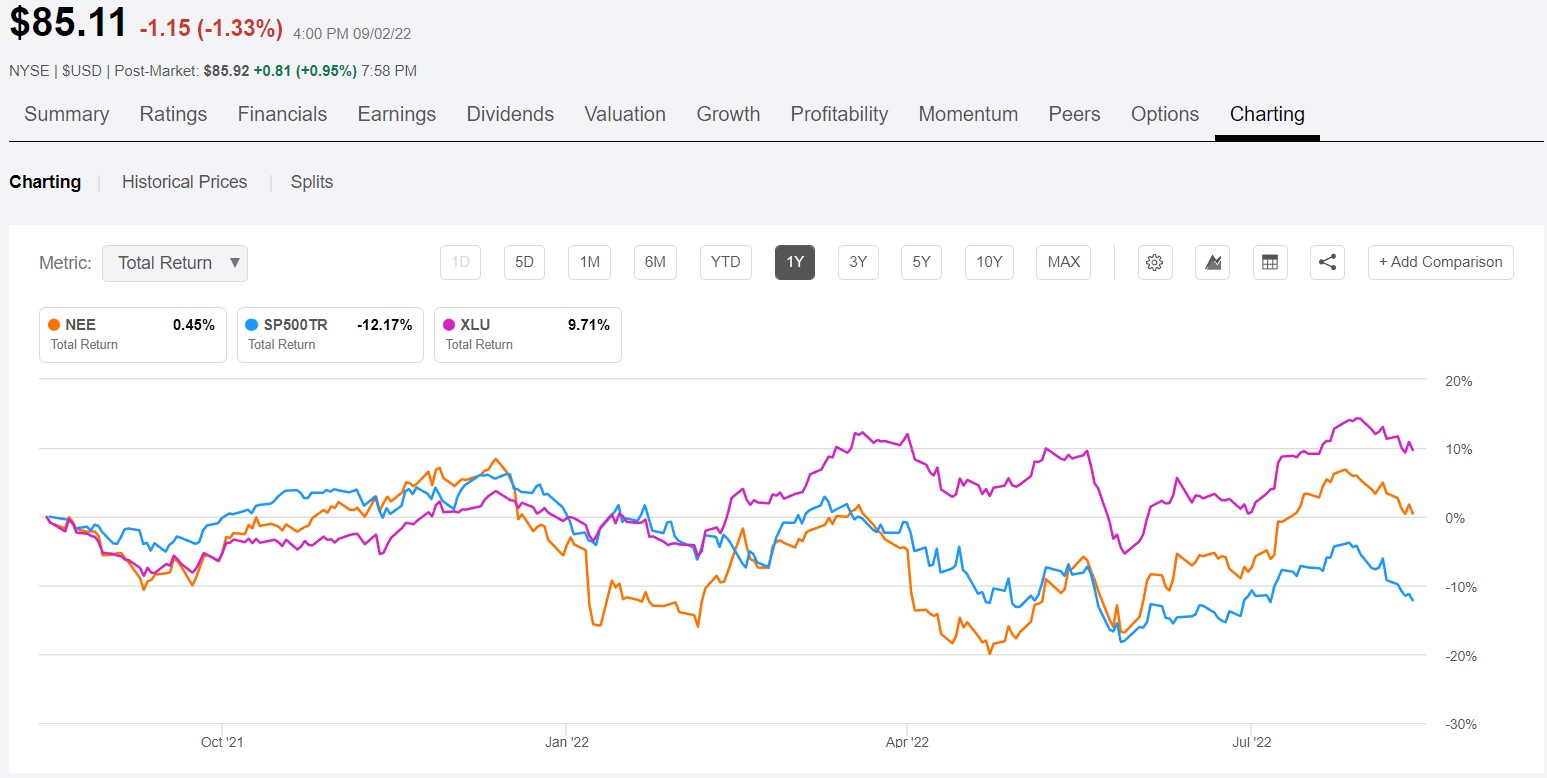
When reviewing some of the other top 10 holdings, these are the YTD total returns for each:
- Sempra Energy (SRE) = 28%
- American Electric Power (AEP) = 16.9%
- CMS Energy (CMS) = 5.9%
- Dominion Energy (D) = 7%
- Evergy (EVRG) = 2.9%
- Alliant Energy (LNT) = 2.5%
- Duke Energy (DUK) = 6.3%
Based on rising gas and electricity prices, many utilities are likely to continue to realize record profits in 2022 while asking for rate increases in 2023. For example, Consolidated Edison (ED) asked regulators for an 11.2% rate hike in electric bills and an 18.2% increase in gas bills.
In their Q222 earnings report, AEP reaffirmed guidance of $4.87 to $5.07 in operating earnings and a 6-7% long-term growth rate. The Q2 report for Sempra was also quite positive with a nearly 30% YOY increase in revenues and updated full-year EPS guidance of $6.90 to $7.50.
Next Era reported mixed Q2 results but offered encouraging forward guidance:
Q2 net income surged to $1.38B, or $0.70/share, from $256M, or $0.13/share, in the year-earlier quarter, while revenue jumped by nearly a third to $5.18B, which nevertheless was slightly below analyst estimates.
NextEra Energy said it continues to expect to grow its dividends per share at a ~10% annual rate through at least 2024, off a 2022 base, and it expects adjusted EPS of $2.98-$3.13 for 2023 and $3.23-$3.43 for 2024.
Distributions
“A Penny Saved is a Penny Earned”― Benjamin Franklin
The fund raised the regular monthly dividend in May 2021 from $.032 to $.0425 where it has remained. In December 2021 they declared a special dividend payable in January 2022 of $.0392 in short-term capital gains in addition to the regular $.0425 for a total distribution of $.0817. All the distributions except for the special dividend are composed of 100% income.
FT distribution history (fund website)
The fund does offer a dividend reinvestment plan which includes a discount to market price whenever the market price exceeds the NAV. For most of the fund’s history, the fund’s market price has been trading at a discount to NAV, so most investors have not been able to take advantage of that aspect of the policy. Fund investors are automatically enrolled in the plan unless they elect to take the distributions in cash.
If the Fund declares a dividend or capital gain distribution payable either in cash or in stock of the Fund and the market price of shares on the valuation date equals or exceeds the net asset value, the Fund will issue new shares to you at the higher of net asset value or 95% of the then current market price.
Conclusion
“Either write something worth reading or do something worth writing.”― Benjamin Franklin
The FT fund portfolio’s hybrid blend of utility and defensive sector stocks combined with fixed income holdings has provided investors with a reliable formula for a steady income stream without having to sacrifice capital appreciation. The defensive nature of the fund has worked well during the difficult bear market in the first nine months of 2022 and appears poised to continue outperforming in 2023 as utilities increase rates and fixed income investments benefit from the eventual recovery in US economic conditions.
The fixed income part of the portfolio provides a base level of income for distributions while minimizing risk of capital loss as prices fluctuate. The fund’s use of leverage helps to accentuate the capital gains from the equity side as utilities benefit from growth in revenues and earnings that is likely to continue into 2023.
Because the discount to NAV is narrowing it may be better to wait to establish a position in the fund if you are new to this investment opportunity. With an average discount of nearly -12% over the past 5 years, the fund is now trading near par at a -2.48% discount based on 9/2/22 market close.
fund pricing data (CEFconnect)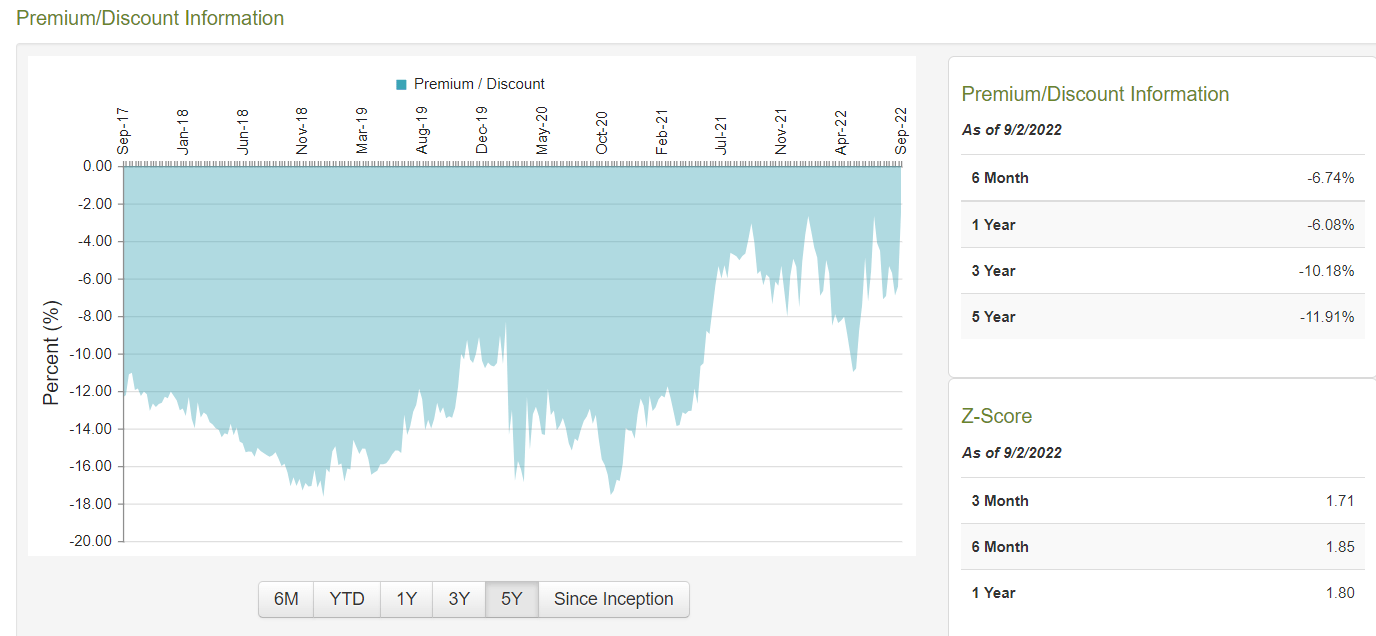
If you are a conservative (risk-averse) investor looking for steady monthly income with a side serving of capital preservation, the fund managers at Franklin Templeton offer up an excellent vehicle in FT for compounding returns over time with a well-managed hybrid fund that is defensive in nature and has an excellent long-term track record. I am long FT in my own portfolio and look to add more on any market weakness that provides an opportunity to increase my position at discounted prices.
Be the first to comment