

Nicholas Wright
Introduction
The Toronto-based Franco-Nevada Corporation (NYSE:FNV) released its third quarter of 2022 results on November 7, 2022.
Note: I have been covering FNV quarterly on Seeking Alpha since March 2017. This article is an update of my preceding article, published on August 14, 2022.
Franco Nevada owns 413 assets worldwide:
FNV Map (FNV Presentation)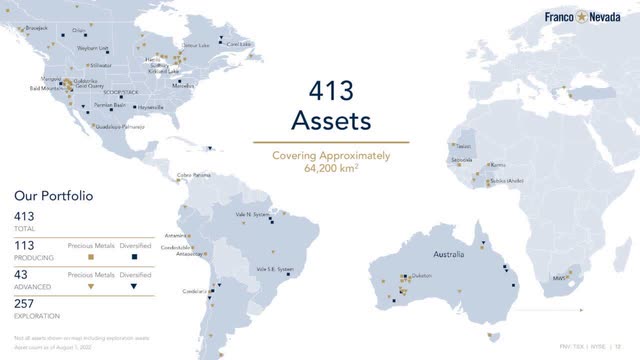
The company added three:
- On October 27, 2022, we acquired a 2% NSR on Argonaut Gold Inc.’s (“Argonaut”) construction-stage Magino gold project located in Ontario, Canada, for a purchase price of $52.5 million.
- On October 6, 2022, we acquired a 2% NSR on all of Westhaven Gold Corp.’s (“Westhaven”) claims across the Spences Bridge Gold Belt in Southern British Columbia, Canada, for $6.0 million and an existing 2.5% NSR from Westhaven on adjoining properties currently owned by Talisker Resources Ltd. for a purchase price of $0.75 million.
- On July 18, 2022, we acquired, through our wholly-owned subsidiary, Franco-Nevada (Barbados) Corporation (“FNBC”), a gold stream concerning production from the Tocantinzinho project, owned by G Mining Ventures Corp. (“G Mining Ventures”) and located in Pará State, Brazil (the “Stream”).
1 – 3Q22 Quick Snapshot
Franco-Nevada came out with adjusted quarterly earnings of $0.83 per share, or $159.7 million. The company generated $304.2 million in the third quarter, down 3.8% from last year’s same quarter. Lower commodity prices were to blame.
Metals production in GEOs was lower than a year ago, with 176,408 GEOs sold compared with 177,578 GEOs last year.
However, this quarter’s energy revenues were high but lowered sequentially, reaching $83.8 million.
Below are the revenues per segment in the third quarter of 2021:
FNV Quarterly Revenues per metal history 3Q22 (Fun Trading)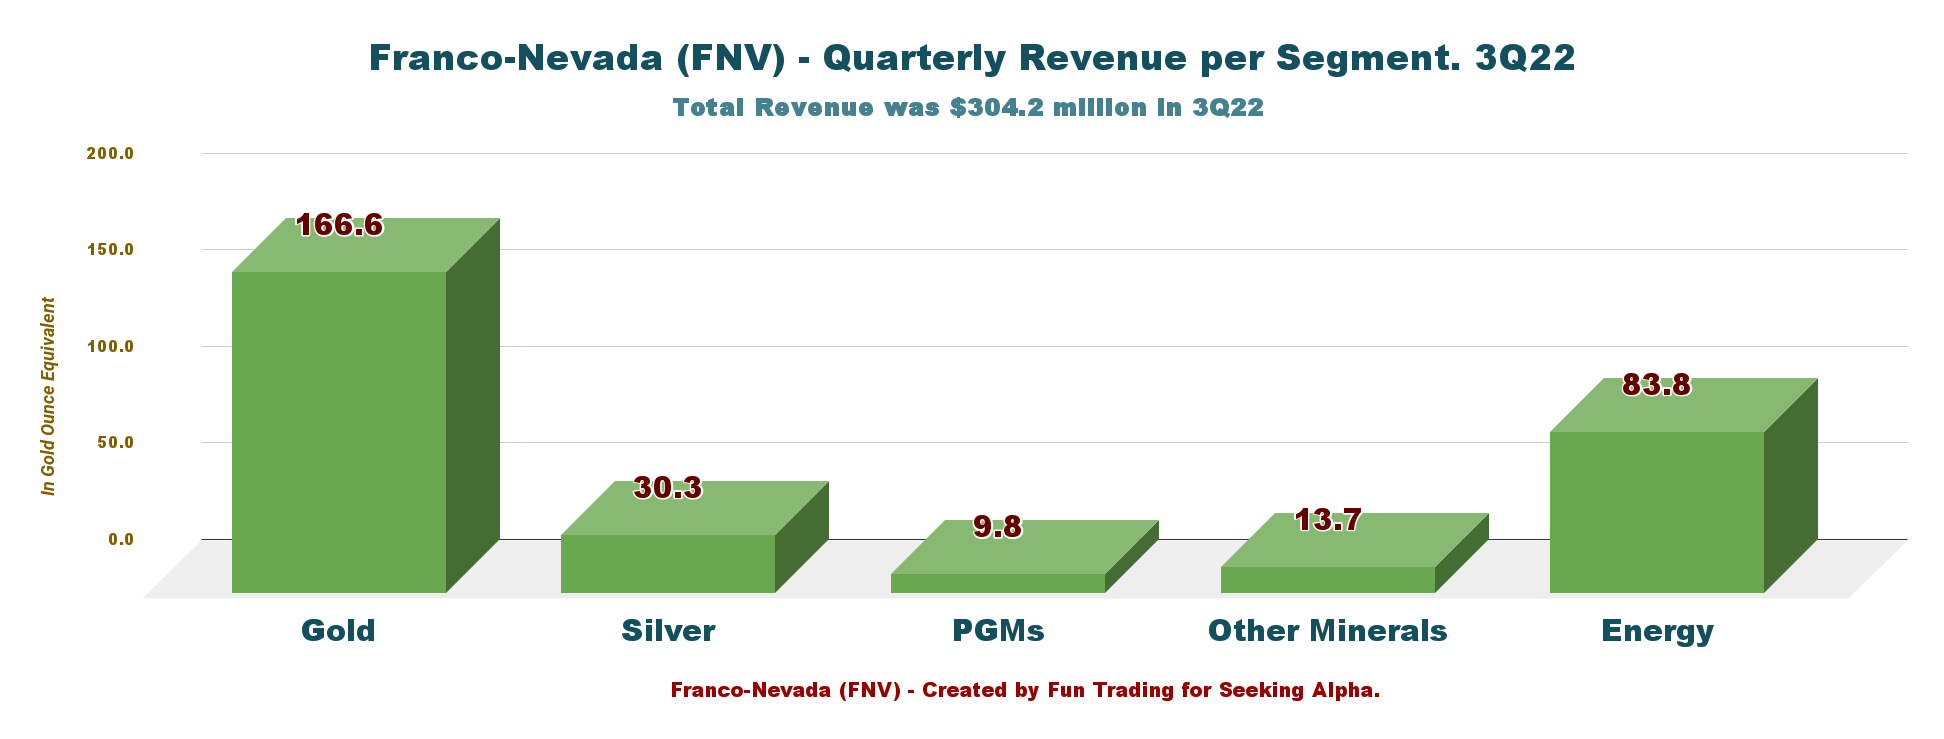
The company is highly dependent on the gold price, representing 54.8% of the total revenues in 3Q22. The energy sector is growing significantly and now represents 27.5%.
2 – Stock Performance
As I have indicated for years, Franco-Nevada is one of my most significant long-term investments in the streaming sector, followed closely by Wheaton Precious Metals (WPM).
The company’s fundamentals are flawless, with no debt and a cash position of $1,057.4 million, up strongly quarter over quarter.
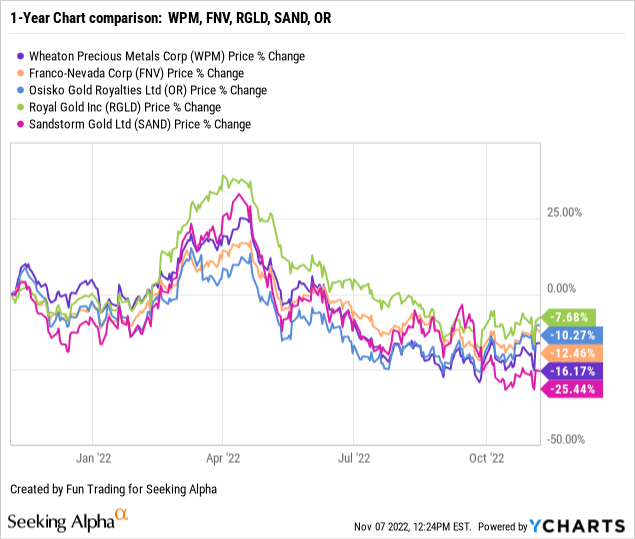
FNV has followed its competitor Wheaton Precious Metals, closely. FNV is down 12% on a one-year basis, whereas WPM is down 16%. Meanwhile, Royal Gold (RGLD) outperforms the group and is down 8%.
For those following RGLD, I recommend reading my article on the 3Q22 results by clicking here.
3 – Investment Thesis
The investment thesis continues to be the same quarter after quarter. Franco Nevada presents a low-risk profile, with 90% of assets located in the Americas, which is excellent support from a long-term investment perspective.
FNV Assets presentation (FNV Presentation)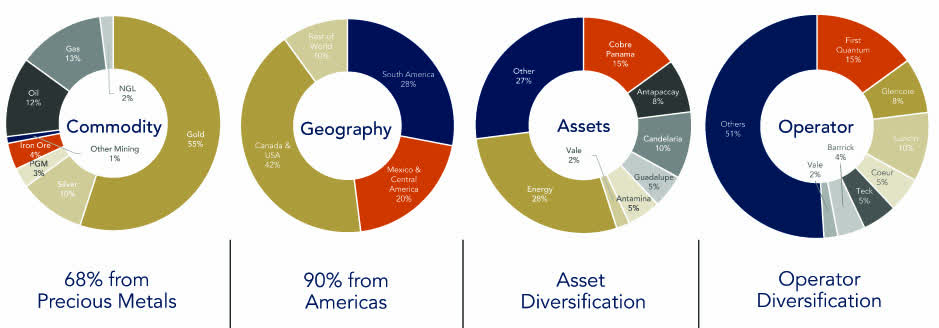
The most positive factor is the strong balance sheet here. FNV has total cash of $1,057.4 million as of September 30, 2022, and above all, no debt. This excellent profile could allow the company to acquire good assets at a distressed price.
However, Franco Nevada is highly dependent on commodity prices and fluctuates widely. Gold is the primary metal for FNV, weakening due to the FED’s action against inflation. The FED raised interest rates by 75-point on November 2 and will likely hike another 75-point on December 22. Gold will stay bearish until the FED signals a pause which may take a good part of 2023. On the other hand, one component that could help Gold and FNV is the U.S. dollar. A weak U.S. dollar will help Gold recover faster, and the U.S. dollar is now losing some steam.
Thus, I recommend short-term trading LIFO 40% of your position and keeping the remainder for a much higher target.
This dual strategy has been my dominant strategy recommended in my marketplace, “The Gold and Oil Corner,” and it is the best way to maximize your gain over a long period.
Franco-Nevada – A Solid Balance Sheet and Production in 3Q22, the Raw Numbers
| Franco-Nevada | 3Q21 | 4Q21 | 1Q22 | 2Q22 | 3Q22 |
| Total Revenues in $ Million | 316.3 | 327.7 | 338.8 | 352.3 | 304.2 |
| Net income in $ Million | 166.0 | 220.9 | 182.0 | 196.5 | 157.1 |
| EBITDA $ Million | 270.0 | 341.4 | 285.3 | 302.8 | 257.2* |
| Adjusted EBITDA $ Million | 269.8 | 269.8 | 286.6 | 301.2 | 256.7 |
| EPS diluted in $/share | 0.87 | 1.16 | 0.95 | 1.02 | 0.82 |
| Operating Cash Flow in $ Million | 206.9 | 279.0 | 230.6 | 257.3 | 232.3 |
| CapEx in $ Million | 7.1 | 19.2 | 3.1 | 10.3 | 1.9 |
| Free Cash Flow in $ Million | 199.8 | 259.8 | 227.5 | 247.0 | 230.4* |
| Total cash $ Million | 346.7 | 423.0 | 722.7 | 910.6 | 1,057.4 |
| Long-term Debt in $ Million | 0 | 0 | 0 | 0 | 0 |
| Dividend per share in $ | 0.30 | 0.32 | 0.32 | 0.32 | 0.32 |
| Shares outstanding (diluted) in Million | 191.5 | 191.3 | 191.7 | 191.9 | 191.9 |
| GEOs | 3Q21 | 4Q21 | 1Q22 | 2Q22 | 3Q22 |
| Production gold equivalent K Oz Eq. | 146,495 | 138,799 | 139,685 | 131,574 | 128,427 |
| Production GEO, including Energy | – | 182.543 | 178,614 | 191,052 | 176,408 |
| Gold price | 1,789 | 1,795 | 1,874 | 1,872 | 1,728 |
Data Source: Company document
* Estimated by Fun Trading
Note: More historical data starting in 2015 are available for subscribers only.
Analysis: Revenues, Earnings Details, Free Cash Flow, Debt, And Production Details
1 – Revenues were $ million in 3Q22
FNV Quarterly Revenue History (Fun Trading) During the third quarter of 2022, the company generated $304.2 million, down from $316.3 million in the same quarter a year ago and down 13.7% sequentially. Net income came in at $157.1 million, $0.82 per diluted share, and $159.7 million adjusted net income, or $0.83 per share. Revenues were down this quarter due mainly to lower commodity prices.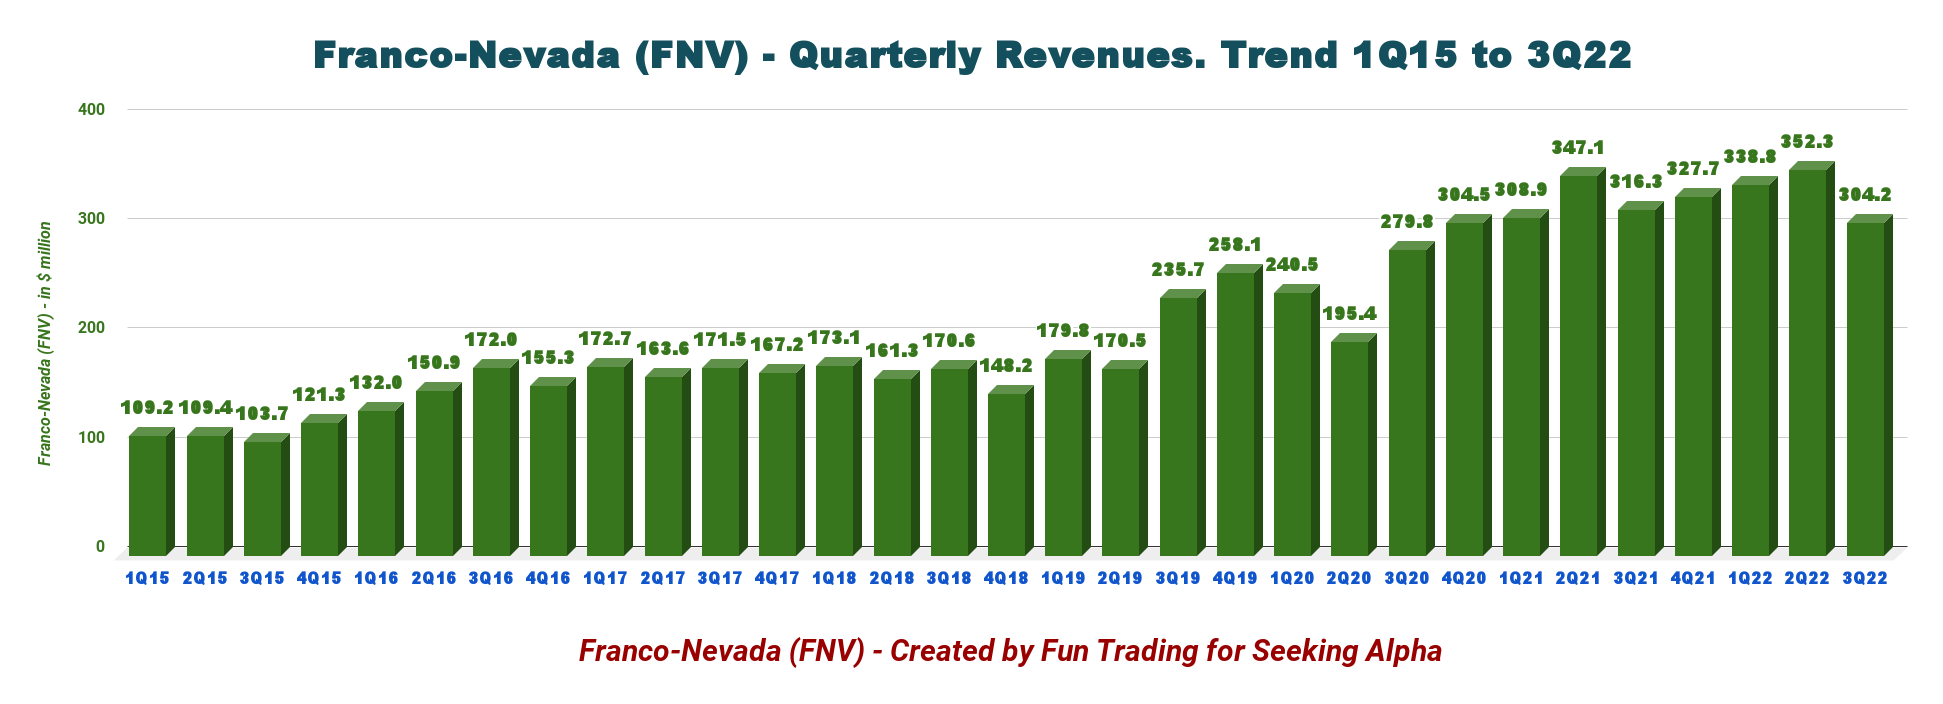
Adjusted EBITDA in 3Q22 decreased 4.9% from 3Q21 to $256.7 million.
Oil and gas assets added $83.8 million to Franco-Nevada’s overall quarter results.
CEO Paul Brink said in the press release:
Cobre Panama’s record production for the quarter is not fully reflected in our Q3 GEO sales due to timing of shipments. Franco-Nevada has record GEOs, revenue, net income, Adjusted Net Income and Adjusted EBITDA for the three quarters through September 30, 2022 and is on-track to meet full year guidance. The weaker gold price environment has led to an increase in demand for royalty and stream financing. We are pleased to have acquired a royalty on Argonaut’s Magino project in Ontario that is currently under construction and our business development group remains very active.
2 – Free Cash Flow Was $ million in 3Q22
FNV Quarterly Free cash flow history (Fun Trading) Note: The free cash flow is cash from operating activities minus CapEx.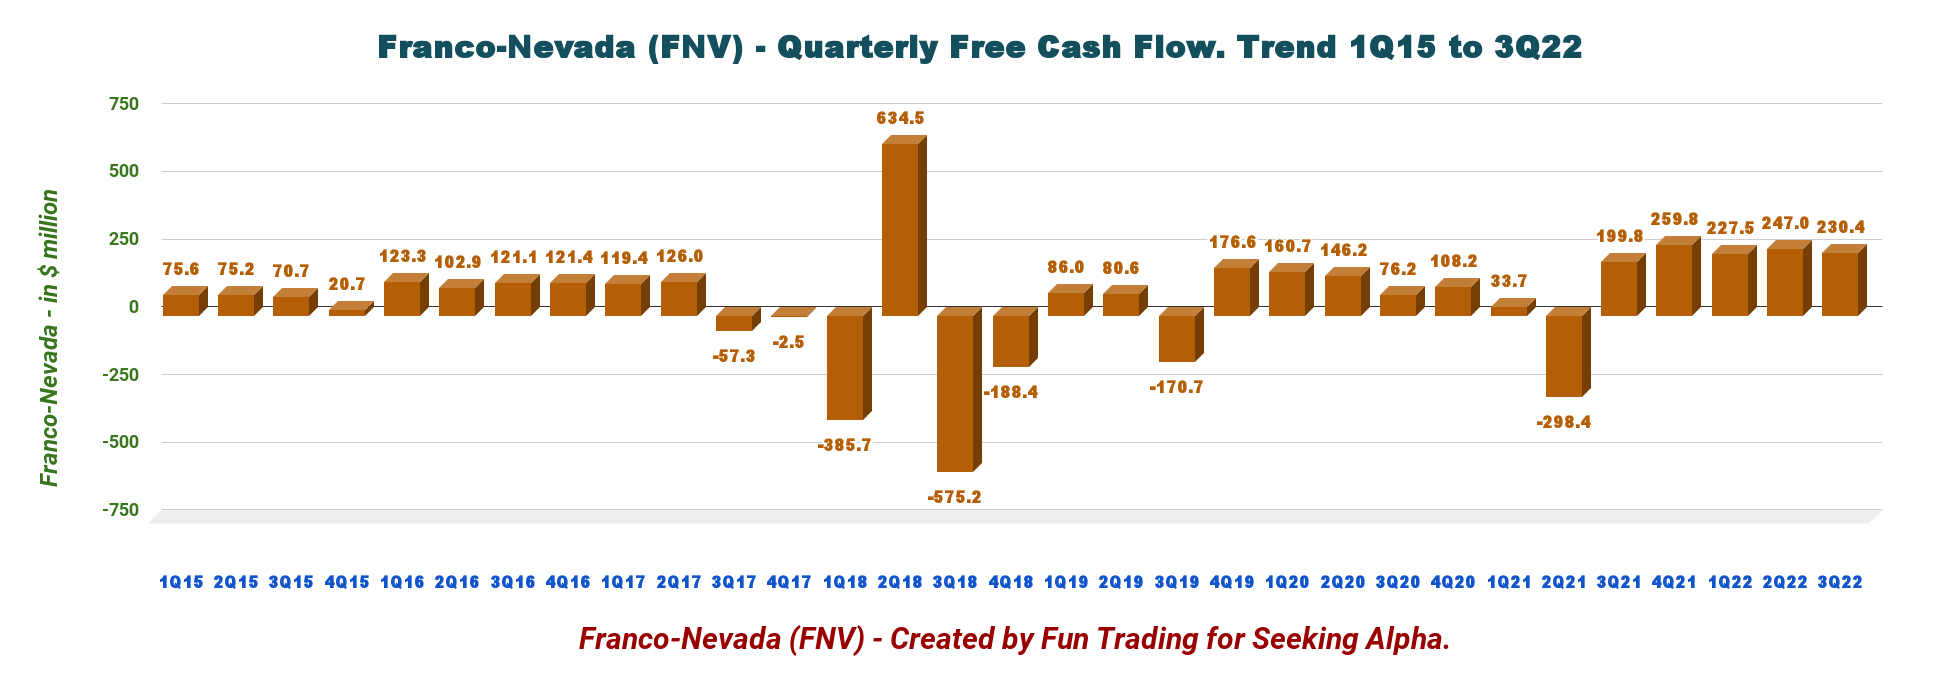
This quarter, the company earned $247.0 million in free cash flow and a trailing 12-month free cash flow of $934.1 million.
Franco-Nevada announced that its Board of Directors had declared a quarterly dividend of $0.32 per share in 2Q22. The dividend is too low, with a yield of 1.33%.
3 – The Company Has No Debt And $1,057.4 million in cash as of September 30, 2022
Franco-Nevada continues to deliver another perfect financial profile, with cash and cash on hand of $1,057.7 million in 3Q22 and no debt.
FNV Quarterly Cash versus Debt history (Fun Trading)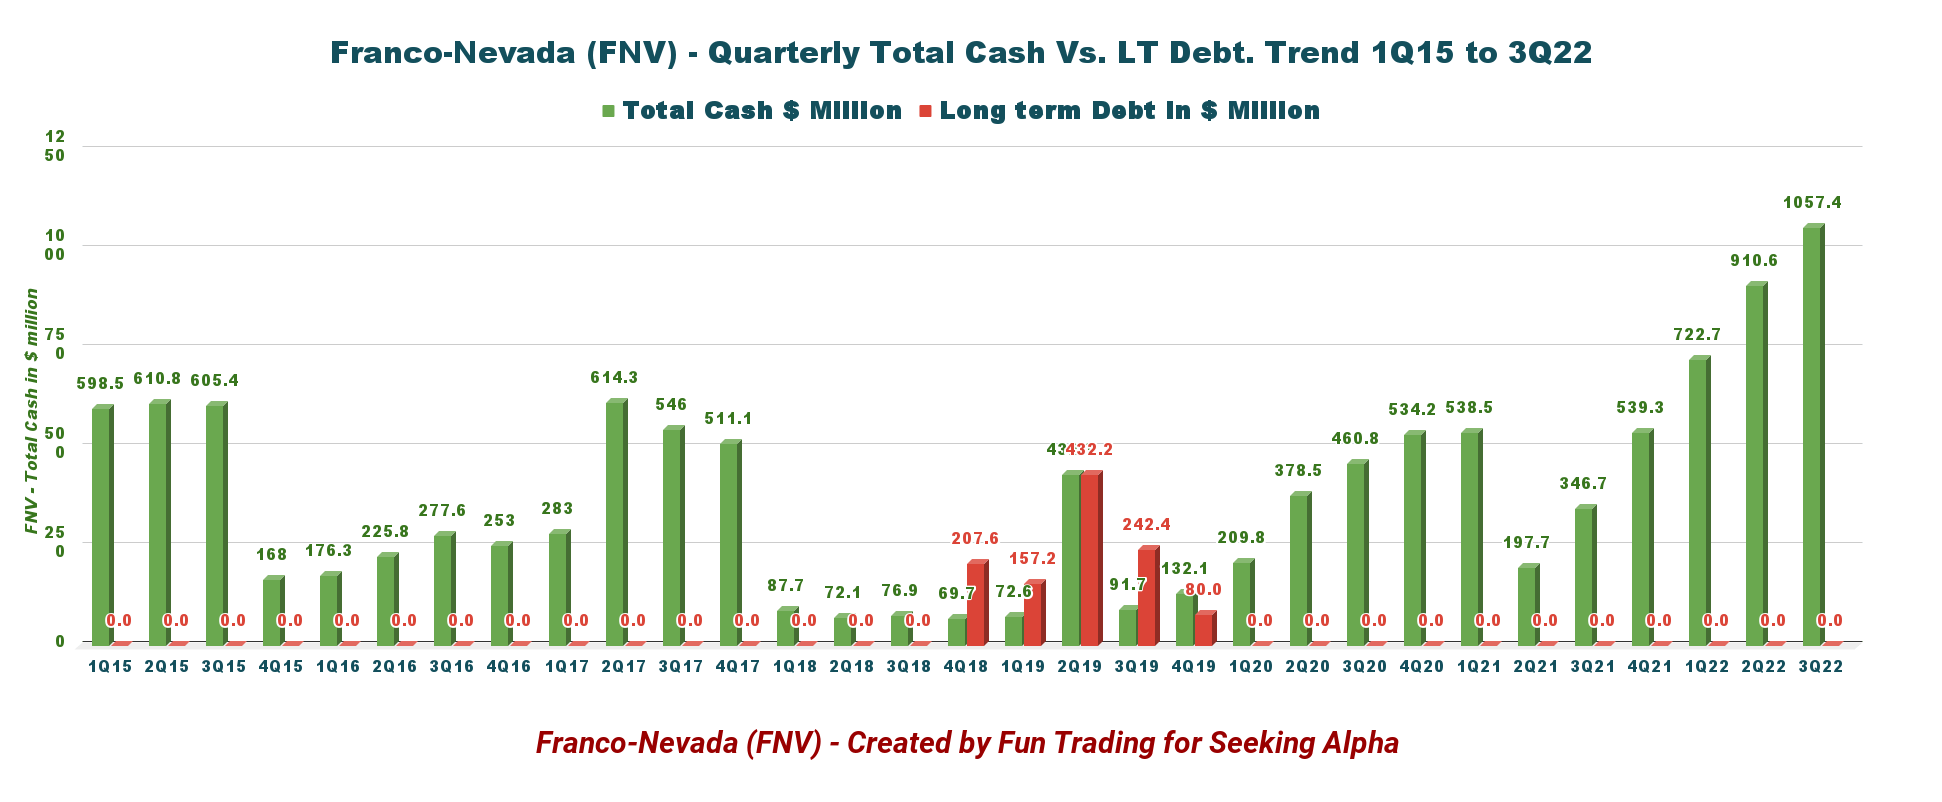
Also, Franco-Nevada has $2.0 billion in available capital as of September 30, 2022.
4 – Production in Gold Equivalent Ounces was 128,427 GEOs in 3Q22 and 176,408 GEOs, including The Energy Assets
FNV Quarterly GEO history (not including oil, NGL, gas) (Fun Trading)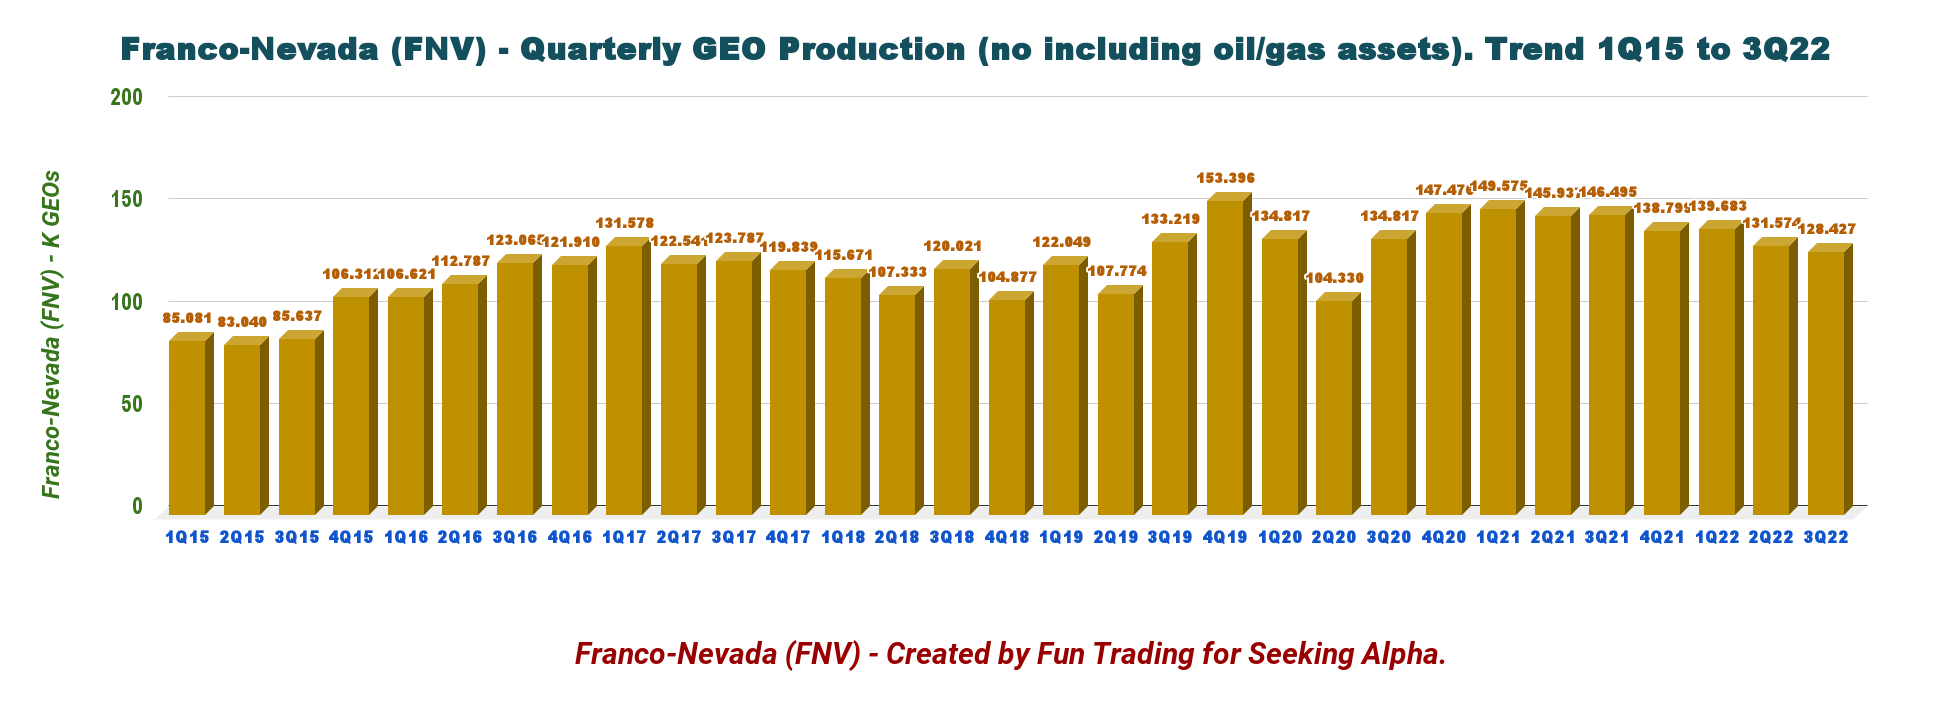
Franco-Nevada stated that it sold 128,521 gold equivalent ounces in 3Q22 (not counting the Energy segment), significantly down from 146,495 GEOs in the same quarter a year ago.
The total production, including the energy segment, was 176,408 GEOs, down slightly from 177,578 GEOs in 3Q21.
FNV Quarterly GEO Production including Energy History (Fun Trading)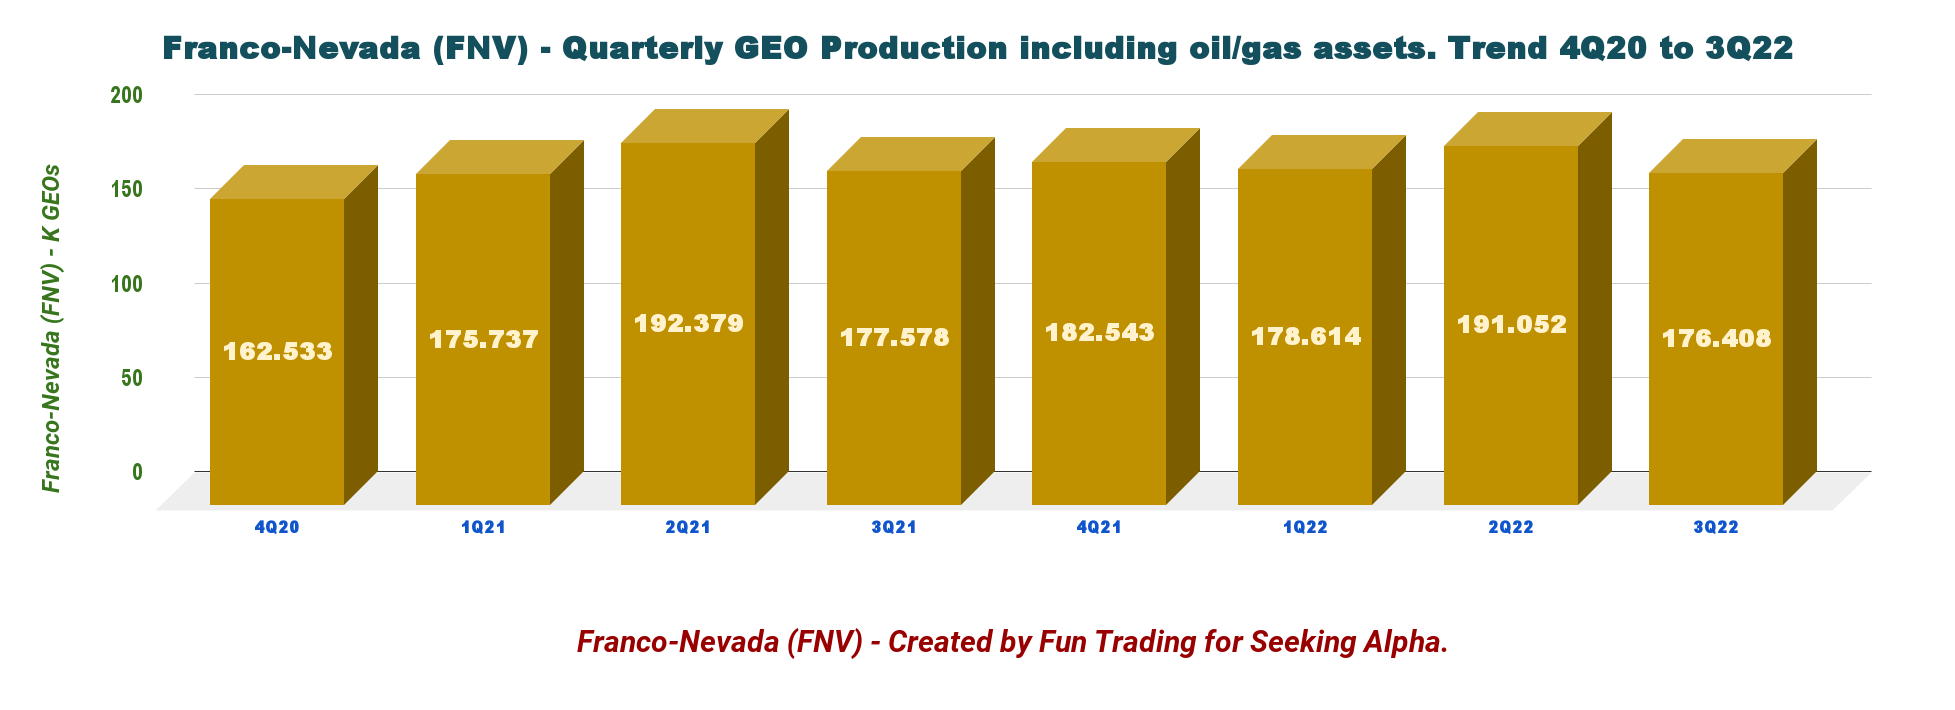
Gold represented 54.8% of the total output in 3Q22, including energy.
Details per segment are presented below:
FNV Quarterly Production per metal 3Q22 (Fun Trading)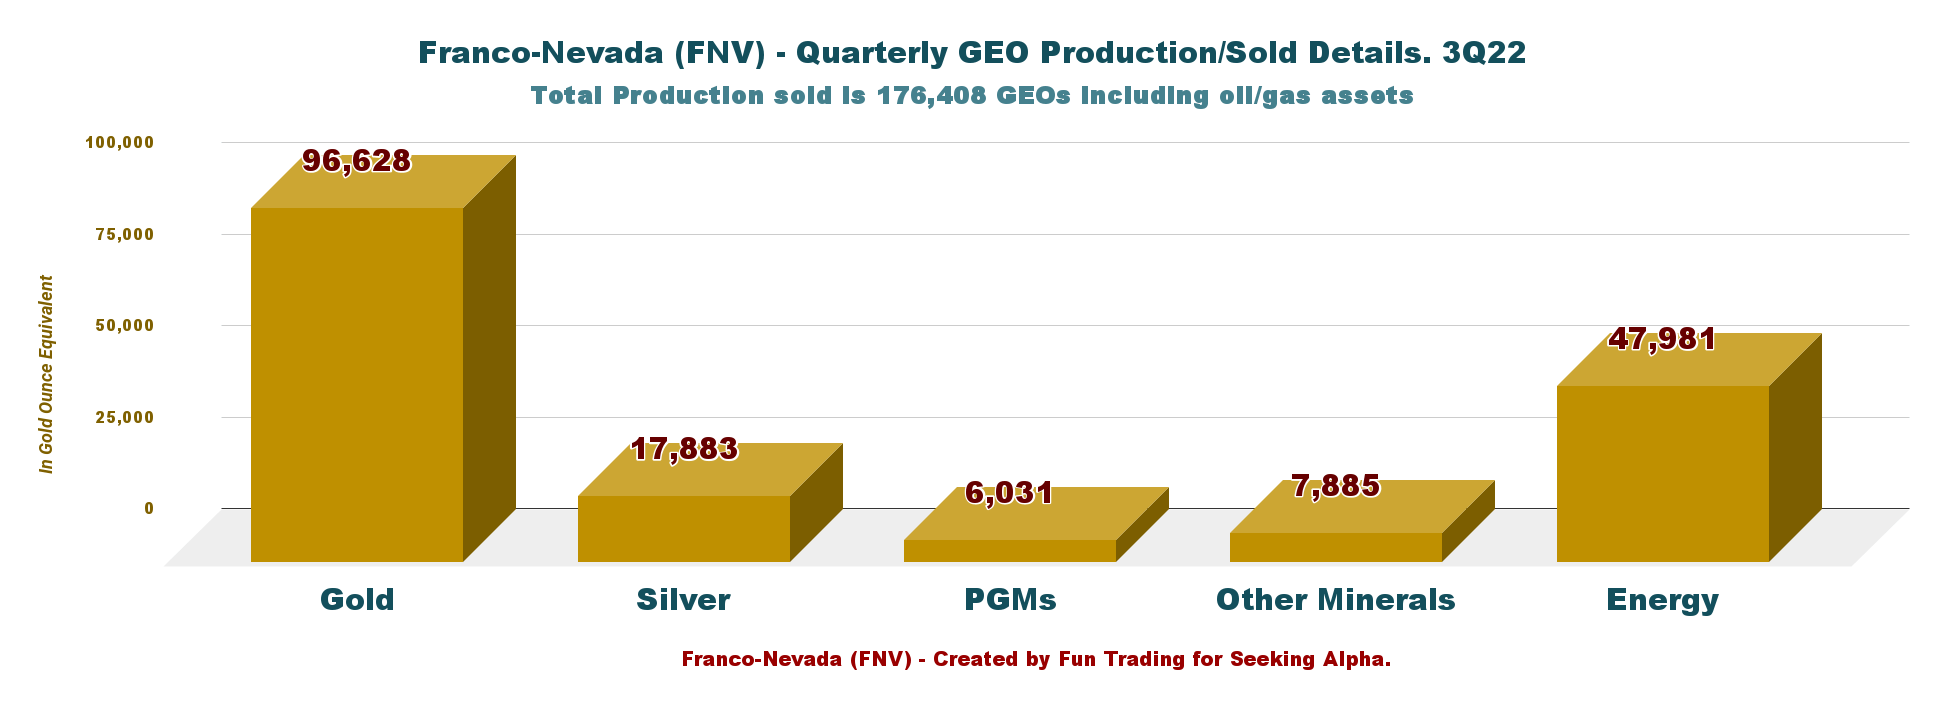
- $1,728/oz gold (Q3 2021 – $1,789)
- $19.22/oz silver (Q3 2021 – $24.36)
- $886/oz platinum (Q3 2021 – $1,024)
- $2,074/oz palladium (Q3 2021 – $2,459)
- $105/tonne Fe 62% CFR China (Q3 2021 – $191),
- $91.56/bbl WTI oil (Q3 2021 – $70.52)
- And $7.91/mcf Henry Hub natural gas (Q3 2021 – $4.32).
5 – Guidance 2022: Franco Nevada Remains On Track To Meet Its Previously Announced 2022 GEO Guidance
FNV 2022 Guidance (FNV Presentation)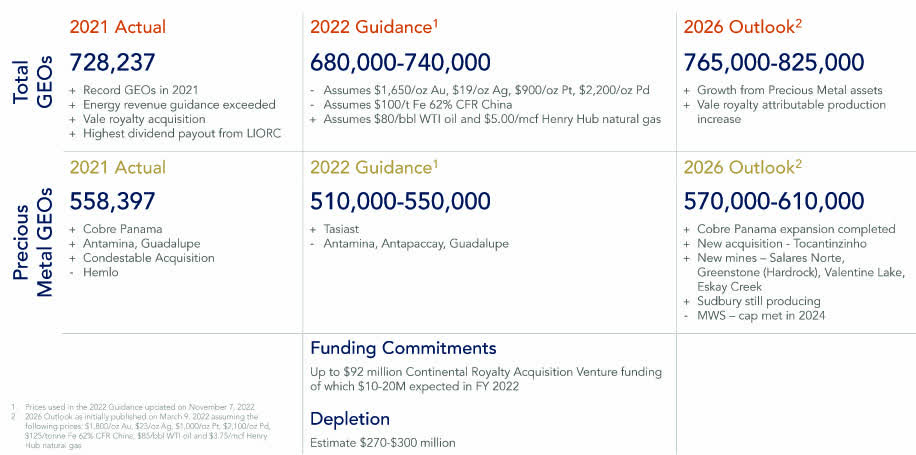
The company also indicated 2026 Outlook with 765K-825K GEOs.
Technical Analysis And Commentary
FNV TA Chart short-term (Fun Trading StockCharts)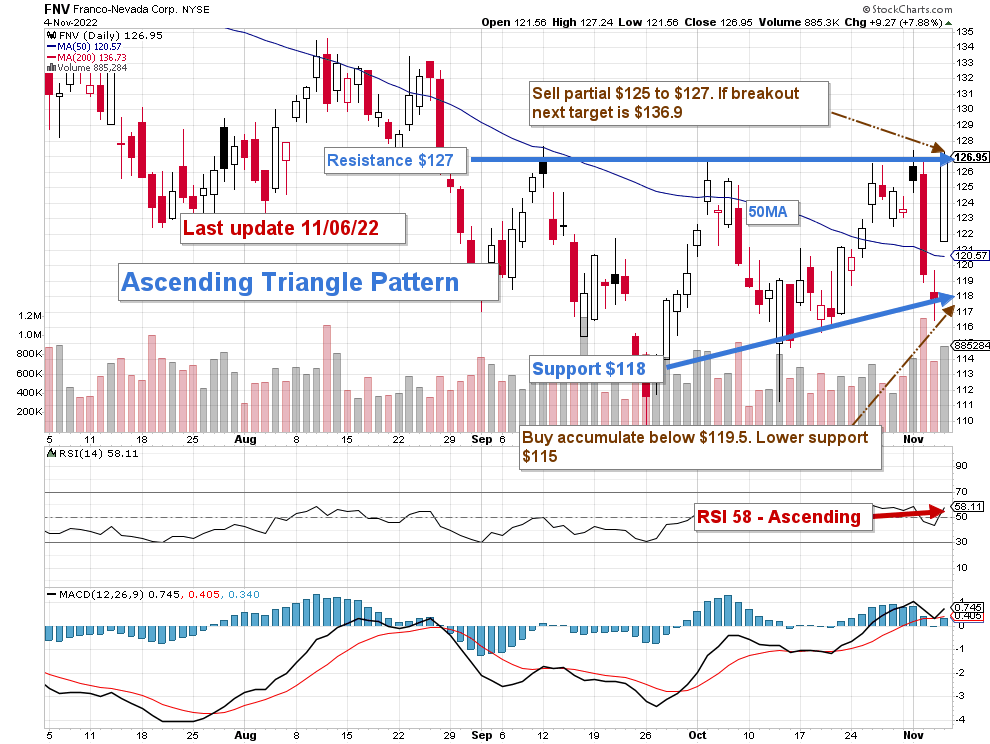
Note: The chart has been adjusted for the dividend.
FNV forms an ascending triangle pattern with resistance at $127 and support at $118. The ascending triangle is a bullish formation that usually forms during an uptrend as a continuation pattern. Thus, the probability of a breakout is high.
The dominant strategy that I regularly encourage in my marketplace, “The Gold and Oil Corner,” is to keep a core long-term position and use about 40% to trade LIFO FNV while waiting for a higher final price target for your core position.
I suggest buying FNV below $120.6 (50MA) with potential lower support at $115. Conversely, it is reasonable to take profits between $125 and $127 with higher resistance at $136.9.
Note: The LIFO method is prohibited under International Financial Reporting Standards (IFRS), though it is permitted in the United States to generally accepted accounting principles (GAAP). Therefore, only U.S. traders can apply this method. Those who cannot trade LIFO can use an alternative by setting two different accounts for the same stock, one for the long term and one for short-term trading.
Warning: The TA chart must be updated frequently to be relevant. It is what I am doing in my stock tracker. The chart above has a possible validity of about a week. Remember, the TA chart is a tool only to help you adopt the right strategy. It is not a way to foresee the future. No one and no.. thing can.
Author’s note: If you find value in this article and would like to encourage such continued efforts, please click the “Like” button below as a vote of support. Thanks.
Be the first to comment