

Khosrork
Buying world-beater blue-chips for the long term is the easiest and lowest-risk way to compound income and wealth over time.
Ben Carlson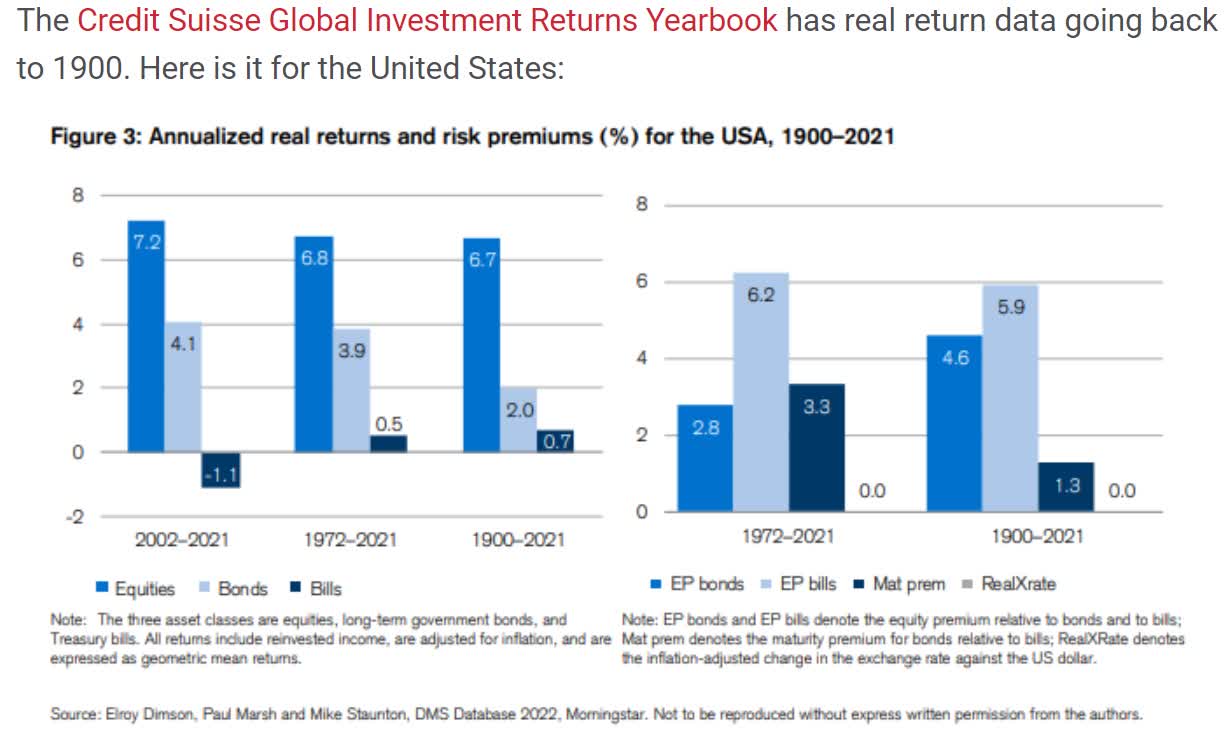
US stocks have delivered 7.2% post-inflation returns for the last 121 years.
- 4,504X inflation-adjusted return in 121 years
According to BlackRock, US stocks have delivered 7% annual real returns since 1816, an amazing 206 years of doubling inflation-adjusted wealth every decade.
- 1,129,948X real return over the last two centuries
But of course, it’s a market of stocks, not a stock market.
Charlie Bilello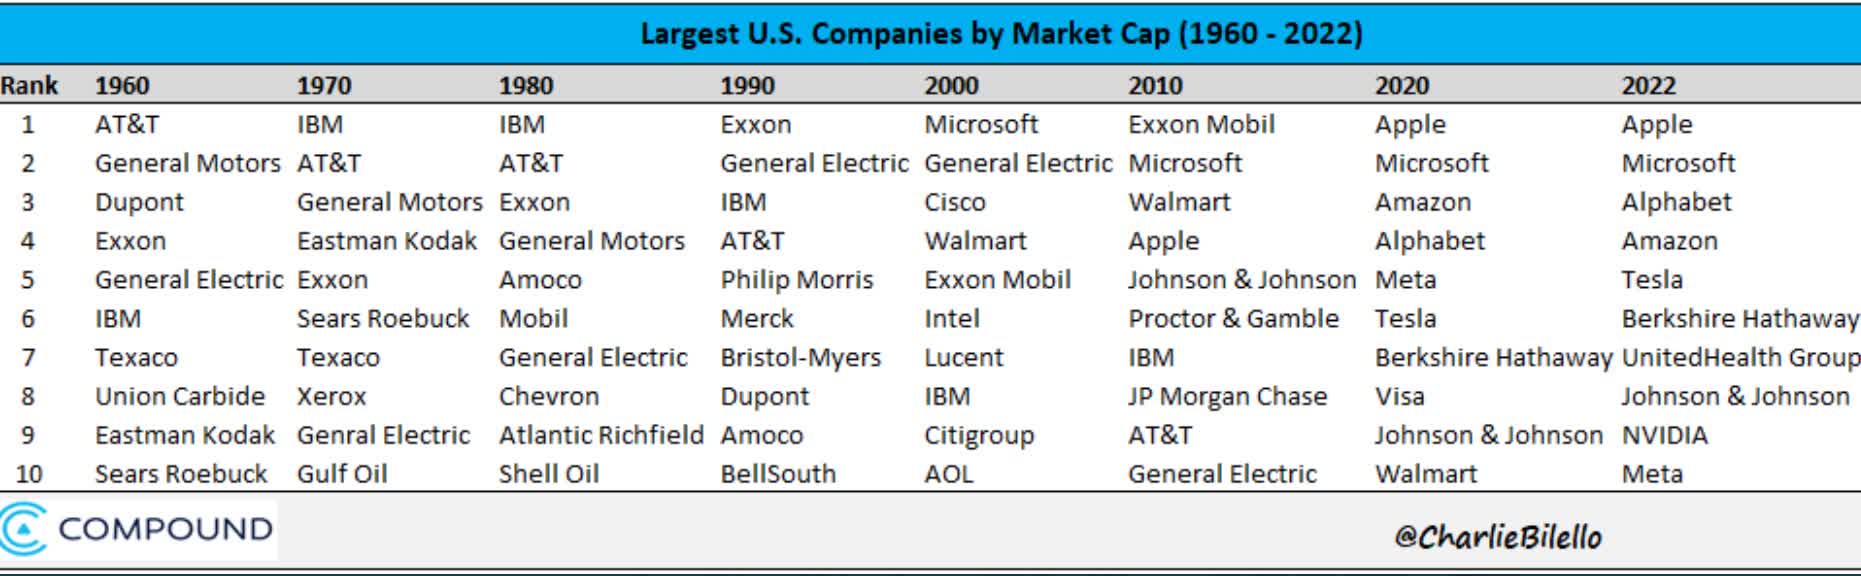
AT&T (T) was the largest company in the US in 1960 and made up almost 8% of the total stock market at its peak (and approximately 5% of the global stock market).
Yet AT&T has delivered literally zero inflation-adjusted returns over the last 21 years, losing to every single asset other than cash, commodities and the world’s worst hedge fund managers.
Similarly, Sears, the Amazon (AMZN) of its day, was at one point the 6th largest company in America. Due to terrible management and competition from digital retail, Sears is now Bankrupt.
General Electric (GE) was once a dividend aristocrat, the most valuable company on earth. In 1999 Fortune Magazine dubbed Welch the “Manager of the century”.
YCharts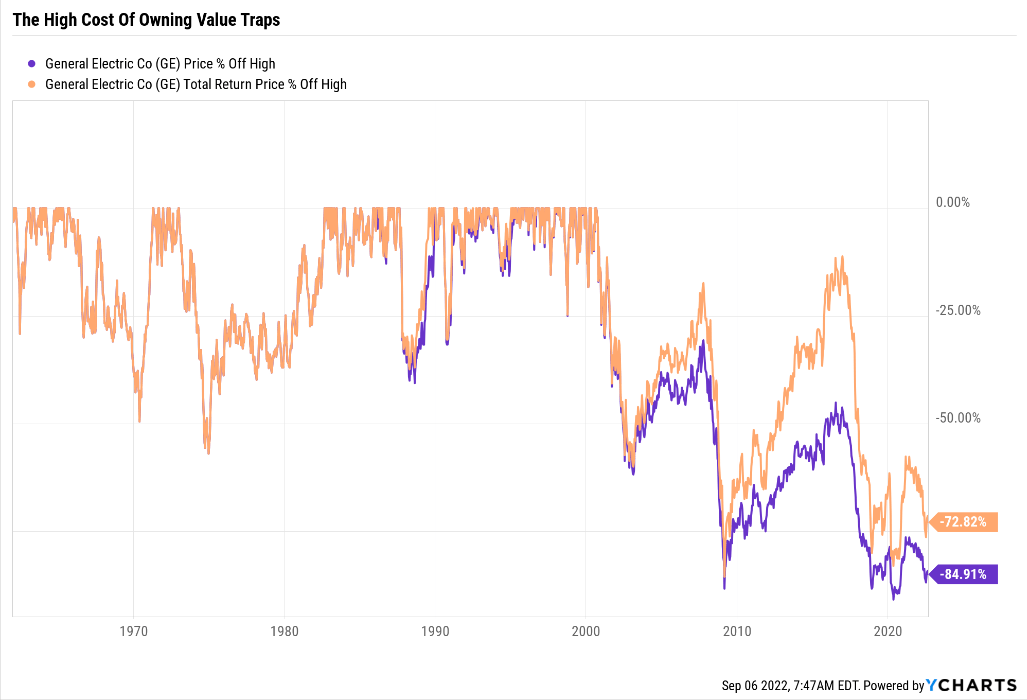
GE is still 73% off its highs, including dividends, after suffering a 90% peak decline during the Pandemic.
Let me repeat that. After 21 years, investors who bought GE at the peak of its glory (and some would say hubris) were down 90% and are still down 73% today.
And guess what? These are hardly the only examples of former world-beater blue-chips that fell from grace.
- Kmart and Winn-Dixie are former dividend aristocrats
- and went bankrupt, wiping out investors
JPMorgan Asset Management
According to JPMorgan from 1980 to 2020 44% of all US stocks suffered “permanent catastrophic” declines. That means a 70+% decline from record highs that these companies never recovered from.
A famous study from Arizona State’s W. P. Carey School of Management found something shocking about those incredible returns from US stocks.
The results also help to explain why active strategies, which tend to be poorly diversified, most often underperform,” says Bessembinder, who found that the largest returns come from very few stocks overall – just 86 stocks have accounted for $16 trillion in wealth creation, half of the stock market total, over the past 90 years. All of the wealth creation can be attributed to the thousand top-performing stocks, while the remaining 96 percent of stocks collectively matched one-month T-bills. (Do Stocks Outperform Treasury Bills?)
4.3% of US stocks since 1926, just 1,096 companies, delivered 100% of that incredible net worth growth, making the US stock market the envy of the world.
And just 0.33%, or 86 companies, delivered 50% of net gains in US stocks for over 94 years.
What’s the takeaway for your portfolio? Simple.
- Even the world’s greatest companies can fall
- you need to own a diversified and prudently risk-managed portfolio
- you need to hold the world-beaters for as long as the thesis holds
- you have to be aware of former world-beaters whose investment thesis has broken or is at high risk of breaking
Several Dividend Kings members have requested an update on Intel (NASDAQ:INTC), one of the best-performing stocks in history, which is trading at some of its lowest valuations in two decades.
After examining Intel, I’ve concluded that there are three reasons why it’s likely a value trap, and a blue-chip that’s best avoided, especially when there are far superior alternatives such as Cisco (CSCO) and the Schwab US Dividend Equity ETF (SCHD).
So let’s take a look under Intel’s hood to see why you likely don’t want to buy Intel today and why CSCO and SCHD are potentially far superior high-yield blue-chip investments you can safely buy today.
Reason One: Intel Has Lost Its Mojo, And It’s Going To Spend A Fortune Trying To Get It Back
Intel was founded in 1968 in Silicon Valley, one of the original world-beater US tech giants. For decades Intel owned the CPU market.
Statista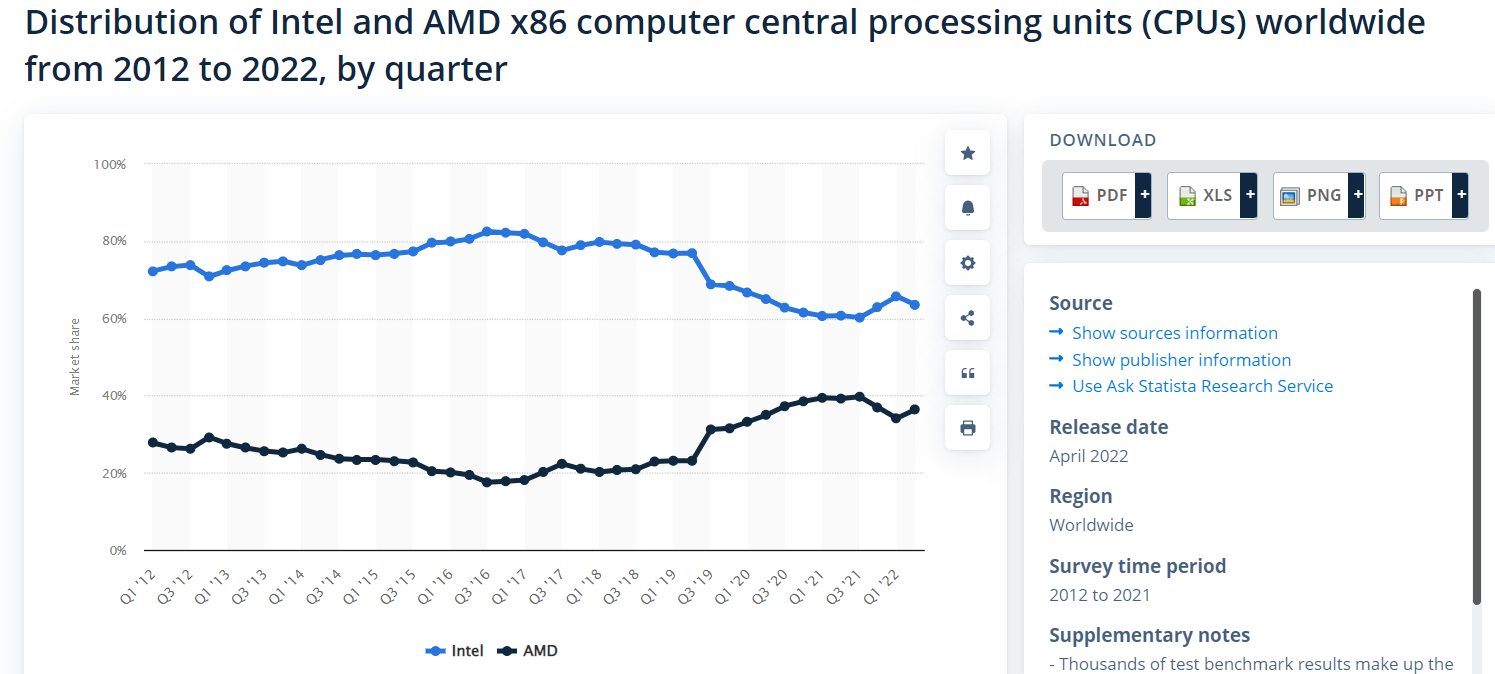
In fact, as early as 2016 it still had 83% market share. But thanks to the poor execution of its advanced chipset roadmap in recent years, AMD (AMD) has closed the gap rapidly, and today Intel has just 63.5% market share.
One of the widest parts of Intel’s wide moat was its fortress balance sheet and a mountain of low-cost capital. Building a new chip plant can cost $15 billion, and very few companies have that kind of money.
YCharts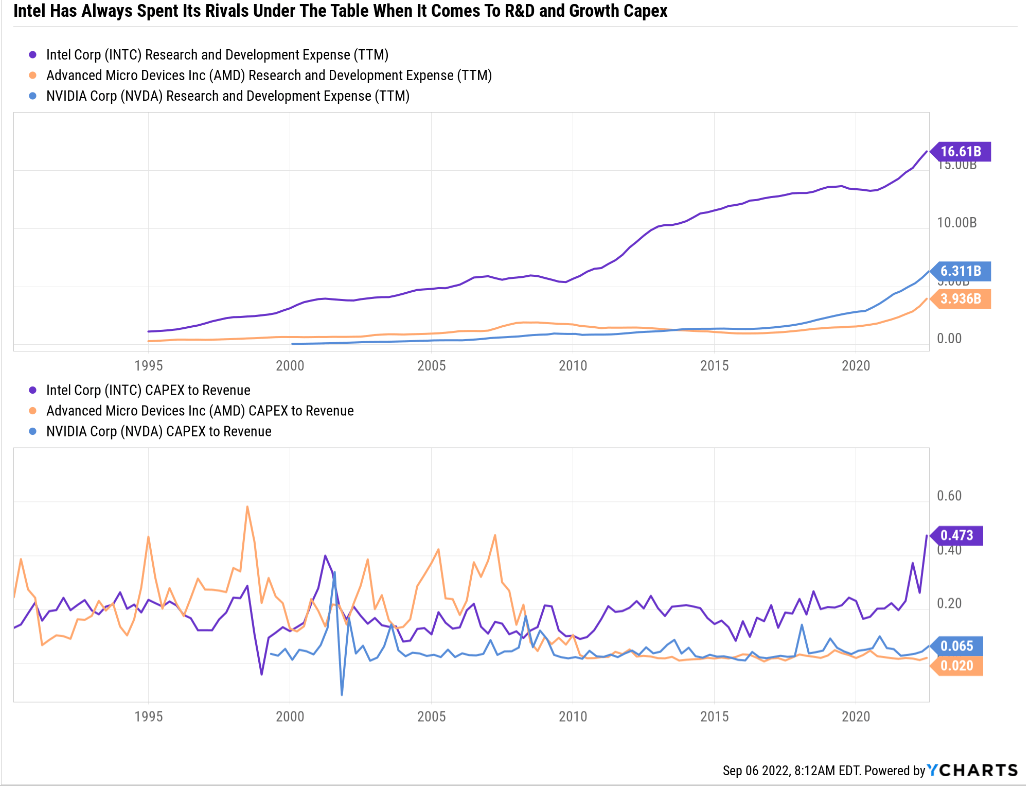
Even today Intel’s advantage in spending its rivals under the table remains intact. In the last 12 months, it spent almost $17 billion on R&D, and 47% of sales have been invested into growth capex, almost 10X more than AMD or NVIDIA (NVDA).
But just as IBM (IBM) is the world leader in patents, with over 100,000 of them and adding almost 9,000 more each year, R&D and growth capex spending alone don’t ensure a company’s market share can remain stable.
Statista
IBM’s massive spending on R&D and patents hasn’t helped it become a dominant leader in cloud computing or AI analytics, as management has been promising since 2014.
And Intel’s fortune in R&D, which nets it about 3,000 patents per year, hasn’t stopped upstart rivals from eating its lunch.
Intel Is Expected To Spend $102 Billion On Growth Capex In The Next 4 Years
FactSet Research Terminal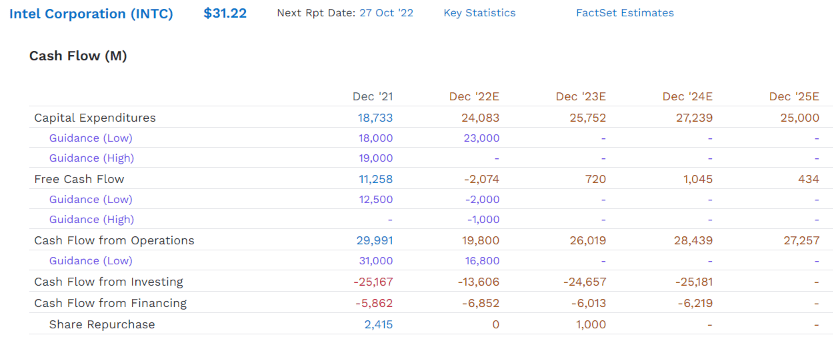
From 2022 through 2025, analysts expect, based on management guidance and publicly announced chip plant expansion plans, to spend $102 billion building new capacity.
Intel Is Expected To Keep Spending About $16.5 Billion Per Year On R&D
FactSet Research Terminal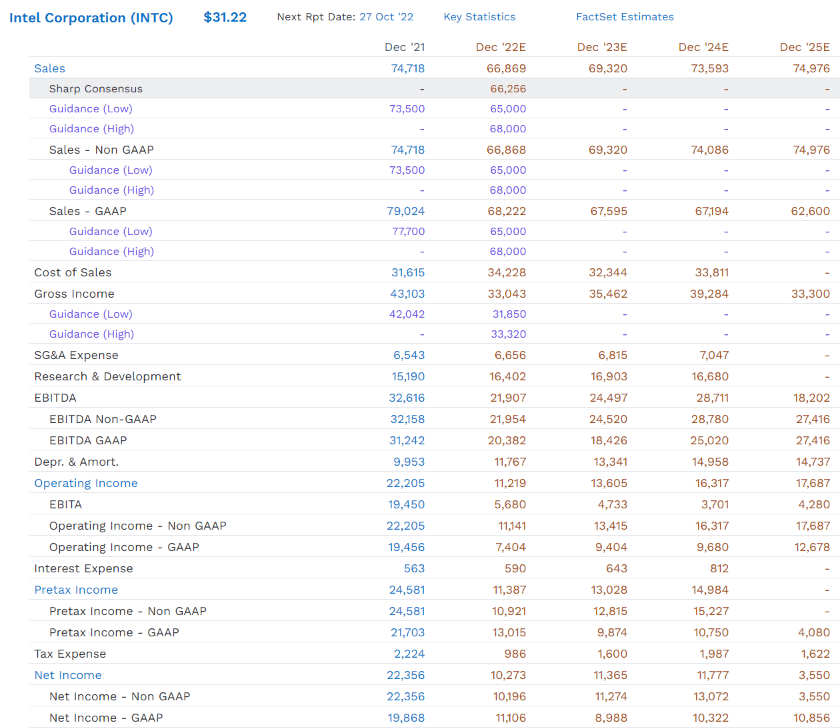
Intel is expected to keep spending $16.5 billion per year on R&D, or approximately $66 billion, from 2022 to 2025.
- $168 billion in growth spending from 2022 through 2025
If invested wisely, $168 billion in growth spending over four years could be a major boon to investors. After all, innovation is what made Intel a world-beater, and management is doubling down on innovation spending in a huge way.
In other words, to hear management tell it, INTC is going back to its roots, paring back buybacks, and planning to raise the dividend at token rates so that it can focus on a laser on innovation and world-beater tech.
But here are the two big problems I see with Intel’s “spend everyone under the table” plan for growth.
First, free cash flow will collapse, which is a concern for income growth investors.
- free cash flow is what’s left over after running the business and investing in future growth
- it’s what’s used for dividends and buybacks
- and the ultimate source of intrinsic value
How much free cash flow is Intel expected to generate from 2022 through 2025 as it attempts to regain chip tech dominance?
- $125 million
- not per year, but $125 million in total, over four years
Intel Dividend Consensus Forecast
| Year | Dividend Consensus | FCF/Share Consensus | FCF Payout Ratio | Retained (Post-Dividend) Free Cash Flow | Buyback Potential | Debt Repayment Potential |
| 2022 | $1.45 | -$1.12 | -129.5% | -$10,552 | -8.23% | -27.7% |
| 2023 | $1.49 | -$0.48 | -310.4% | -$8,089 | -6.31% | -23.9% |
| 2024 | $1.59 | $0.60 | 265.0% | -$4,065 | -3.17% | -12.0% |
| Total 2022 Through 2025 | $4.53 | -$1.00 | -453.0% | -$22,706.18 | -17.71% | -66.97% |
| Annualized Rate | 4.7% | NA | NA | NA | 37.9% | 37.9% |
(Source: FactSet Research Terminal)
From 2022 through 2024 alone, Intel is expected to payout $23 billion more in dividends than it generates in free cash flow.
In 2025 it’s expected to pay out $7 billion more in unsustainable dividends, not covered by free cash flow.
That’s about $30 billion in debt INTC is going to need to take on to keep the dividend growing at a modest rate to keep income investors happy. Fortunately, the company has $32 billion in liquidity right now, enough to cover the entire four years of dividend FCF shortfalls.
Intel Credit Ratings
| Rating Agency | Credit Rating | 30-Year Default/Bankruptcy Risk | Chance of Losing 100% Of Your Investment 1 In |
| S&P | A+ Negative Outlook | 0.60% | 166.7 |
| Fitch | A+ Negative Outlook | 0.60% | 166.7 |
| Moody’s | A1 Negative (A+ equivalent) | 0.60% | 166.7 |
| Consensus | A+ Negative Outlook | 0.60% | 166.7 |
(Source: S&P, Fitch, Moody’s)
But rating agencies have taken notice of Intel’s plans to spend over $30 billion on dividends while also spending almost $170 billion on growth and have downgraded it to A+ negative outlook.
- a 33% chance of a downgrade to A
- which would indicate a 0.66% 30-year default risk
Credit Default Swaps: The Bond Market’s Real-Time Fundamental Risk Assessment
(Source: FactSet Research Terminal)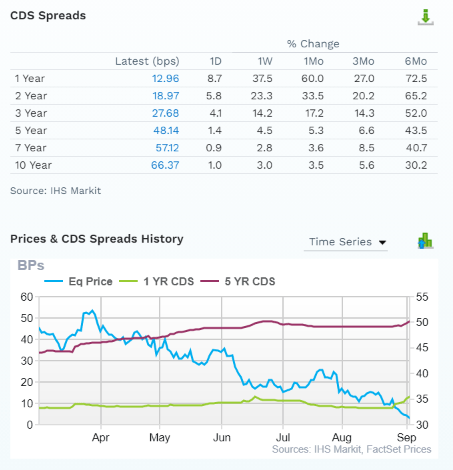
Bond investors, via the insurance policies they take out against potential default, which are traded daily in the open market, are pricing in a 1.9911% 30-year default risk, consistent with A- stable rated companies.
In the last six months, the five-year default risk has risen 44%, though it remains low on an absolute basis.
What does this mean? That INTC’s safe dividend thesis likely remains intact, even as it struggles to return to chip tech dominance.
Intel Leverage Consensus Forecast
| Year | Debt/EBITDA | Net Debt/EBITDA (1.5 Or Less Safe According To Credit Rating Agencies) |
Interest Coverage (8+ Safe) |
| 2021 | 1.17 | 0.30 | 39.44 |
| 2022 | 1.55 | 0.51 | 19.02 |
| 2023 | 1.38 | 0.62 | 21.16 |
| 2024 | 1.23 | 0.90 | 20.09 |
| 2025 | NA | 3.28 | NA |
| Annualized Change | 1.84% | 82.31% | -20.13% |
(Source: FactSet Research Terminal)
Rating agencies are warning Intel about taking on the $50 billion in net debt that analysts currently expect, which would increase its net leverage ratio by almost 11X by the end of 2025.
Intel Balance Sheet Consensus Forecast
| Year | Total Debt (Millions) | Cash | Net Debt (Millions) | Interest Cost (Millions) | EBITDA (Millions) | Operating Income (Millions) |
| 2021 | $38,101 | $4,827 | $9,688 | $563 | $32,616 | $22,205 |
| 2022 | $33,907 | $2,584 | $11,099 | $590 | $21,907 | $11,219 |
| 2023 | $33,907 | $5,679 | $15,169 | $643 | $24,497 | $13,605 |
| 2024 | $35,430 | $15,966 | $25,963 | $812 | $28,711 | $16,317 |
| 2025 | NA | NA | $59,732 | NA | $18,202 | $17,687 |
| Annualized Growth | -2.39% | 49.00% | 57.58% | 12.98% | -13.57% | -5.53% |
(Source: FactSet Research Terminal)
All that growth spending is expected to cause INTC to grow cash flows at a negative rate through 2025 and cause net debt to balloon from $10 billion last year to almost $60 billion within four years.
The good news? If Intel’s hyper-growth spending plan works, as soon as its growth spending falls, free cash flow will soar, the dividend will be sustainable, and Intel can focus on de-leveraging.
- through slower dividend growth and modest or no buybacks
The bad news? After considering INTC’s hyper-growth spending plans, here is what analysts think its long-term growth prospect are today.
(Source: FactSet Research Terminal)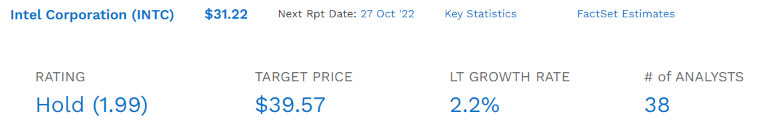
$168 billion in growth spending over four years (and possibly it will continue beyond 2025), and the median long-term growth consensus is just 2.2%?
- AT&T’s is 3.4%
- VZ’s is 2.0%
When analysts think you are going to grow slower than AT&T and basically match Verizon while spending more than 2X as much on growth, well, that’s a big red flag.
- Reuters’ consensus is 1.1% CAGR
- LT growth range is -16.8% CAGR to 17% CAGR from individual analysts
Are some analysts super bullish on INTC’s growth prospects? Sure, two think INTC can grow at 10+% in the future.
And the other 36 think Intel will barely be able to keep up with long-term inflation.
Guess what happens if you buy a 4.7% yielding blue-chip growing at 2.2% over time? You can expect long-term returns of approximately 6.9% CAGR.
- less than what analysts think AT&T will deliver in the future
- less than most defensive low-volatility sectors like healthcare, utilities, and consumer staples
Reason Two: Long-Term Returns Don’t Lie
Ben Graham called the market a weighing machine in the long-term, almost always correctly weighing the substance of a company. That means its moatiness, corporate culture, management, stability of cash flows, and risk profile. Over 30+ years, a company’s total returns are 97% likely to indicate whether or not it’s a quality company worth owning.
Intel Total Returns Since April 1985
(Source: Portfolio Visualizer Premium)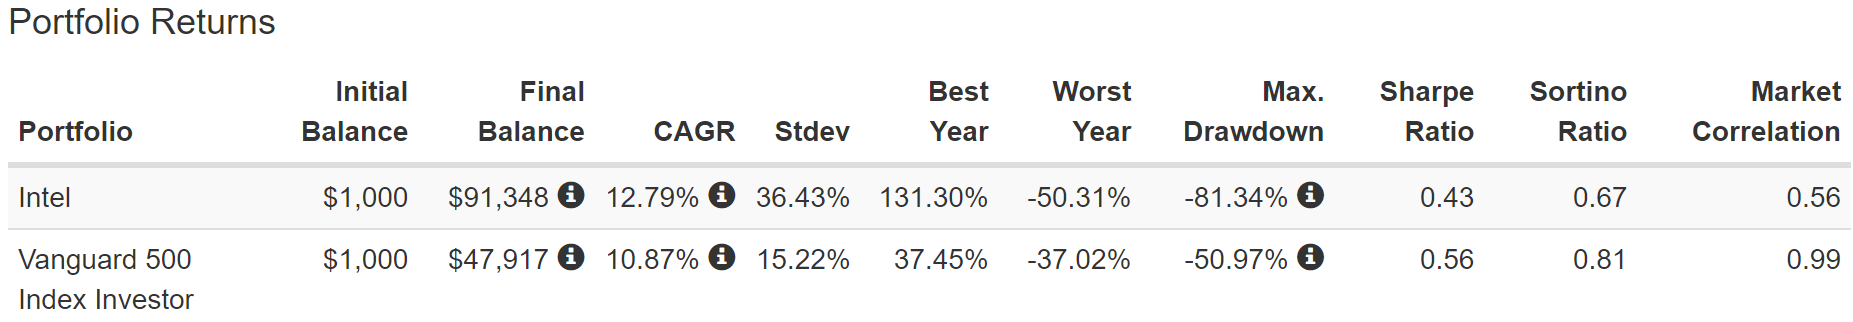
Over the last 37 years, INTC is a 91X bagger, delivering about 2% higher annual returns than the S&P 500. So not a value trap, right? The market has spoken and says Intel is a sound long-term investment. Not so fast.
(Source: Portfolio Visualizer Premium)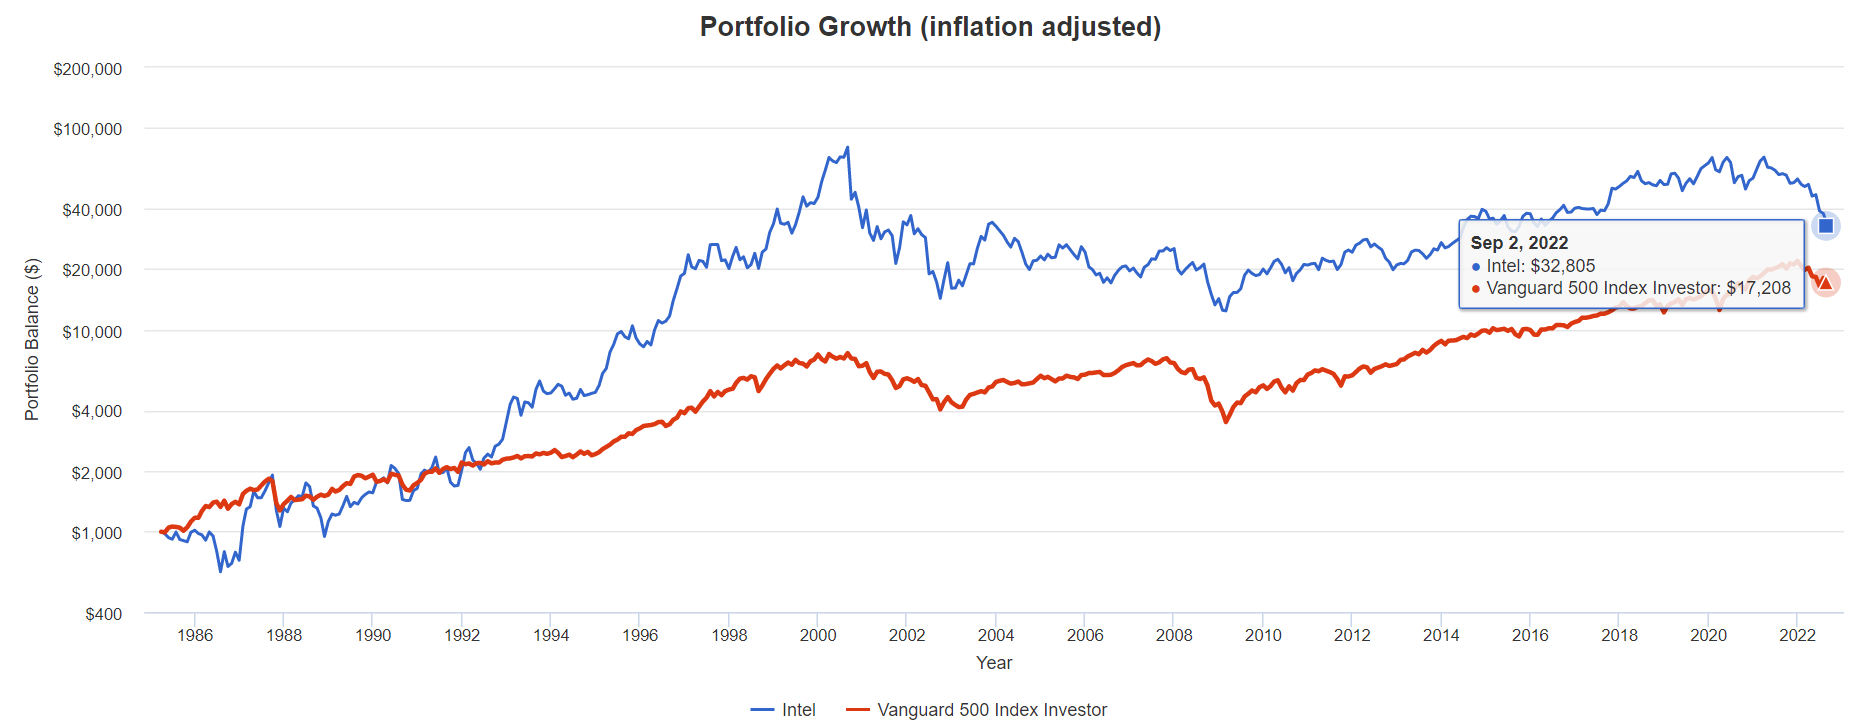
INTC has delivered 33X inflation-adjusted returns over the last 37 years, about 2X better than the S&P 500. But since the tech bubble popped?
Intel Returns Since April 1999
(Source: Portfolio Visualizer Premium)
Over 23 years, returns are 91% statistically significant, and Intel’s returns have significantly sucked. Did big tech suffer in the tech crash? Absolutely. But at least big tech like Cisco and the Nasdaq outperformed Intel by a significant amount.
How much? To answer that, let’s look at historical inflation-adjusted returns.
Inflation-Adjusted Returns Since April 1999
| Stock | Ticker | Inflation-Adjusted Return Since April 1999 |
Annual Real Return Since April 1999 |
| Intel | INTC | -2% | -0.1% |
| Cisco | CSCO | 26% | 1.0% |
| Nasdaq | QQQ, QQQM | 263% | 5.8% |
| S&P 500 | VOO | 157% | 4.2% |
(Source: Portfolio Visualizer Premium)
Intel has delivered slightly negative returns over the last 23 years when adjusted for inflation. Sure, that was the peak of the tech bubble, and the S&P and Nasdaq have hardly been shining lights of glorious returns. But at least they delivered real annual returns that are within the ballpark of historical norms.
Cisco was trading at 130X earnings at the height of the tech bubble but at least managed to outperform cash for the last 23 years, even if anyone buying any of these stocks in 1999 was just asking for terrible returns for the next decade or two.
Intel joins infamous value traps like AT&T and GE in the hall of fame for delivering zero or negative real returns for two decades.
OK, but 1999 is a bit of cherry-picking, isn’t it? We all know that the biggest bubble in US history is hardly a representative sample of whether or not a company is a good long-term investment.
That’s true, so let’s compare Intel against Cisco and SCHD, my two INTC alternatives, since November 2011, an 11-year period representing Cisco’s modern dividend era and INTC’s.
Intel Returns Since November 2011
(Source: Portfolio Visualizer Premium)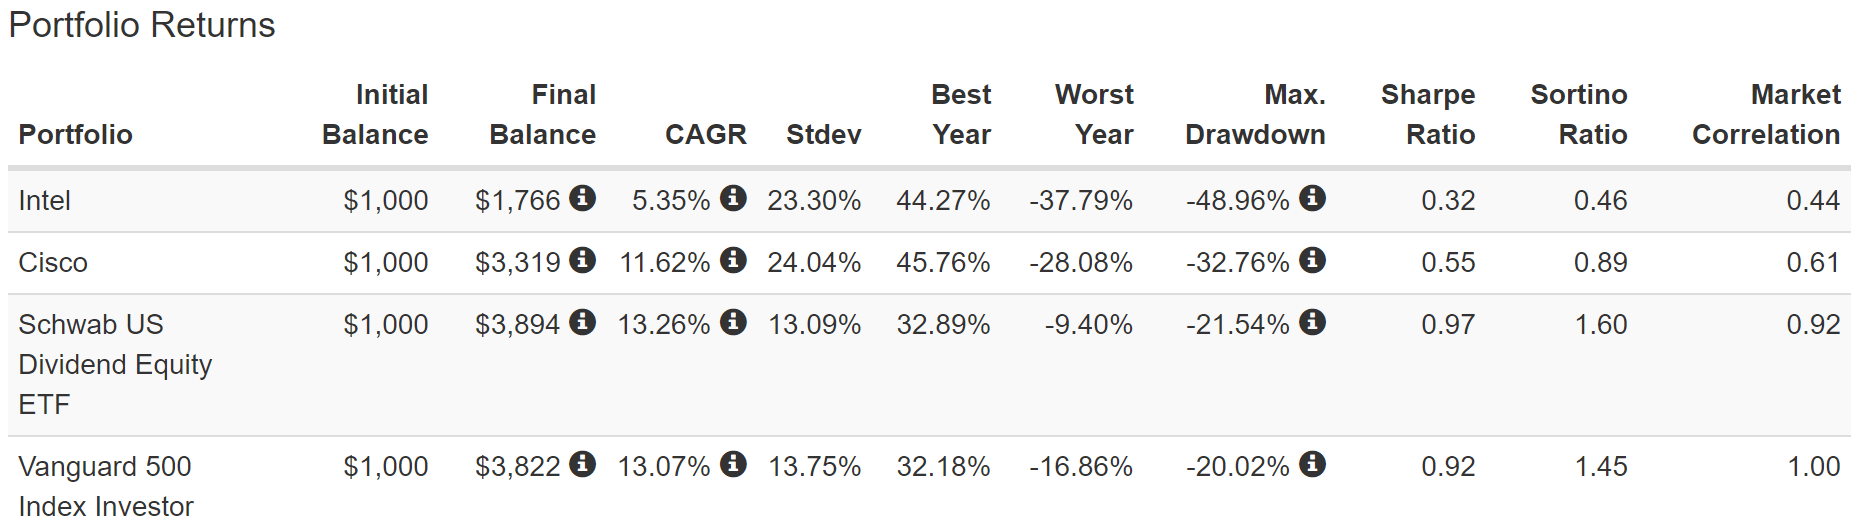
Intel has delivered rather anemic returns though positive ones, even when adjusted for inflation.
Inflation-Adjusted Returns Since November 2011
| Stock | Ticker | Inflation-Adjusted Return Since November 2011 |
Annual Real Return Since November 2011 |
| Intel | INTC | 35% | 2.8% |
| Cisco | CSCO | 154% | 8.8% |
| Schwab US Dividend Equity ETF | SCHD | 198% | 10.4% |
| S&P 500 | VOO | 192% | 10.2% |
(Source: Portfolio Visualizer Premium)
However, Cisco has delivered 3X the real returns of Intel, and SCHD is one of the few dividend growth ETFs that managed to keep up with the S&P 500.
Why Cisco Is Just A Better Company Than Intel
Why is Cisco thriving relative to INTC? Simple, it doesn’t rely as much on R&D or have to shell out $15 billion per chip factory to expand capacity.
It’s just a more capital-light, and wider moat business, and Cisco’s recurring revenue focus (now over 33% of total sales) means a steadier stream of cash flow and less cyclical free cash flow.
The more stable a company’s free cash is, the higher the multiple Wall Street tends to give it. Combined with steadier overall growth, that’s why Cisco has turned into a wonderful tech utility while INTC has languished in value trap hell.
Why SCHD Is A Far Superior High-Yield Investment Than INTC
You might think that it’s easy for dividend ETFs to deliver dependable annual dividend increases. Heck just own all dividend aristocrats and you are guaranteed to make more income every year right? Actually not.
Due to rebalancing, even NOBL, the aristocrat ETF, has somewhat variable annual dividends, though it does trend up and to the right over time.
SCHD is one of the most dependable annual income growers, and it also offers a very attractive 3.4% yield that’s superior to most high-yield ETFs.
And do you know the biggest reason that SCHD keeps outperforming every high-yield ETF I research?
- it’s based on an index that screens for quality, valuation, and safety
The Dow Jones U.S. Dividend 100 Index is designed to measure the performance of high-dividend-yielding stocks in the U.S. with a record of consistently paying dividends, selected for fundamental strength relative to their peers, based on financial ratios.” – S&P
SCHD simply has a superior method of selecting companies compared to other high-yield ETFs and that shows up in the results.
Packed To The Rafters With Ultra SWANs And World-Beater Dividend Growth Blue-Chips
(Source: Morningstar)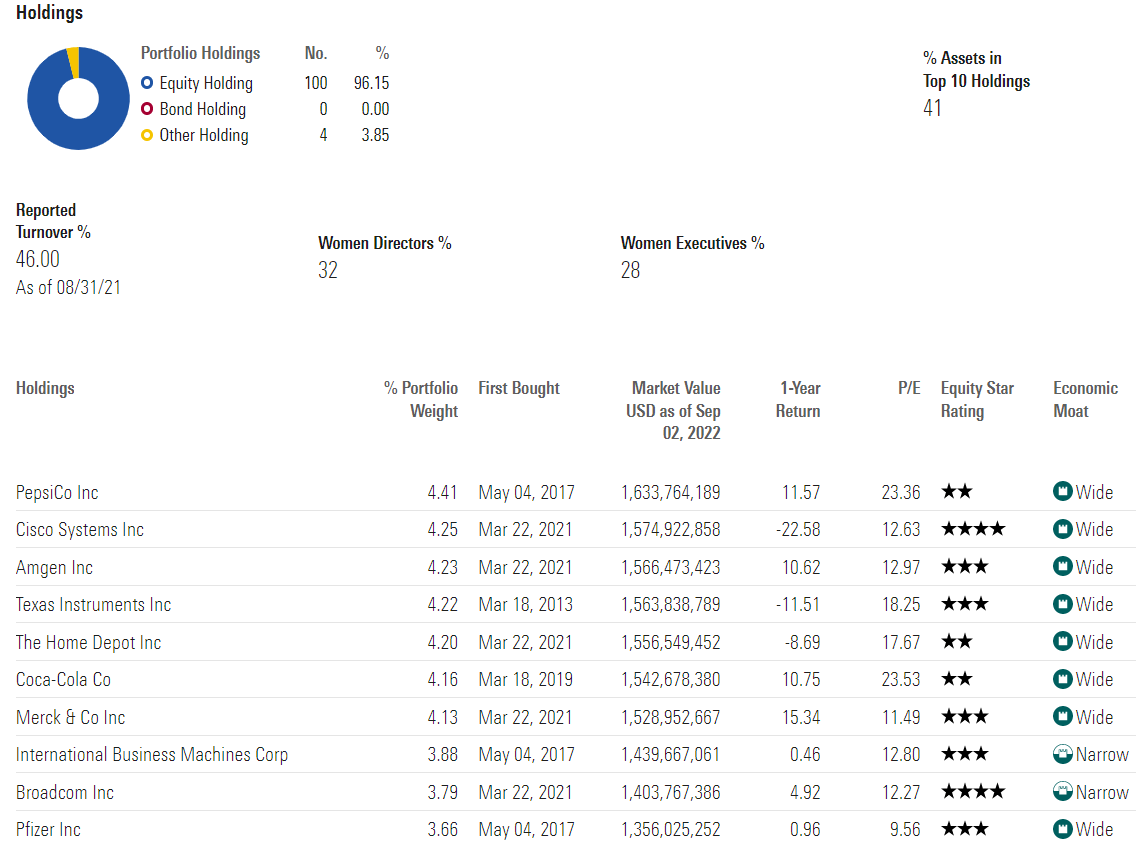
Just take a look at the top 10 names SCHD owns. With the exception of IBM, they are almost all world-beater blue-chips, Ultra SWANs (sleep well at night) companies, and lots of dividend aristocrats and kings (and future aristocrats and kings).
Another reason why SCHD is the king of high-yield ETFs?
(Source: Morningstar)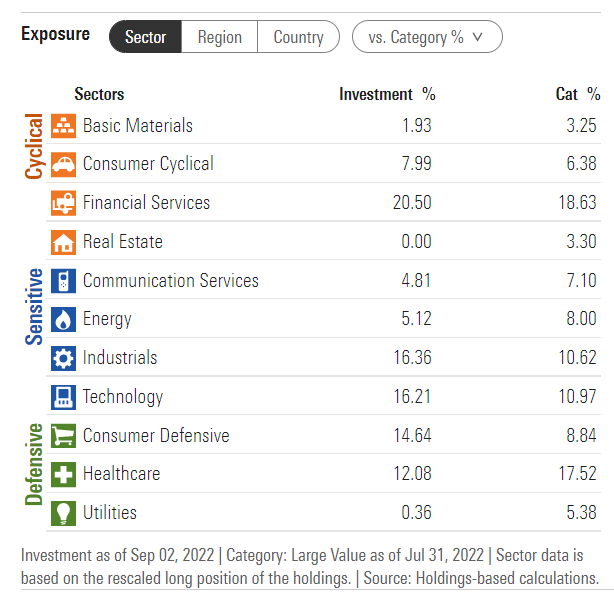
Compared to its high-yield ETF peers, SCHD has about 60% more tech exposure, and guess what you want to own if you care about future dividend growth and strong returns? Tech.
What is SCHD’s 2nd biggest holding? CSCO. Where does INTC show up in its rankings?
- SCHD doesn’t own Intel at all
- because it doesn’t pass its three-pronged safety, quality, and value screens
When the king of high-yield ETFs is over 4% invested in CSCO but won’t touch INTC at all? Well, that’s saying something, isn’t it.
Reason Three: Far Superior Likely Future Returns
OK, so we’ve seen how INTC has struggled in the past but isn’t INTC’s incredible valuation possibly a reason to buy it? The difference between quality deep value and a potential value trap is fundamentals.
Intel 2024 Consensus Total Return Potential
(Source: FAST Graphs, FactSet Research)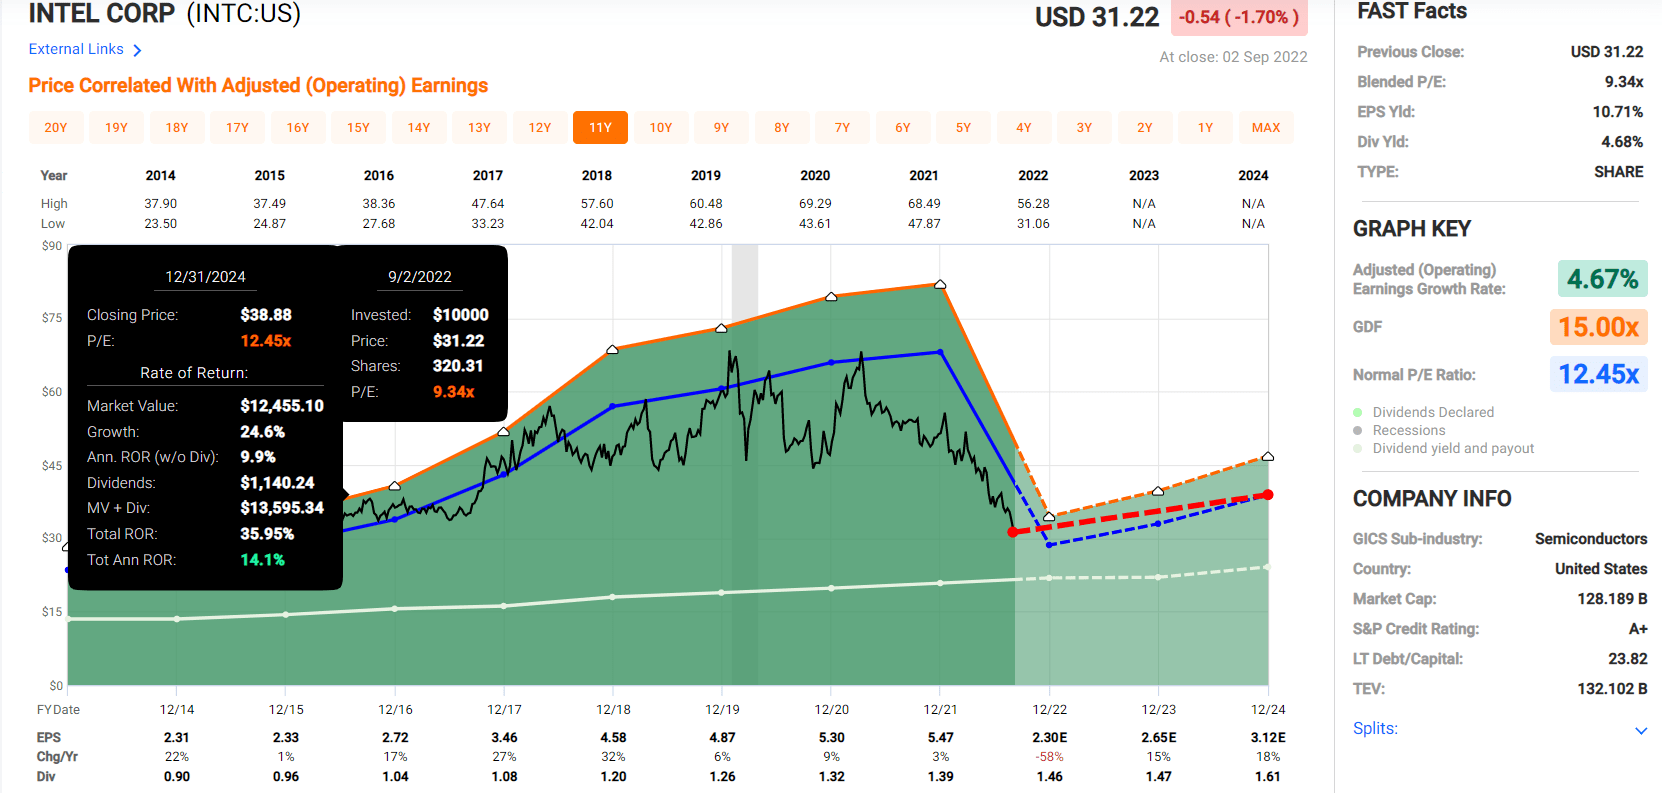
Look at INTC’s catastrophic 58% EPS decline in 2022. That’s due to having to spend so much trying to regain its tech advantage over its peers. Sure a strong recovery is currently expected in the coming years. And sure, INTC could outperform the S&P over the next few years.
S&P 500 2024 Consensus Total Return Potential
(Source: FAST Graphs, FactSet Research)
S&P 500 2027 Consensus Total Return Potential
| Year | Upside Potential By End of That Year | Consensus CAGR Return Potential By End of That Year | Probability-Weighted Return (Annualized) |
Inflation And Risk-Adjusted Expected Returns |
| 2027 | 53.67% | 8.97% | 6.73% | 4.28% |
(Source: DK S&P 500 Valuation & Total Return Tool)
But that assumes that INTC executes well (so far it hasn’t) and nothing else major goes wrong. Like a global recession that could cause 2023 and 2024’s strong EPS growth to evaporate.
INTC’s big collapse in recent months was justified by its fundamentals, which drive 97% of long-term returns.
And before you get too excited about the prospect of 14% annual short-term return potential, look at what kind of returns are possible over the next five years.
Intel 2027 Consensus Total Return Potential
(Source: FAST Graphs, FactSet Research)
Analysts now think INTC’s big growth rebound in 2023 and 2024 will be wiped out by renewed growth spending in 2025.
Might this forecast change? The best available data we have right now says INTC’s five-year return potential is much less than the S&P 500, CSCO, or SCHD.
Cisco 2024 Consensus Total Return Potential
(Source: FAST Graphs, FactSet Research)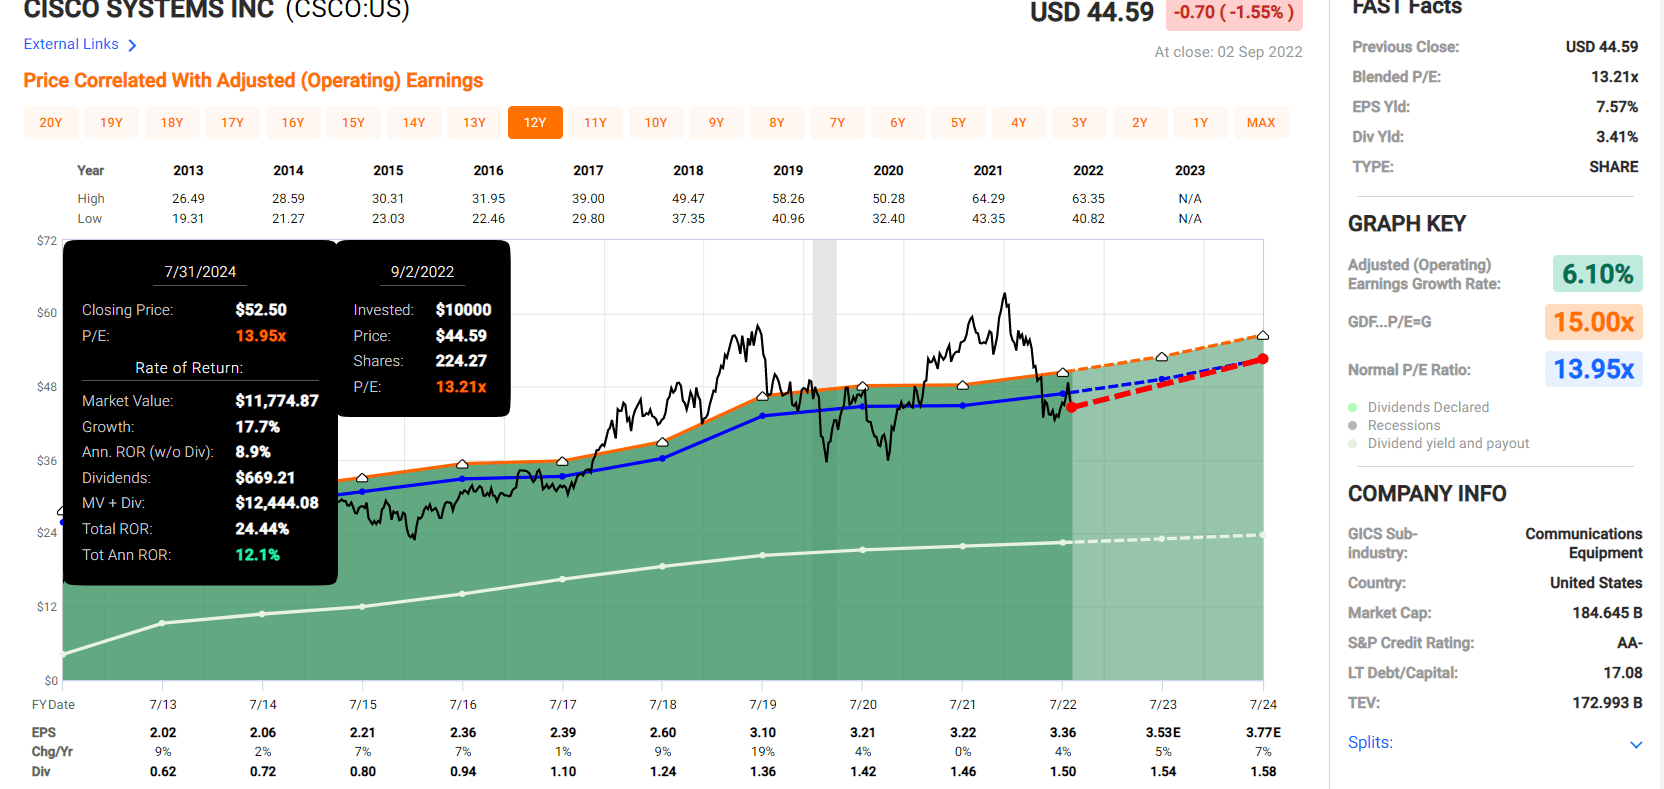
CSCO offers almost the same return potential through 2024 as does INTC. But far superior return potential over the next five years.
Cisco 2027 Consensus Total Return Potential
(Source: FAST Graphs, FactSet Research)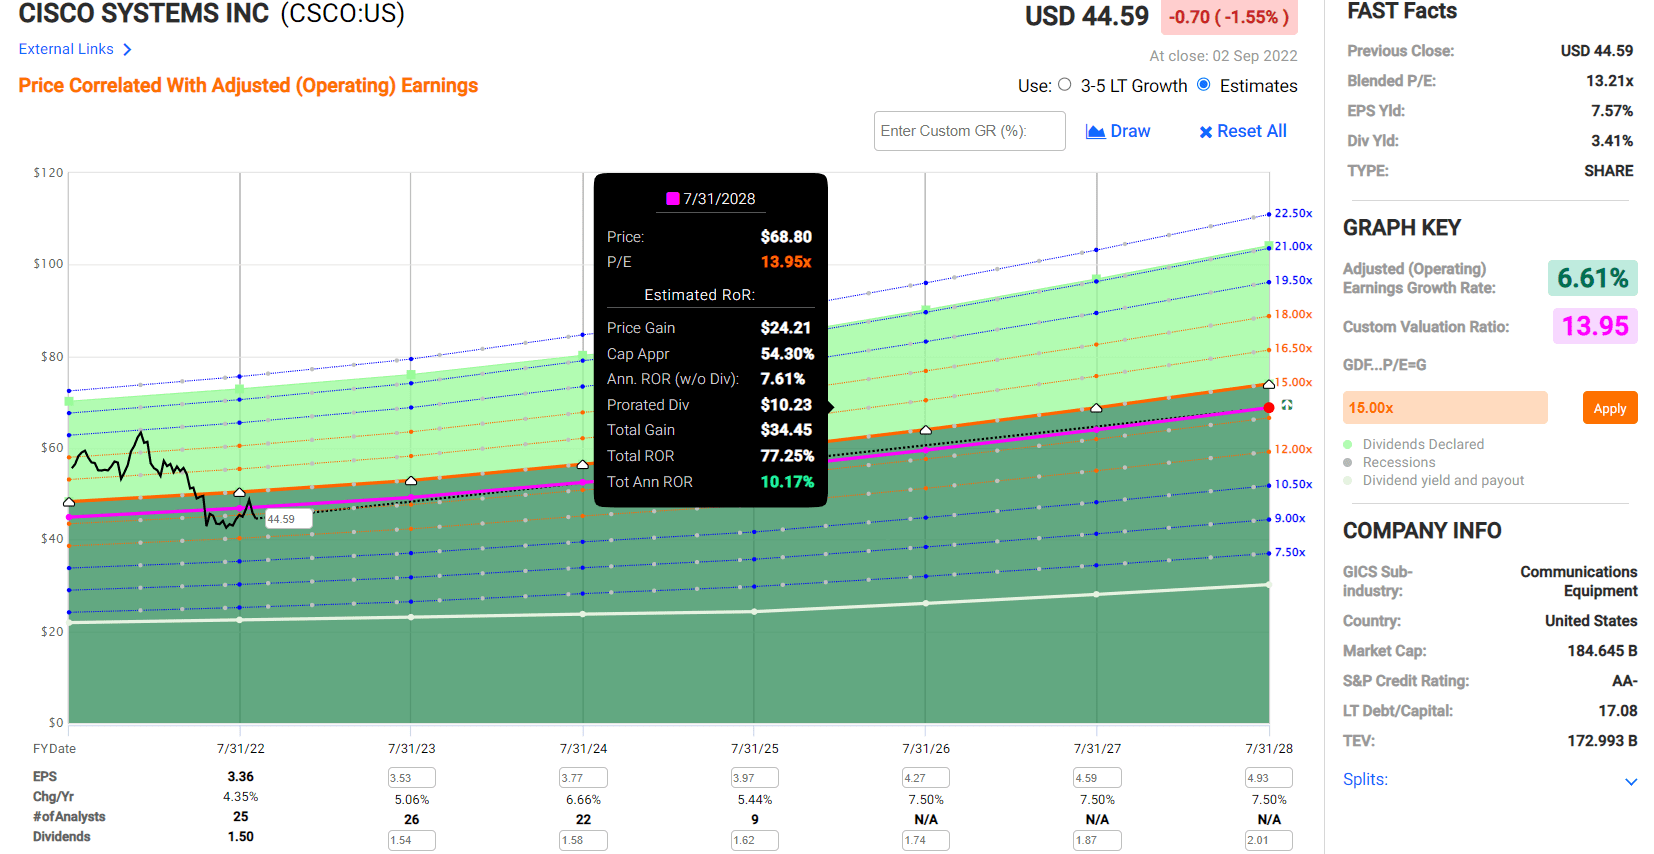
Currently, analysts expect CSCO to deliver potentially:
- 10% annual returns over the next five years
- 50% more than the S&P 500
- 4X more than INTC
What about the long-term future?
| Investment Strategy | Yield | LT Consensus Growth | LT Consensus Total Return Potential | Long-Term Risk-Adjusted Expected Return | Long-Term Inflation And Risk-Adjusted Expected Returns | Years To Double Your Inflation & Risk-Adjusted Wealth |
10-Year Inflation And Risk-Adjusted Expected Return |
| Intel | 4.7% | 2.2% | 6.9% | 4.8% | 2.6% | 27.6 | 1.29 |
| Cisco | 3.4% | 7.5% | 10.9% | 7.6% | 5.4% | 13.3 | 1.69 |
| SCHD | 3.4% | 8.7% | 12.1% | 8.5% | 6.3% | 11.5 | 1.83 |
| Dividend Aristocrats | 2.4% | 8.6% | 11.0% | 7.7% | 5.5% | 13.2 | 1.70 |
| S&P 500 | 1.7% | 8.5% | 10.2% | 7.1% | 4.9% | 14.6 | 1.62 |
(Source: DK Research Terminal, Morningstar, FactSet, YCharts)
According to analysts, there is no contest between CSCO and SCHD and Intel, which is expected to deliver long-term returns on par with a 60/40 portfolio, but with a lot more fundamental risk.
Bottom Line: Intel Is Likely A Value Trap And You Can Earn Far More Long-Term Income And Total Returns From Cisco And SCHD
Don’t get me wrong; I’m not saying you must sell Intel if you own it. I do and plan to rebalance it out of my portfolio when the bear market is over, barring a significant improvement in its fundamental outlook.
And for new money today? I have to recommend against buying Intel and here’s why.
Intel Investment Decision Score
DK (Source: Dividend Kings Automated Investment Decision Tool)

Is Intel a great investment today? Not really. Cisco might not be the best high-yield blue-chip you can buy, but it’s certainly a lot more reasonable and prudent than Intel.
Cisco Investment Decision Score
(Source: Dividend Kings Automated Investment Decision Tool)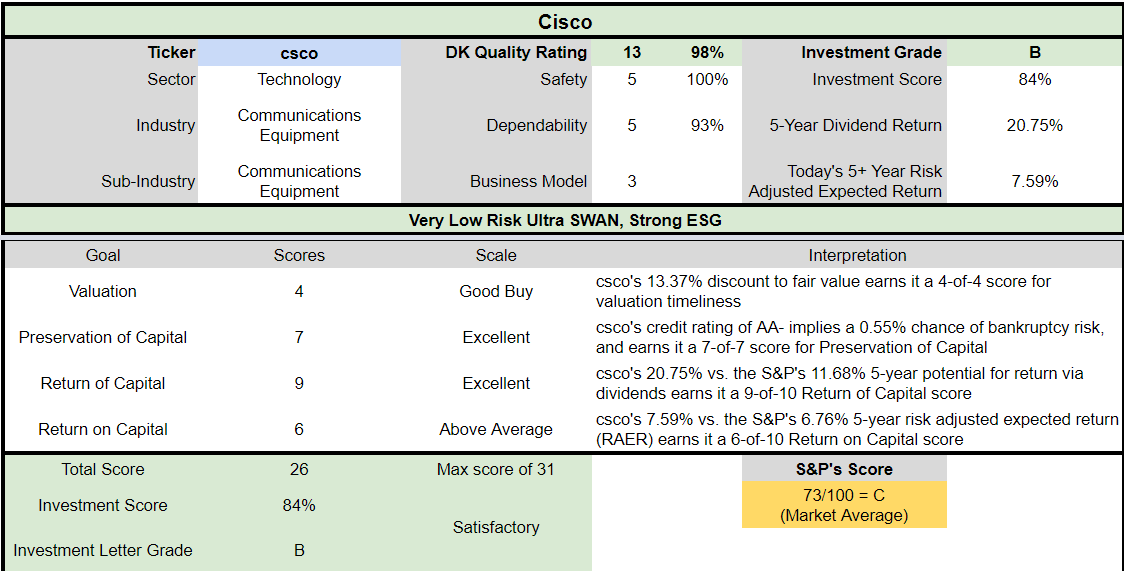
Other than valuation and a slightly higher yield, CSCO runs circles around Intel.
- much higher quality
- a stronger balance sheet (AA-stable Vs. A+ negative outlook)
- over 3X faster growth consensus
- historically 2X better annual returns over the last 11 years
And compared to SCHD, Intel pales in terms of future income growth potential as well as likely future and historical returns.
Not even Warren Buffett has infinite investable funds, so before you buy any company, ask yourself what are the alternatives?
If a 4.7% yield is what you want, dozens of quality companies yield more than that. In fact, if you want a very safe yield of at least 4.7% there are 21 blue-chips you can buy with far superior long-term return potential.
9 Higher-Yielding Superior Alternatives To Intel
Dividend Kings Zen Research Terminal
If an A-rated balance sheet is what you’re after? CSCO has an AA-stable rated one.
AA-Rated Blue-Chips Yielding More Than INTC Or CSCO
Dividend Kings Zen Research Terminal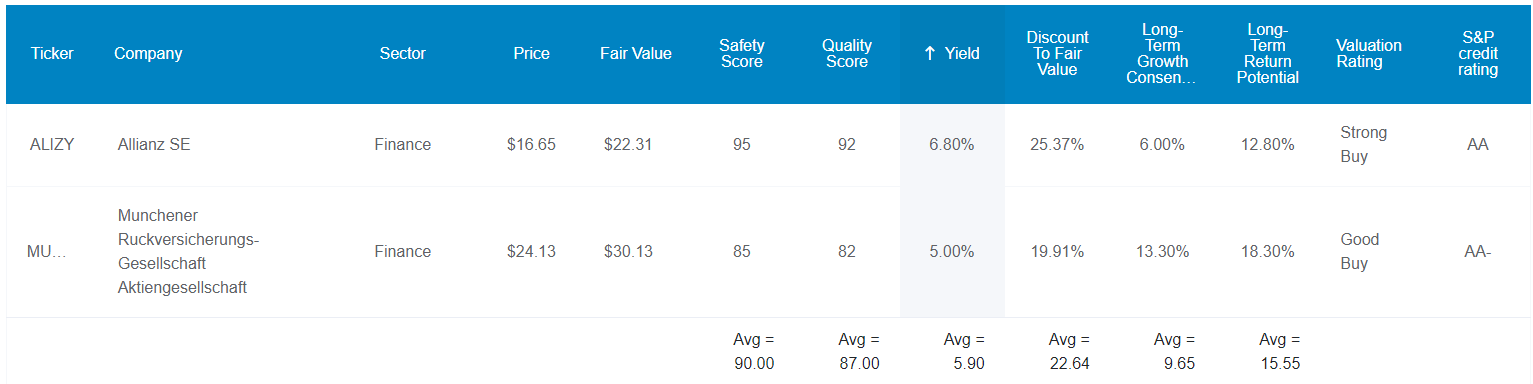
ALIZY and MURGY offer AA-rated yields higher than either Intel or Cisco’s.
Are you likely to lose money investing in Intel today? Or if you own it already? Probably not. Its fundamental risk is 0.6% according to rating agencies and about 1.9% according to bond investors.
But why buy a company whose short-term return potential is just modestly better than the market and whose long-term return potential might struggle to keep up with a 60/40 portfolio.
Why put new savings into a potential value trap whose recent plunge was almost entirely justified by fundamentals when CSCO and SCHD are both firing on all cylinders?
Why reach for yield when you can have both yield, superior quality, AND growth?
Be the first to comment