

Just_Super/E+ via Getty Images
Investment thesis
ForgeRock, Inc. (NYSE: NYSE:FORG) has a large cash burn and I don’t really detect a significant, unique competitive advantage. With these characteristics, I wouldn’t want to pay an EV/gross profit multiple of 9.63.
Table of contents
- Introducing ForgeRock and its industry
- Stock performance
- Competitive analysis
- Growth
- Margins
- Risks
- Valuation and Conclusion
Introducing ForgeRock
ForgeRock manages and secures the identities of consumers, workers, partners, and others through a digital identity platform.
They have an integrated set of comprehensive services to orchestrate and secure the user identity journeys across four fundamental areas:
• Identity Management. Automates the identity lifecycle process, including initial set-up, provisioning, transfers, changes, privacy considerations, security protections, and departures.
• Access Management. Provides simple and secure access management, using rich context and adaptive intelligence to make continuous access decisions.
• Identity Governance. Manages and reduces risk from users having excessive or unnecessary access to applications, systems, devices, and data.
• Autonomous Identity. Provides an enterprise-wide view of access, streamlines and automates governance processes, and reduces risk related to digital identities.
Market Opportunity
The worldwide Identity & Access Management market is being driven by increased digitalization and the introduction of advanced technologies. Furthermore, factors such as the rising need for security governance, enforcement challenges, distributed systems and personnel, and lower-quality security services inside enterprises, among others, are expected to propel the market even further.
According to a Research And Markets report, the identity and access management market is expected to expand at a 14.79 percent compound annual growth rate to reach US$31.898 billion by 2026.
Competitive analysis
ForgeRock is part of the identity and access management market. I selected several companies which have exposure to this market to create an industry proxy. Throughout this article, I will use this group in order to benchmark ForgeRock’s statistics.
Selection of companies with exposure to the identity and access management market:
|
Company name |
Symbol |
Market Cap |
|
Okta, Inc. |
(NASDAQ: OKTA) |
26.08B |
|
Ping Identity Holding Corp. |
(NYSE: PING) |
2.02B |
|
SailPoint Technologies Holdings, Inc. |
(NYSE: SAIL) |
4.64B |
As claimed in their latest annual statement, customers choose their services for multiple reasons. One of the reasons is its unified platform that built to work with enterprises’ complex landscape of applications and fulfill their identity needs across the prior mentioned four fundamental areas. Furthermore, they claim that its differentiated SaaS architecture facilitates strong customer data protection and high performance and that its capabilities around performance and scale, rich identity functionality, deployment flexibility, and extensive integration meet the specific requirements of global enterprises.
To see if users agree, I did some research online. On Gartner.com, ForgeRock scores a 4.5 out of 5 stars, with arguments that are line with the reasons mentioned in the annual statement. Competitor Okta scores a 4.6 and SailPoint scores a 4.3. On G2.com, the three firms score pretty similar too, around 4.5 out of 5 stars. In conclusion, there is not much a difference in ratings between the firms.
ForgeRock is a trusted brand in the industry, which I conclude by reviewing at its customers portfolio:
Customer Portfolio (Investor Presentation)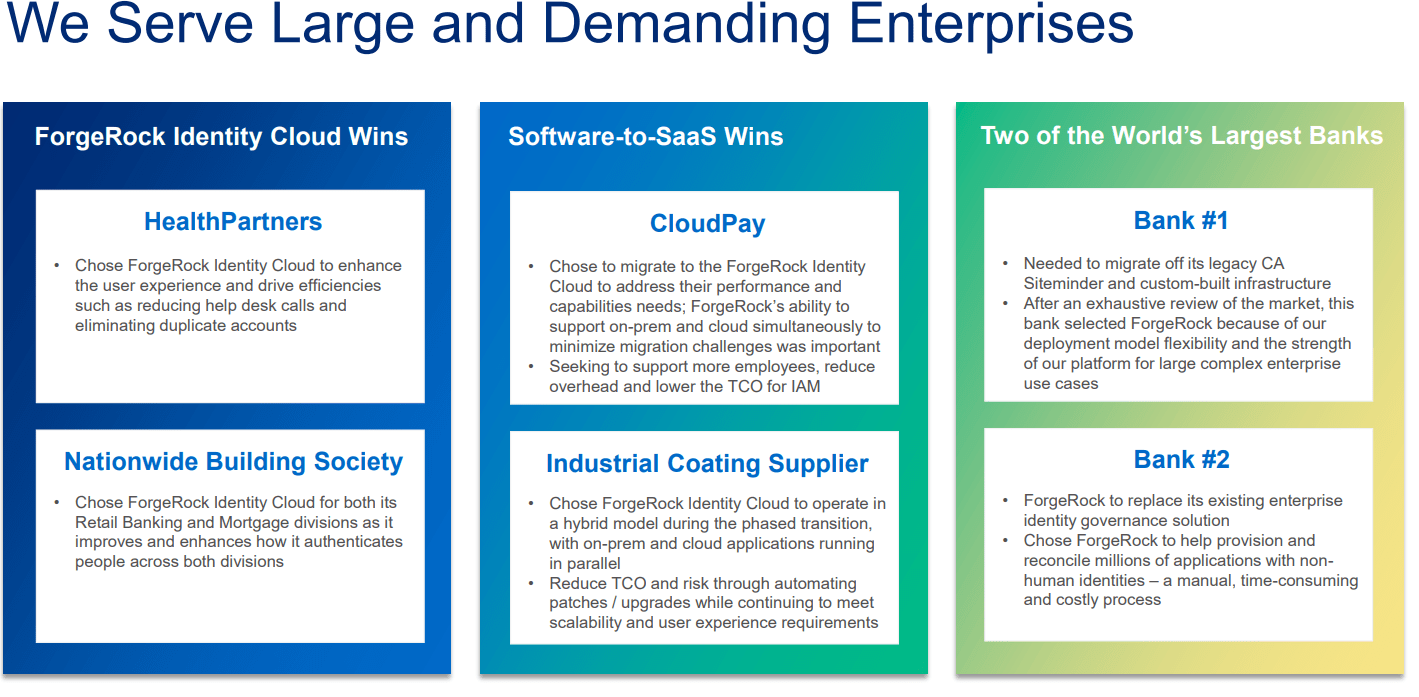
ForgeRock seems to have a robust customer portfolio and solid ratings, however it’s doesn’t have that special unique feature that differentiates it from the competitors.
Fundamental analysis
I split the fundamental analysis into two parts, (revenue) growth analysis and margin analysis.
ForgeRock recent growth
Growth performance of ForgeRock and its competitors in the last few years:
|
Stock |
Revenue Growth (Quarterly YoY) |
Revenue Growth (TTM YoY) |
Revenue Growth Rate (3Y) |
|
ForgeRock |
19.35 |
38.63 |
nan |
|
Okta, Inc. |
63.17 |
55.63 |
48.22 |
|
Ping Identity Holding Corp. |
19.23 |
22.93 |
14.11 |
|
SailPoint Technologies Holdings, Inc. |
31.21 |
20.18 |
20.81 |
|
Industry median |
31.21 |
22.93 |
20.81 |
Source: Seeking Alpha, income statement and earnings
The strong recent demand in the market has resulted in high growth for both ForgeRock and the other companies.
Future growth
ForgeRock launched its SaaS offering, ForgeRock Identity Cloud in 2020. This new service has been gaining great traction and ForgeRock expects it to keep booming in 2022 as new features will be added to the platform. Combined with a robust reputation in the business and interesting market opportunity, I believe the growth percentage to be a couple percentage points above the expected industry CAGR of 14.79%, so roughly 20%.
Growth estimates by analysts in percentage:
|
Stock |
Revenue 2022 |
Revenue 2023 |
Revenue 2024 |
Earnings 2022 |
Earnings 2023 |
Earnings 2024 |
|
ForgeRock |
20.9 |
26.0 |
nan |
59.6 |
69.4 |
nan |
|
Okta, Inc. |
nan |
37.6 |
33.7 |
nan |
-169.6 |
57.3 |
|
Ping Identity Holding Corp. |
11.7 |
18.7 |
nan |
-200.0 |
240.0 |
nan |
|
SailPoint Technologies Holdings, Inc. |
18.0 |
20.9 |
nan |
-350.0 |
92.0 |
nan |
|
Industry median |
14.85 |
20.9 |
33.7 |
-275.0 |
92.0 |
57.3 |
Source: Analyst estimates from Seeking Alpha
This is roughly in line with what the analysts expect, although they go for higher in 2023. I am a bit sceptic about such a high growth rate, since it’s more than 10% above the CAGR, while there are many other interesting players defending their market share.
Margins
I computed several key margins for ForgeRock and its industry. The first number in the cells in the following table refers to ForgeRock, while the number between the parentheses refers to the median of the industry.
Accounting item as % of revenue: ForgeRock(Median Industry):
|
Accounting Item |
2021 |
2020 |
2019 |
|
Gross Profit |
81.4 (73.8) |
83.3 (72.8) |
83.7 (77.1) |
|
Operating Expense |
97.5 (95.2) |
108.4 (82.9) |
119.1 (80.6) |
|
Normalized EBITDA |
-15.5 (-12.4) |
-24.5 (5.6) |
-34.0 (1.9) |
|
Free Cash Flow |
-21.4 (6.2) |
-23.9 (4.7) |
-46.4 (-1.9) |
|
Normalized Income |
-21.3 (-21.8) |
-30.3 (-4.9) |
-35.0 (-3.0) |
Source: Seeking Alpha income statement
ForgeRock has a higher gross margin than its peers, which may indicate that it has a competitive advantage. As the whole industry invests a lot due to it being an emerging industry, it’s not a surprise to see that ForgeRock has a negative EBITDA margin. However, with the current trend of improving EBITDA, it might see a positive EBITDA in 2024 or 2025.
Risk analysis
Before I get into the valuation of the stock, I will touch upon the risks of owning ForgeRock
Key risk measures:
|
Stock |
52W Beta, daily |
Market Correl |
Debt / Equity % |
Net Interest Coverage |
|
ForgeRock |
1.55 |
0.27 |
11.75 |
-1.55 |
|
Industry |
1.59 |
0.66 |
39.42 |
-26.72 |
Source: Yahoo Finance prices and Seeking Alpha
ForgeRock has a beta of 1.55, showing that it’s very sensitive to market movements. Correlation to the market is quite low, indicating a good additional diversification for a portfolio. As we saw before, the company is burning a lot of cash, as it has a free cash flow margin of around -20%. With a positive cash flow being a couple years away probably, this is quite concerning to see.
Another risk in my eyes, is that the company doesn’t seem to be so unique or differentiated, as other competitors offer the same type of services, with the same ratings or even higher.
Valuation
I have computed several key current valuation metrics.
Key valuation measures:
|
Stock |
Enterprise Value / Revenue |
Enterprise Value / EBITDA |
Enterprise Value / Gross Profit |
Forward PS |
Forward PE |
|
ForgeRock |
7.84 |
-33.57 |
9.63 |
6.3 |
-188.64 |
|
Okta, Inc. |
19.69 |
-39.40 |
28.33 |
10.91 |
-266.13 |
|
Ping Identity Holding Corp. |
7.05 |
-58.77 |
10.32 |
5.09 |
185.25 |
|
SailPoint Technologies Holdings, Inc. |
10.53 |
-127.01 |
14.25 |
7.41 |
-2427.75 |
|
Industry median |
10.53 |
-58.77 |
14.25 |
7.41 |
-266.13 |
Source: Seeking Alpha
ForgeRock is cheaper than all of its peers, which I believe can be attributed to the some of its the risks of ForgeRock, such as the high cash burn. As ForgeRock has higher expected growth rates, I would have expected it to be priced a bit closer to its peers prices.
However, this doesn’t mean that I think it’s a buy. The company has a robust customer portfolio and a good reputation on review websites. It’s SaaS platform has a lot of momentum. In spite of that, the company has a large cash burn and I don’t really detect a significant, unique competitive advantage. With these characteristics, I wouldn’t want to pay an EV/gross profit multiple of 9.63. I have analyzed stocks with better prospects with the same valuation or cheaper.
In conclusion, I am not buying this stock right now. I’d either wait for the stock to decrease in price, or for the EBITDA margin to get closer to 0, which I expect will take a while.
Be the first to comment