

enot-poloskun
Introduction to the Positive/Negative Forensic Value Stock Selections
This quantitative study continues a series of multi-year test now using the top four forensic algorithms applied to detect bankruptcy risk, earnings manipulation, and financial irregularities. This forward testing study makes portfolio selections from the highest positive and highest negative scoring stocks across the U.S. stock exchanges to measure performance variances between portfolios and benchmark indexes.
The different algorithms created by Beneish, Ohlson, and Altman are well documented from financial literature and rely exclusively on fundamental data including year over year operational performance measures. The combination of all three bankruptcy and financial irregularity algorithms creates a unique “deep dive” on key value characteristics and applies a total of 22 different fundamental financial variables for assessment. The newest addition of the Montier C-Score began in August 2020 and now increases the total combination of accounting variables to 28 across all four algorithms.
Frequently Asked Questions
1. Why would the negative forensic stocks perform well if they are the top outliers for negative forensic characteristics?
Enron was a top negative forensic stock that rapidly gained over 600% in a few years before whistleblowers finally revealed the financial irregularities that eventually led to bankruptcy. Extreme forensic outliers can be products of incredible positive growth conditions or financial irregularities that have not been addressed. In either case the stock price has proven to benefit greatly over significant periods of time.
bigcharts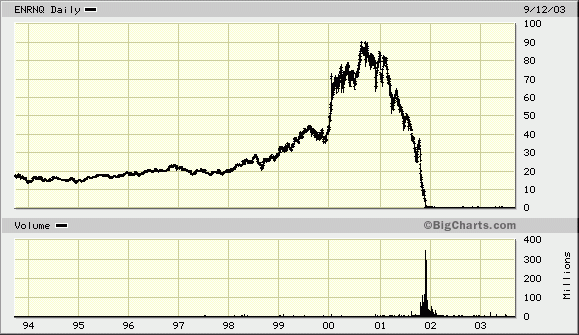
2. Why would the positive forensic stocks perform well with outliers in positive conditions across all the forensic characteristics?
Stocks with extremely favorable forensic scores are likely to have excellent operations, strong stable financial ratios, solid fundamental valuations and attract premium pricing from investors.
Examples of Forensic Algorithm applications
Prior examples of the application of these forensic financial algorithms can be found in my published articles and interviews:
Prior articles and published references detail the composition and methods of each of the forensic algorithms used in this article. For simplicity, here is a summary of what each of the forensic algorithms used by fraud examiners and investigators scan for at high levels:
- The Beneish model uses eight variables to detect earnings manipulation. Created by Professor Messod Beneish, an M-Score greater than -2.22 signals that the company is likely to be a manipulator.
- The Altman model is used to predict whether a firm is likely to go into bankruptcy within 2 years and uses many variables from the income and balance sheets for this analysis. Distress is considered high with a value below 1.81.
- The Ohlson model also predicts bankruptcy risk using a multi-factor financial algorithm developed by Dr. James Ohlson in 1980. Any percentage values above 50% indicate the risk of a firm’s bankruptcy within 2 years.
- Lastly, James Montier developed a C-Score that creates a simple scoring system to highlight firms that may be “cooking the books” with values above 4 being at risk firms.
The firms listed below for negative scoring all qualified in the high adverse levels for each of the forensic models described above. The positive scoring stock selections have the lowest or most favorable combined values of the forensic scores across the US exchanges.
Prior Negative Forensic Returns
2022 has delivered the worst half-year start to the stock market since 1970 and the worst start of the year returns for the Nasdaq in history. These terrible market results going back 52 years and longer have pared much of the strong initial gains in the prior portfolios and the best approach is to follow the Momentum Gauges® to avoid record downturns like members have.
FinViz.com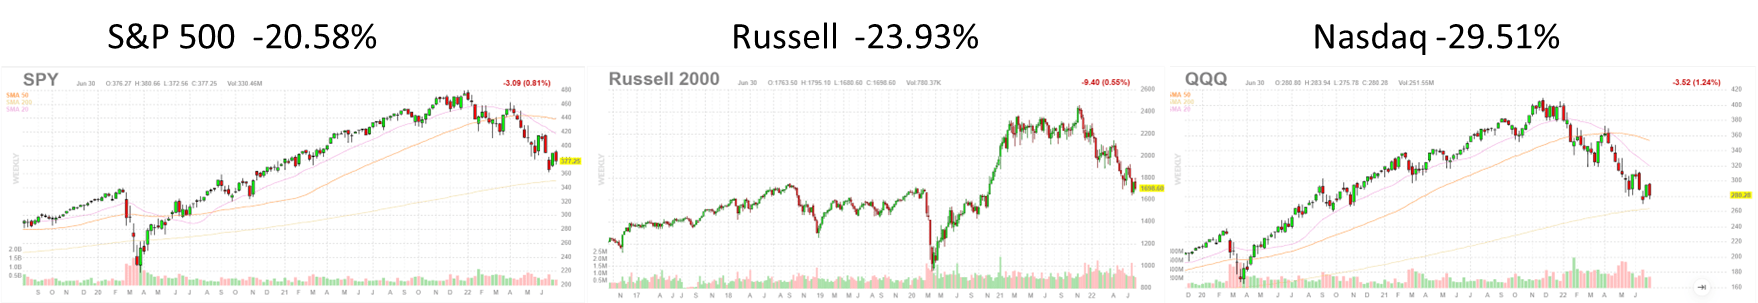
The long term buy/hold Negative Forensic portfolios are down -6.99% YTD into 2022 with the 2-year weighted average return greatly reduced to +0.10%. These returns do not include any of the dividend returns typical of many large value stocks and the total returns for these portfolios will be higher than shown below.
Returns to July 2022
VMBreakouts.com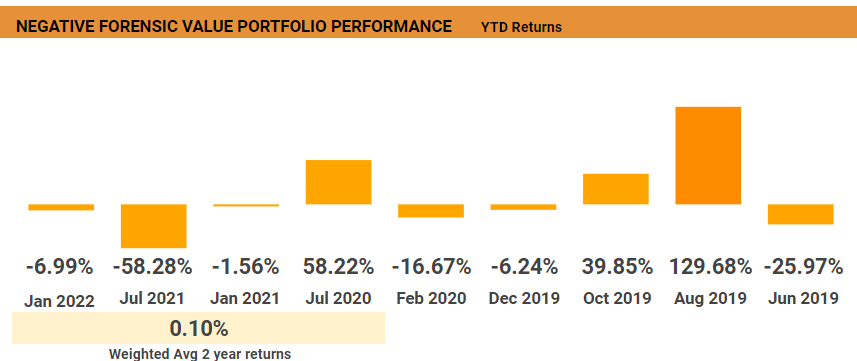
Exactly 1 year ago in the July 2021 selections the returns were substantially higher. This suggests the Negative Forensic portfolios are highly correlated with the record market selloff with few portfolios like the July 2020 portfolio able to hold strong through these conditions.
Returns to July 2021
VMBreakouts.com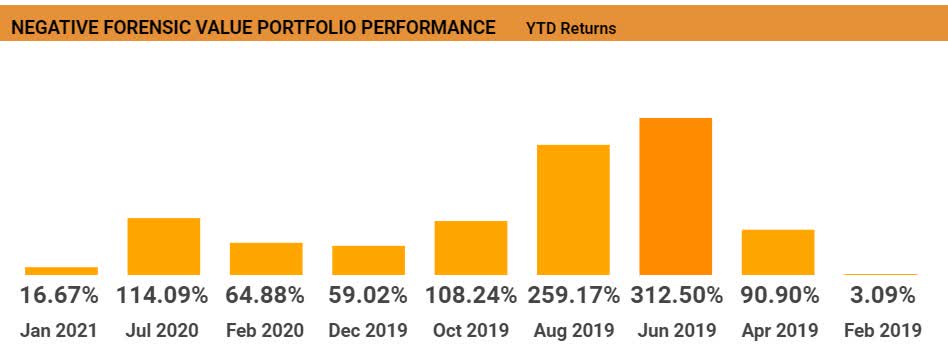
Despite the worst stock market returns since 1970, the January 2022 portfolio is still outperforming the S&P 500 by +13.59% and the Nasdaq by +22.52% in six months. This continues five consecutive years of the forensic models beating the S&P 500.
Top 10 performing prior negative forensic stocks since 2019:
| Symbol | Company | Price | Return from Selection |
| (PLUG) | Plug Power Inc. | 17.18 | 699.07% |
| (TXMD) | TherapeuticsMD Inc. | 9.96 | 369.81% |
| (INSE) | Inspired Entertainment Inc. | 8.58 | 208.63% |
| (TGH) | Textainer Group Holdings Limited | 27.34 | 188.70% |
| TXMD | TherapeuticsMD Inc. | 9.96 | 182.95% |
| (PLAY) | Dave & Buster’s Entertainment Inc. | 33.71 | 164.60% |
| (FHN) | First Horizon Corp. | 21.8 | 135.68% |
| (TROX) | Tronox Holdings PLC | 16.66 | 101.69% |
| (IBN) | ICICI Bank Ltd. | 17.94 | 86.29% |
| (XOMA) | XOMA Corp. | 20.84 | 74.39% |
Out of more than 8,000 stocks screened for July 2022 there were only 35 highly adverse scoring stocks with red flags across each of the four forensic algorithms. The size of this group is up from the start of the year with 21 stocks and down from a year ago in July 2021 when there were 41 stocks. Last January 2021 there were 187 qualifying negative forensic stocks. Current levels are still much more elevated than in many prior selections with: 11 adverse stocks in February 2020, 6 stocks in December 2019, 7 stocks in October 2019 and 9 stocks in August 2019. This may be another metric of caution for the markets.
It is very likely the impact of the global pandemic caused the significant increase in highly negative forensic scoring stocks between July of 2020 to January 2021. The number of negative scoring stocks is dropping off again toward pre-pandemic levels with fewer extremely adverse stocks. The top 10 highest negative results for July are sorted along the Ohlson O-score probability percentage in descending order.
Top 10 Negative Forensic stocks for July 2022
UncleStock.com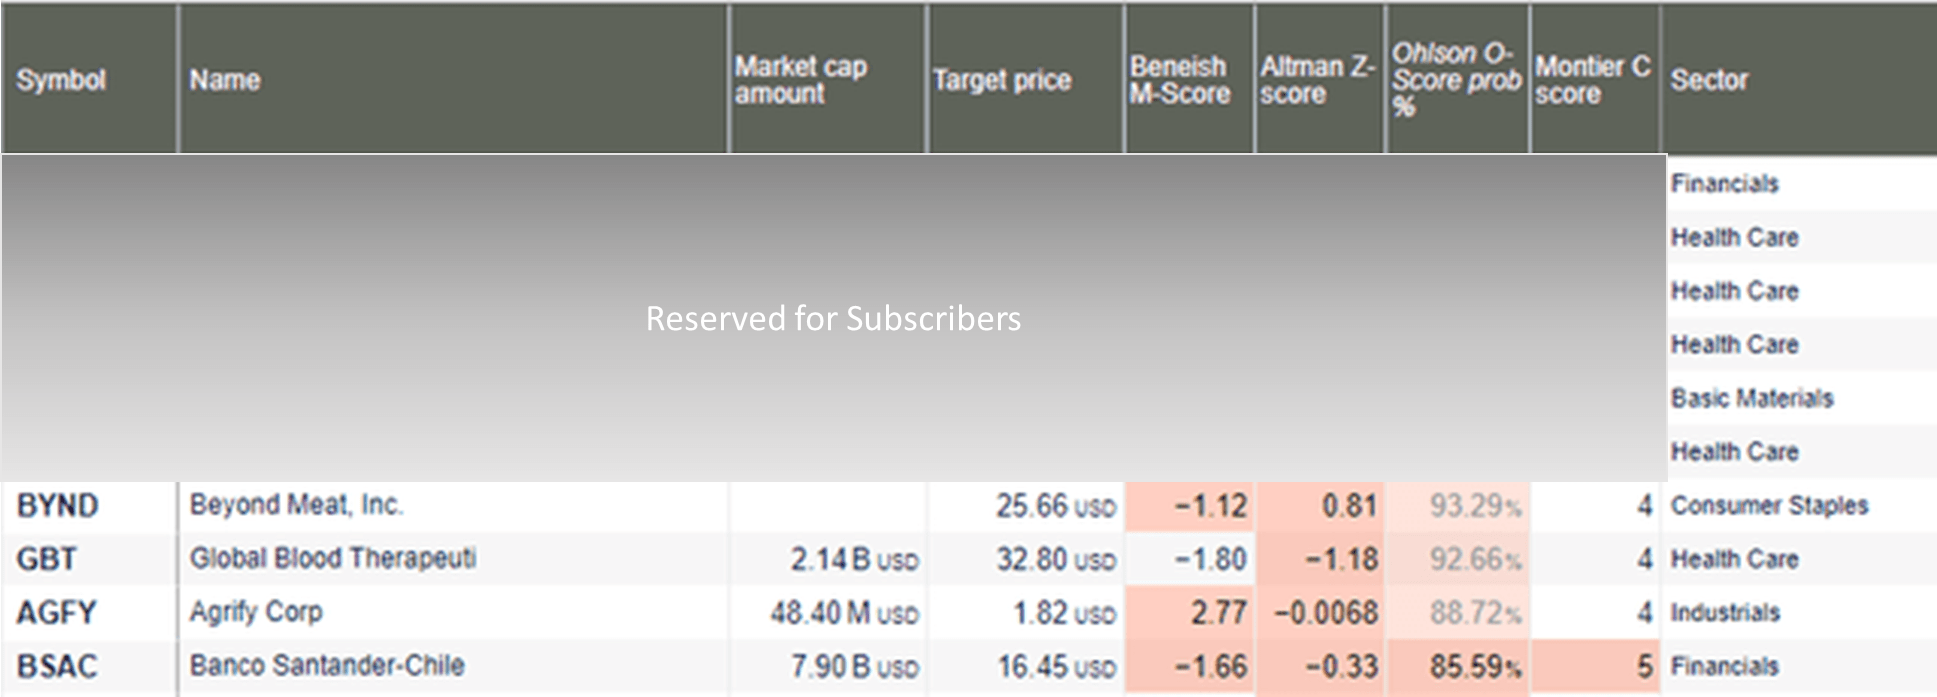
See my 3-chart video below including discussion on Beyond Meat (BYND) set for strong breakout.
Overall Scores Independent of the Negative Forensic Selections
An independent ranking of these firms using other value and growth scores is shown below that may provide additional insight into the risk of these firms.
StockRover.com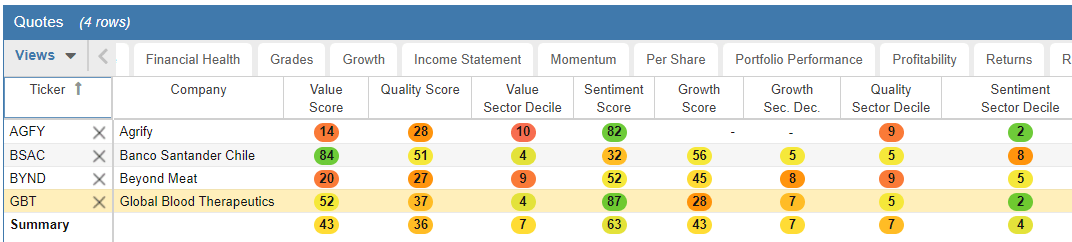
Morningstar Financial Health Grade
StockRover.com
These highly negative forensic stocks seem unlikely to perform well based on fundamental analysis and the red flags of four different forensic algorithms. However, as we can see from several years of past performance, the results have produced above average market performance even beating the major benchmarks the last 5 years.
Agrify Corporation (AGFY)
FinViz.com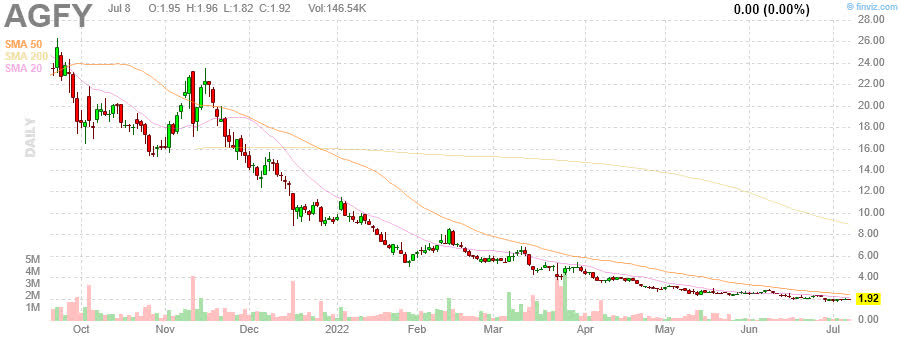
Agrify Corporation develops precision hardware and software cultivation and extraction solutions for the cannabis and hemp industry in the United States. The company offers vertical farming units and Agrify Insights Software-as-a-Service software; integrated grow racks and LED grow lights; and non-proprietary products designed, engineered, and manufactured by third parties, such as air cleaning systems and pesticide-free surface pro
Source: Company Resources
Banco Santander-Chile (BSAC)
FinViz.com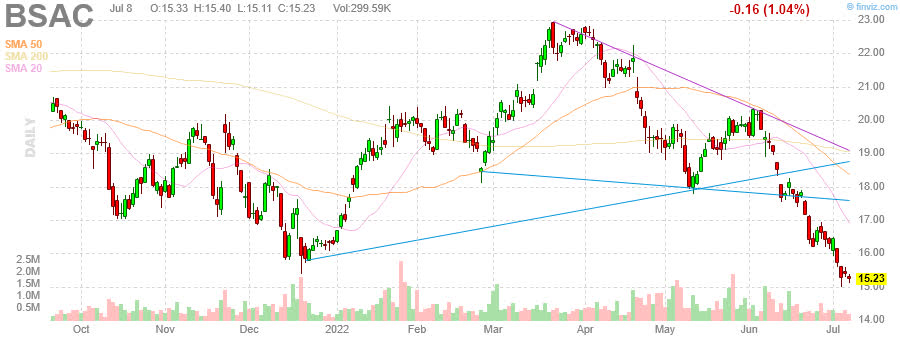
Banco Santander-Chile, together with its subsidiaries, provides commercial and retail banking products and services in Chile. It operates through Retail Banking, Middle-Market, Corporate Investment Banking, and Corporate Activities segments. The company offers debit and credit cards, checking accounts, and savings products; consumer, automobile, commercial, mortgage, and government-guaranteed loans; and Chilean peso and foreign currency denominated loans to finance various commercial transactions, trade, foreign currency forward contracts, and credit lines, as well as mortgage financing services.
Source: Company Resources
Beyond Meat, Inc. (BYND)
FinViz.com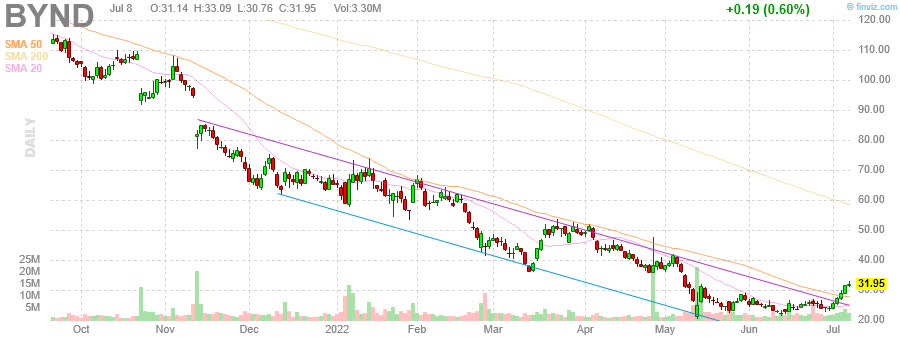
Beyond Meat, Inc. manufactures, markets, and sells plant-based meat products in the United States and internationally. The company sells a range of plant-based meat products across the platforms of beef, pork, and poultry. It sells its products through grocery, mass merchandiser, club store, convenience store and natural retailer channels, and direct-to-consumer, as well as various food-away-from-home channels, including restaurants, foodservice outlets, and schools.
Source: Company Resources
Global Blood Therapeutics (GBT)
FinViz.com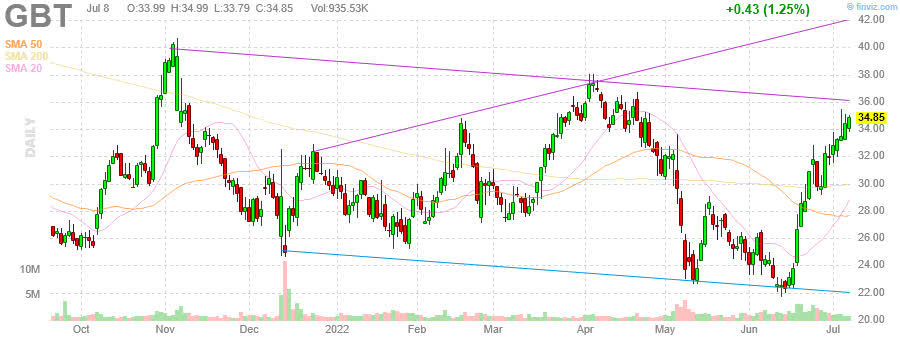
Global Blood Therapeutics, Inc., a biopharmaceutical company, engages in the discovery, development, and delivery of treatments for underserved patient communities with sickle cell disease. The company offers Oxbryta tablets, an oral, once-daily therapy for SCD. It also evaluates the safety and pharmacokinetics of single and multiple doses of Oxbryta in a Phase II clinical trial of adolescent and pediatric patients with SCD.
Source: Company Resources
Prior Positive Forensic Returns
These positive portfolios are tracked for long term returns. Because at least two of the forensic algorithms in the published financial research used 2-year models we will also follow at least 2 years of returns from these portfolios as shown below:
VMBreakouts.com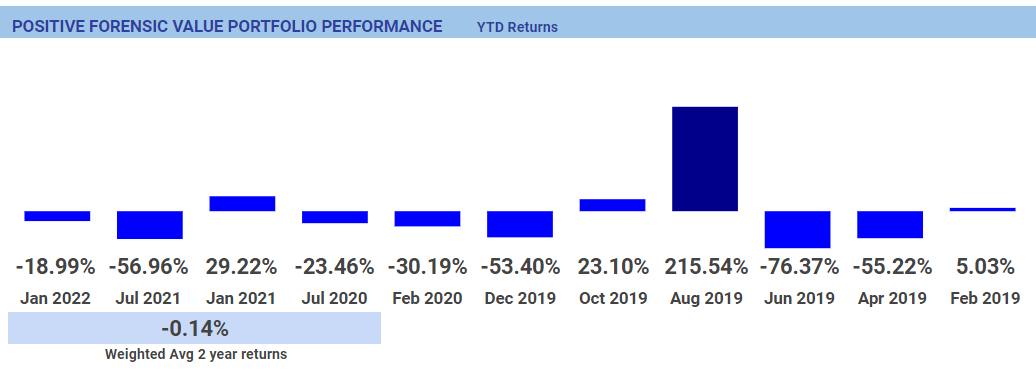
Exactly 1 year ago in the July 2021 selections the returns were substantially higher as shown below. Remarkably, the January 2021 portfolio has actually improved through the worst first half decline of the stock market in 52 years.
VMBreakouts.com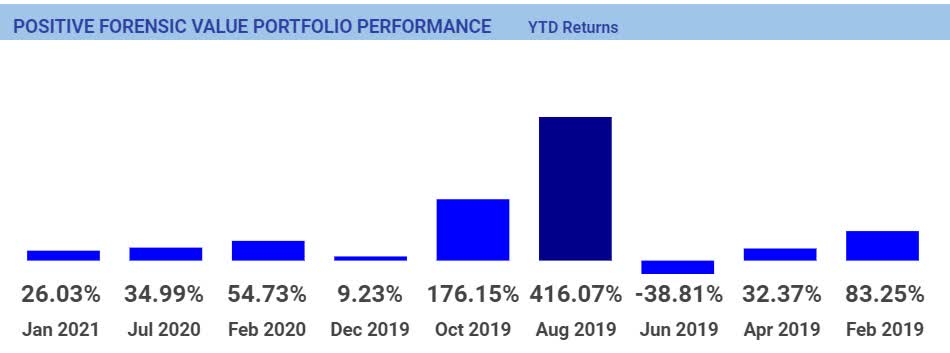
Top 10 performing prior positive forensic stocks since 2019:
| Symbol | Company Name | Price | Return from Selection |
| (MRNA) | Moderna Inc. | 149.95 | 1052.57% |
| (NRT) | North European Oil Royalty Trust | 12.34 | 329.97% |
| (RCUS) | Arcus Biosciences Inc. | 26.50 | 154.32% |
| (AXR) | AMREP Corporation | 11.26 | 96.51% |
| (TWST) | Twist Bioscience Corp. | 37.08 | 62.28% |
| (VUZI) | Vuzix Corp. | 6.70 | 56.91% |
| (RS) | Reliance Steel & Aluminum Co. | 171.07 | 42.86% |
| (YELP) | Yelp Inc. | 27.86 | 24.43% |
| (NRT) | North European Oil Royalty Trust | 12.34 | 23.40% |
| (DHIL) | Diamond Hill Investment Group, Inc. | 175.87 | 17.82% |
*NRT is in both the January 2021 and 2022 portfolios.
Out of more than 8,000 stocks screened across all the US exchanges, only 3 stocks qualified as highly positive across all the forensic algorithms for low risk of bankruptcy or financial irregularities. Most years the selections are fewer than 10 and this is a particularly small qualifying group. It is typical for there to be fewer qualifying positive than negative forensic stocks across all the algorithms. The three qualifying stocks sorted from the most favorable Beneish M-score are as follows:
Top Positive Forensic stocks for January 2022
UncleStock.com
These forensic scores do not necessarily forecast stock price growth. However, iTeos Therapeutics is up +12.03% in the first week of selection for this long term portfolio. It would seem likely that stocks with low risk of bankruptcy, low probability of corporate distress, low chance of earnings manipulation, and low probability of financial irregularities on deep fundamental analysis should provide a safer value proposition for investors going forward. Prof. Beneish has documented positive returns from a favorable M-score in his research.
Overall Scores Independent of Top Forensic Algorithms
An independent ranking of these firms using other value and growth rankings is shown below that may provide additional insight into the risk of these firms.
StockRover.com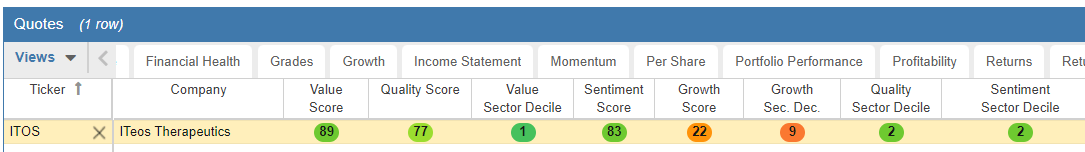
Morningstar Financial Health Grade
StockRover.com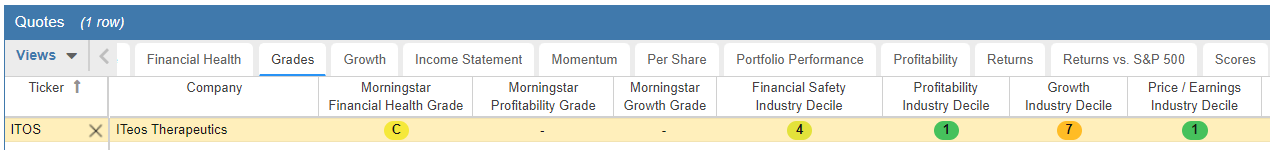
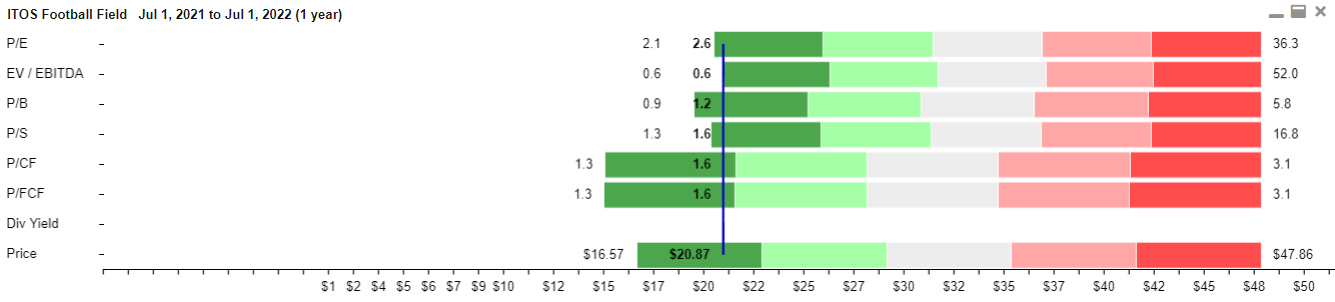
Top Positive Forensic Chart and new Football Field Valuation Chart
iTeos Therapeutics (ITOS)
Chart from selection date for members
FinViz.com StockRover.com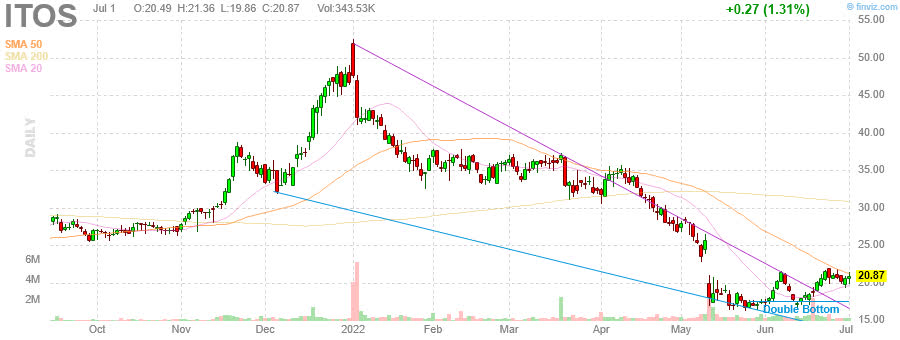
(FinViz.com)
StockRover.com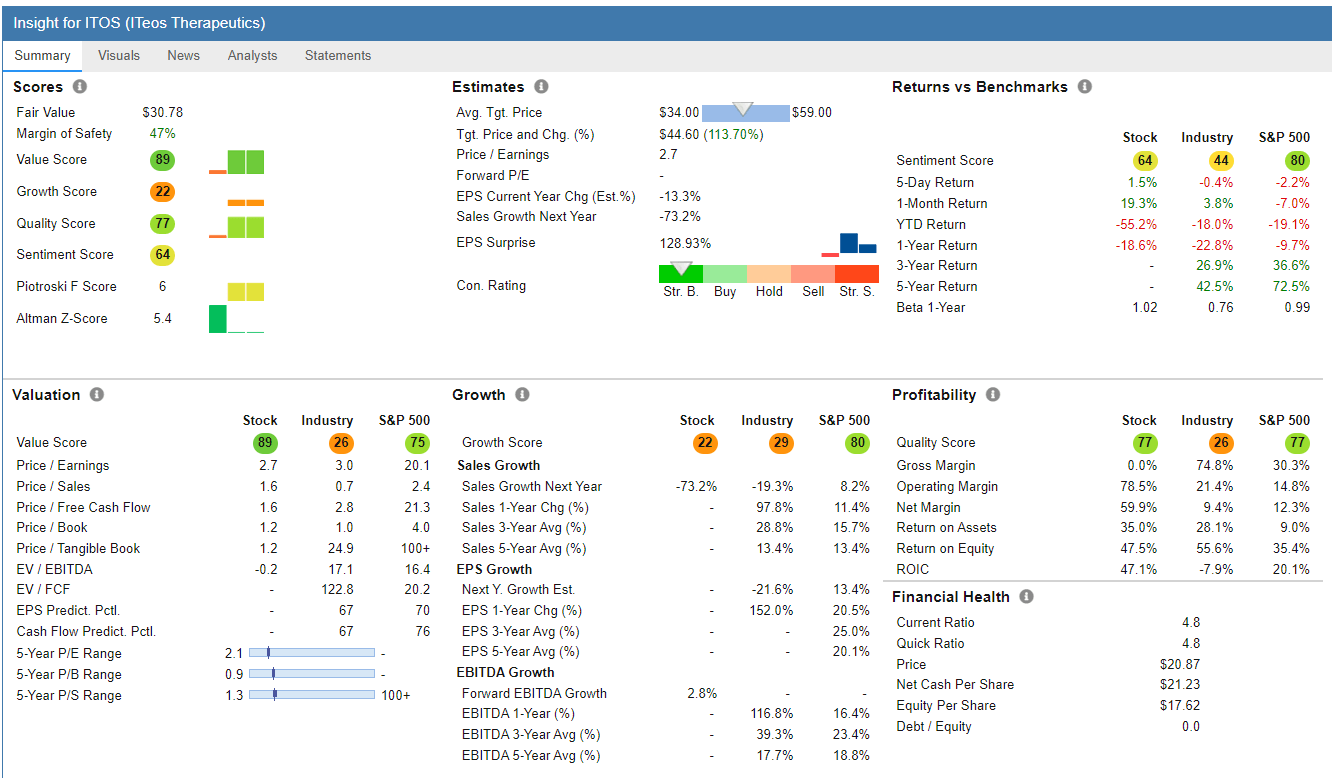
Methodology Review
The purpose of this multi-year forensic analysis study is to provide investors with additional tools to evaluate financial irregularities according to four different detection models from academic research. Circumstances surrounding firms are always subject to change, open to extenuating circumstances, and models by their very nature always contain a degree of error.
Again, it is important to stress that firms identified by these academic models may not be in actual distress or suffer from any adverse irregularities whatsoever. These models are certainly not foolproof and were designed by academic researchers to improve the chance of detection of irregularities leading to bankruptcy, earnings manipulation, or flag the presence of financial distress.
At the same time, these models are among the best peer-reviewed forensic models in the financial literature and have some significant documented value.
The Beneish model for example has “correctly identified, in advance of public disclosure, a large majority (71%) of the most famous accounting fraud cases that surfaced after the model’s estimation period” (Beneish, Lee, & Nichols, 2013, p. 57).
Further, in a survey of 169 chief financial officers of public companies, Dichev, Graham, and Rajgopal (2012) reported that respondents estimated that approximately 20% of all companies manage earnings to misrepresent economic performance. While three different financial forensic models are applied in the selection of these portfolios, researchers associated with testing the M-score described their approach this way:
Our main hypothesis was that companies that share traits with past earnings manipulators (i.e., those that “look like manipulators”) represent a particularly vulnerable type of growth stock. Because of their strong recent growth trajectory, these companies are likely to be more richly priced. At the same time, they exhibit a number of potentially problematic characteristics, indicative of either lower earnings quality or a more challenging economic environment. Although the accounting games such companies engage in might not be serious enough to warrant legal action, we posited that their earnings trajectory is more likely to disappoint investors (i.e., they have lower earnings quality)”
(Beneish, Lee, & Nichols, 2013, p. 57).
To my knowledge no similar longitudinal study of positive and adverse forensic scoring using all three models simultaneously has ever been conducted before. It is also important to constructively consider why such anomalies may exist in these stock selection at this moment in time. The resulting data which varies from month to month may prompt firms and investors to consider further due diligence of publicly available financial characteristics to mitigate any risk or error present in the marketplace.
Conclusion
42 forensic portfolios (21 positive forensic value / 21 negative forensic value) have been formed for evaluation since the testing period began in July 2017.
Over multiple one-year test periods we are seeing strong differentiation in results between negative and positive forensic portfolios. Most notably delistings of stocks (merger, acquisition, leaving the exchange) are approximately 10x higher among negative forensic stock selections than for positive forensic stocks. Over the years we see that price behavior is more stable among individual positive selections, but that greater returns are coming from the negative portfolios. In several years with nearly 30% better average returns across eight portfolios. Overall the negative forensic stocks are producing higher returns, with larger variability and at a much higher rate of mergers/delisting.
In prior years of this study these portfolio selections were made every 2 months. The overlap of selections was found to be quite high for these long term portfolios. Now the selections are made every six months with a minimum 2-year measurement period and there are still overlapping stocks from prior selections. Prior tests in the literature of the Beneish M-score have shown the algorithm to generate excellent results on an annual basis for positive scores. The tests continue and more explanations may develop over time.
I trust this research and stock selections will give you added value to your investment goals and returns in 2022!
JD Henning, PhD, MBA, CFE, CAMS
References
Altman, E. I. (1968). The Prediction of Corporate Bankruptcy: A Discriminant Analysis. The Journal of Finance, 23(1), 193–194. doi:10.1111/j.1540-6261.1968.tb03007.x
Beneish, M. D. (1999). The Detection of Earnings Manipulation. Financial Analysts Journal, 55(5), 24–36. doi:10.2469/faj.v55.n5.2296
Beneish, M. D., Lee, C. M. C., and Nichols, D. C. (2013). Earnings Manipulation and Expected Returns. Financial Analysts Journal, 69.2, 57-82.
Ohlson, J. A. (1980). Financial Ratios and the Probabilistic Prediction of Bankruptcy. Journal of Accounting Research, 18(1), 109. doi:10.2307/2490395
Be the first to comment