

rarrarorro
Investment Thesis
F Revenue (in billion $), EPS, FCF, and Dividends
S&P Capital IQ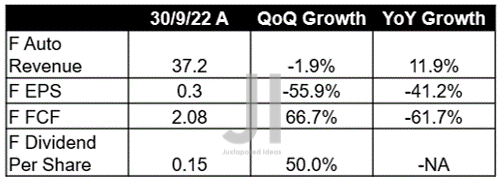
In its recent FQ3’22 earnings call, Ford (NYSE:F) reported lower gross margins of 8.8%, against FQ2’22 levels of 14% and FQ3’21 levels of 12%. Combined with the massive $2.7B in ARGO write-off, we are not surprised to see impacted top and bottom line growth QoQ and YoY, though its Free Cash Flow (FCF) generation of $2.08B is comparatively excellent against General Motors’ (NYSE:GM), as it has for the past few quarters.
Together with its impressive -$12.9B of automotive net debts in FQ3’22, after adjusting for $31.97B of cash and short-term investments, it is apparent that F remains remarkably well poised for growth and expansion ahead. As a result, we were not surprised by its 50% QoQ dividend growth to $0.15 then, despite the projected $7.88B of capital expenditure in FY2023.
GM Revenue (in billion $), EPS, FCF, and Dividends
S&P Capital IQ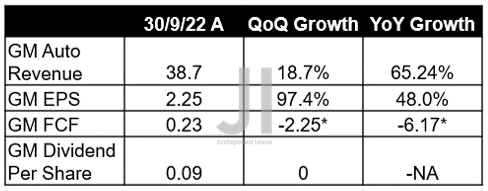
On the other hand, GM reported exemplary top and bottom-line growth QoQ and YoY in FQ3’22, due to its sustained gross margins of 14.1% against 14.4% in FQ3’21. Thereby, further boosting its EPS to $2.25 against the consensus estimate of $1.88. However, the company reported a minimal FCF generation of $0.23B then, though notably improved from FQ2’22 levels of -$2.25B and FQ3’21 levels of -$6.17B.
Therefore, it is encouraging that the GM management decided to announce a prudent $0.09 dividend for the latest quarter. It is obviously wiser to preserve and grow its immediate liquidity through the worsening macroeconomics, due to its elevated $9.75B in projected capital expenditure for 2023.
F’s Forward Performance Is Still Mostly Intact & Dividends Growth Remains Excellent
F Projected Revenue, Net Income (in billion $) %, EBIT %, and EPS
S&P Capital IQ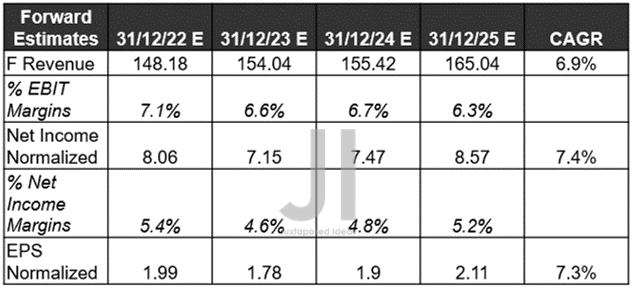
Despite the continually robust new vehicles sales in the October CPI reports at 0.5% sequentially and 8.4% YoY, it is apparent that Mr. Market is more bearish than expected, due to the continued downgrades in F’s top and bottom lines by -5.58% and -8.79% since July 2022, respectively. However, regardless of the peak recessionary fears and the Fed’s hikes through 2023, it is important that these numbers represent tremendous improvements from its historical revenue CAGR of -2.3%, net income of -1.8%, and EPS of -2%, between FY2016 and FY2021.
In addition, F is expected to record an adj EPS of $1.78 by FY2023, hitting the upper range of pre-pandemic levels. Thus, demonstrating the management’s excellent operational efficiency despite the aggressive $50B investment in electrification through 2026.
F Projected FCF (in billion $) % and Dividends
S&P Capital IQ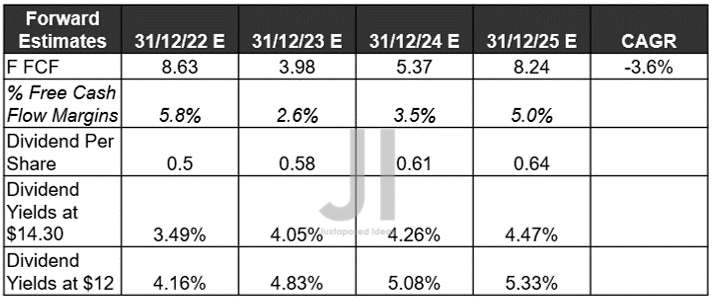
Furthermore, we must point out the massive expansion in F’s EBIT/ net income/ FCF margins from 3.4%/3.3%/1.9% in FY2019, to 5.9%/5.1%/7.6% in FY2021, and finally to 6.3%/5.2%/5% by FY2025. Furthermore, the company is expected to report sustained net debt levels of -$12.41B through FY2025, with only a total of $3.94B of automotive long-term debts due by FY2024.
Most importantly, F is expected to continue growing its dividend payout at a CAGR of 58.78% between FY2021 and FY2025, indicating forward yields of 4.47% based on current share prices. Otherwise, at 5.33% for those who had loaded up at the recent bottom, compared to its pre-pandemic 4Y average of 6.52% and industry mean of 0.6%. Therefore, it is no wonder that the stock continues to record a decent 5Y total price return of 43.3%, despite the tragic correction since early 2022.
GM’s Dividend Yields Is The Stark Differentiating Factor For Now
GM Projected Revenue, Net Income (in billion $) %, EBIT %, and EPS
S&P Capital IQ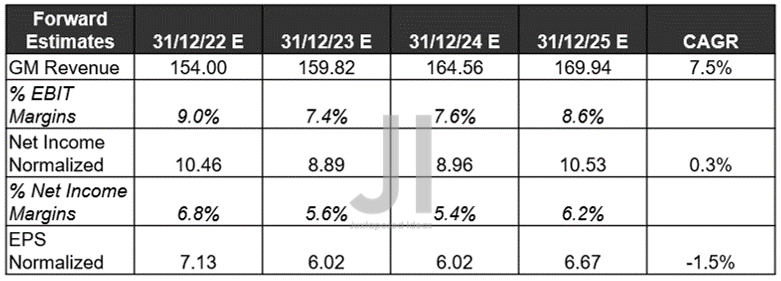
GM is similarly expected to report excellent top-line growth ahead, at a CAGR of 7.5% between FY2021 and FY2025, compared to its historical CAGR of -4.1%. Nonetheless, it is apparent that there will be minimal profit growth ahead, against the historical net income CAGR of 1.6% and EPS CAGR of 2.9%, despite the sustained margins through FY2025.
GM Projected FCF (in billion $) % and Dividends
S&P Capital IQ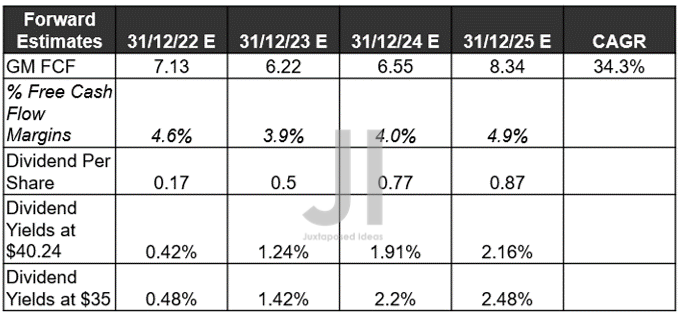
In contrast, GM is expected to report a stellar expansion in its FCF generation to $8.34B by FY2025, compared to FY2018 levels of $3.84B and FY2021 levels of $2.56B. Combined with a minimal $2.89B of automotive long-term debts due by FY2024, it is evident that the company will enjoy improved liquidity ahead, which has been growing impressively by 37.65% YoY by FQ3’22. It reported massive improvements in its automotive net debts to -$7.43B in FQ3’22 after adjusting for $26.21B of cash and short-term investments, against -$2.67B and $19.04B in FQ3’21.
Accordingly, analysts are forecasting a slight increase in FY2023 dividends to $0.5, though still a far cry from pre-pandemic levels of $1.52. Therefore, explaining the minimal dividend yields of 1.24% then, compared to its pre-pandemic 4Y average of 4.21%. It is no wonder that certain investors have been unhappy with GM’s minimal dividends thus far, impacting the recovery of its stock prices at a 5Y total price return of 2.5%, compared to F’s.
In the meantime, we encourage you to read our previous article, which would help you better understand its position and market opportunities.
- Ford: Demand Destruction For America’s Most Popular Truck? Not Likely
- General Motors: Fire Up The Motor – Ignore The FUD On Demand Destruction
So, Is F & GM Stock A Buy, Sell, or Hold?
F & GM YTD EV/Revenue and P/E Valuations
S&P Capital IQ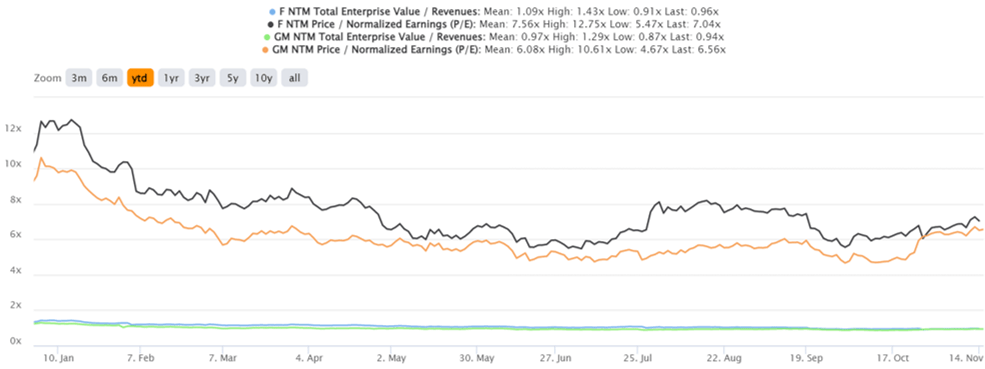
It is evident that both F & GM are trading optimistically, due to the recovery of their P/E valuations to 7.04x and 6.56x, respectively, from recent YTD lows of 5.47x and 4.67x. Furthermore, both stocks are also trading above their 50-day moving average of $13.10 and $37.01, significantly aided by the upbeat October CPI report. The latter has triggered 80.6% of analysts to predict a highly optimistic Fed pivot by the upcoming December meeting. A similar moderation is already seen in the Bank of Canada’s 50 basis points hike, indicating three reasonable hikes ahead to reach analysts’ terminal rate near 6%.
F & GM YTD Stock Price
Seeking Alpha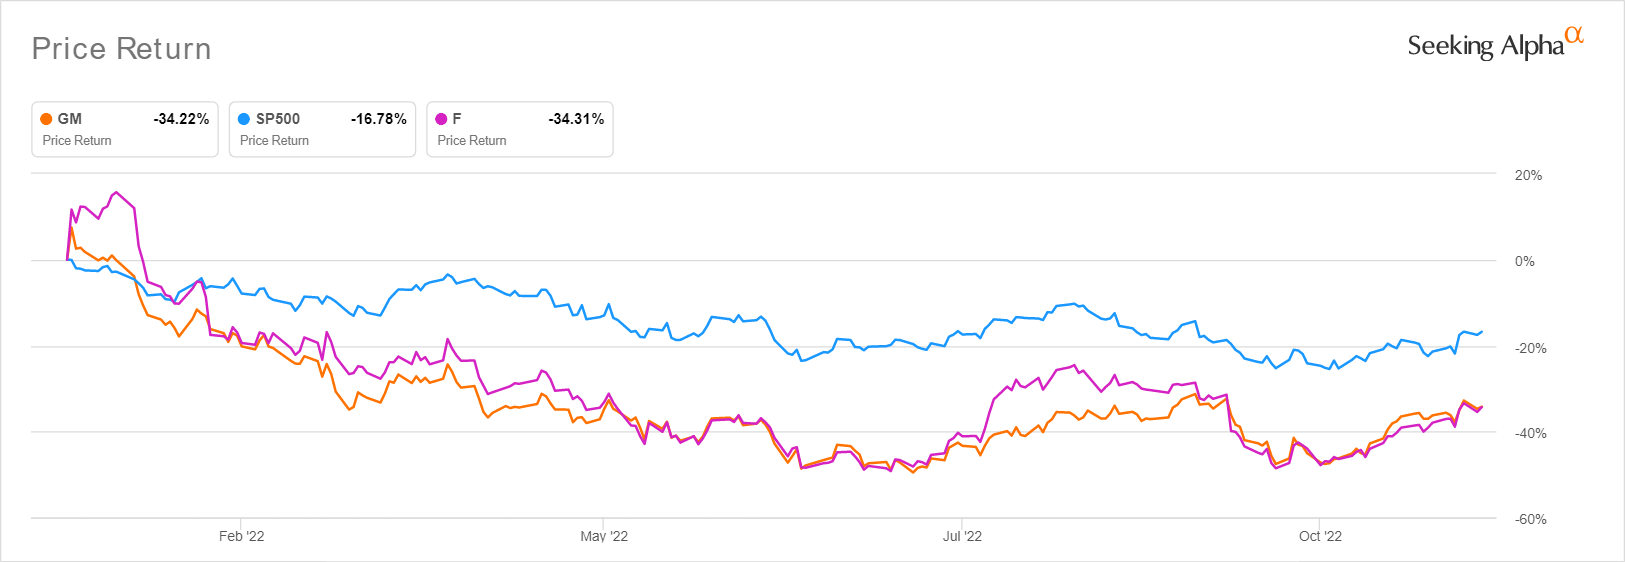
Nonetheless, investors need not fret with analysts’ price targets of $18.71 for F and $50.50 for GM, representing more than healthy 30.84% and 25.50% upsides from current stock prices. Therefore, investors with higher risk tolerance and long-term trajectory may still nibble F at current prices, further sweetened by its robust dividend yields through FY2025. On the other hand, one should wait for a moderate retracement before adding GM, given the relatively unattractive risk-reward ratio.
Naturally, portfolios should also be sized appropriately, since the speculative pivot may not occur as early as expected by Mr. Market. Thereby, potentially plunging the market and testing the previous October lows by 14 December 2022. We’ll see.
Be the first to comment